Upgrade to Pro — share decks privately, control downloads, hide ads and more …

Analyzing Latency of IO events

Archit Sharma
February 05, 2016

Analyzing Latency of IO events

https://devconfcz2016.sched.org/event/5m02/analyzing-kvm-blockio-event-latency

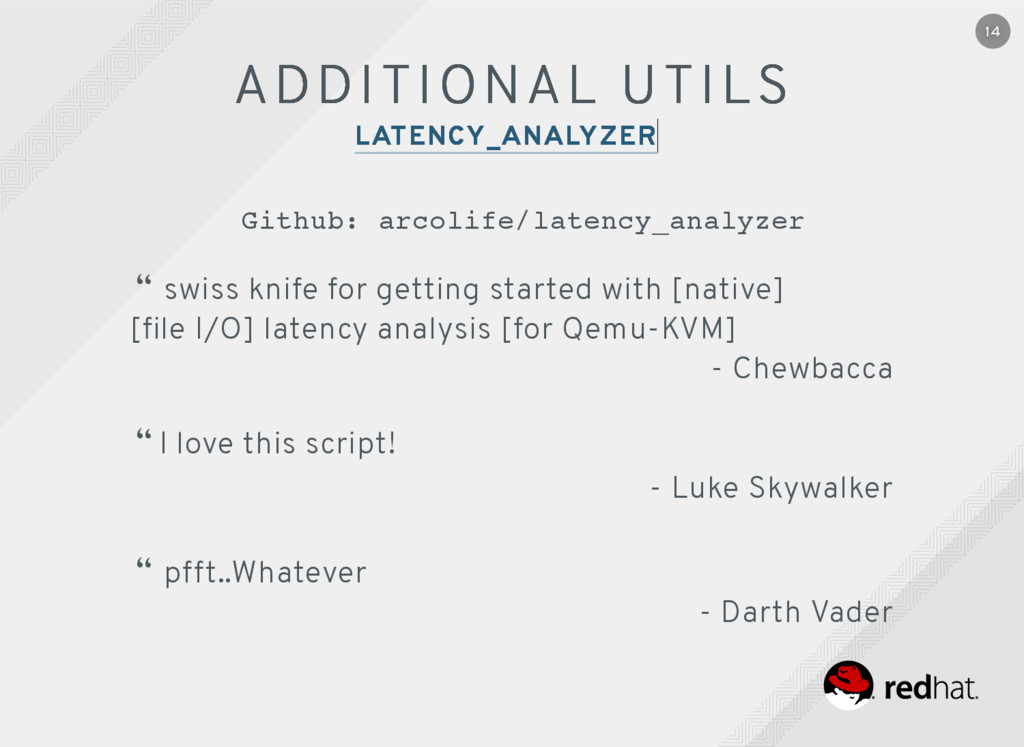
The workshop init script 'vm_env_setup.sh' is in http://github.com/arcolife/latency_analyzer/

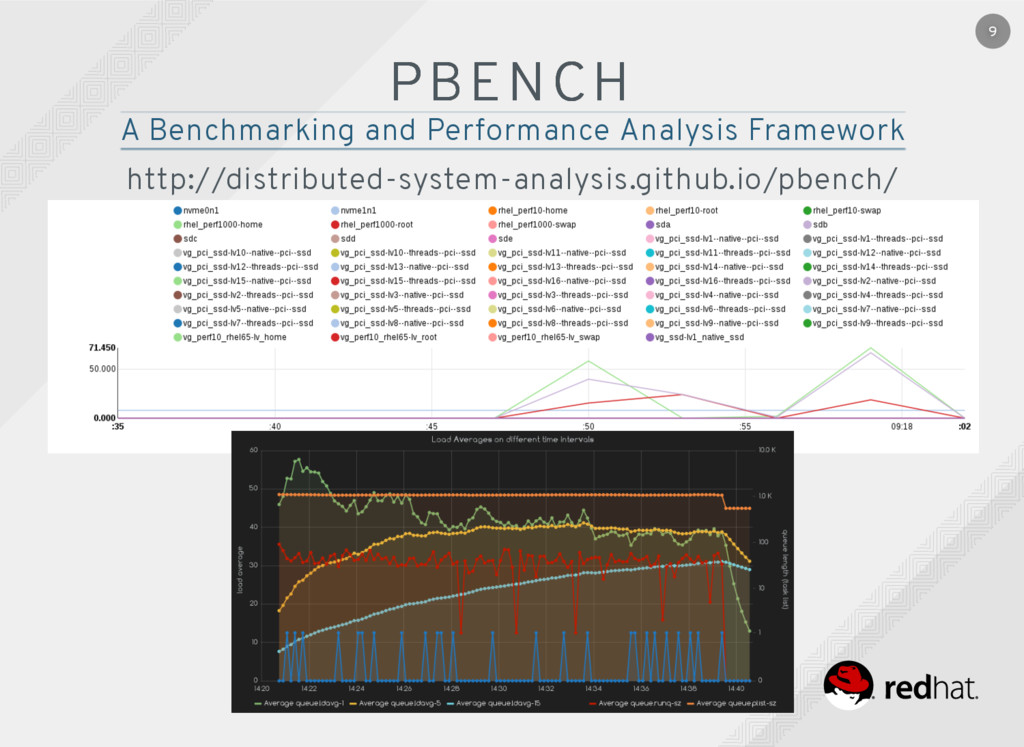
So, this is an ongoing investigation of KVM blockIO event tracing and analysis, within the performance engineering team at Red Hat. During this process, we have come come across a few anomalies which we'd like to share with the community to gain support and contribution for tooling/kernel modules of Linux, associated with performance. We have, as a part of this investigation, also released a couple of tools, which we'd like to showcase at DevConf.

This talk is intended for system admins as well as those seeking general performance tuning/analysis. The lab would be a mix of a brief overview followed by a hands on tracing of events, analysis of a test case and reaching conclusions based on that result.

The project link is a work in progress but we have released some utilities and will continue to work on the following repositories as well:
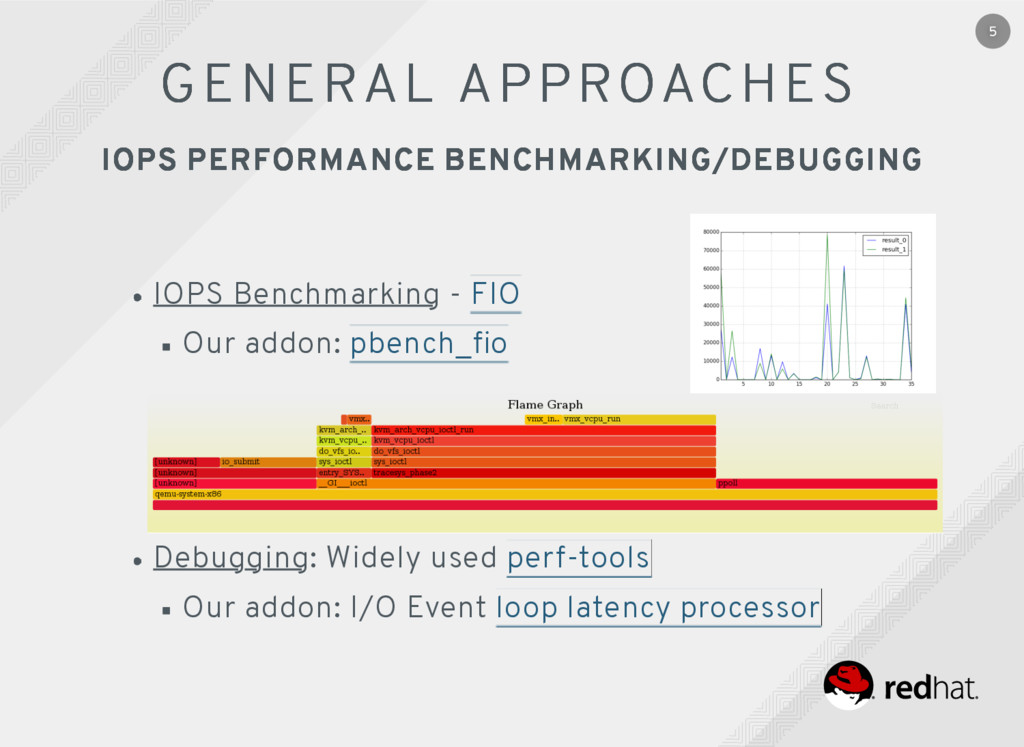
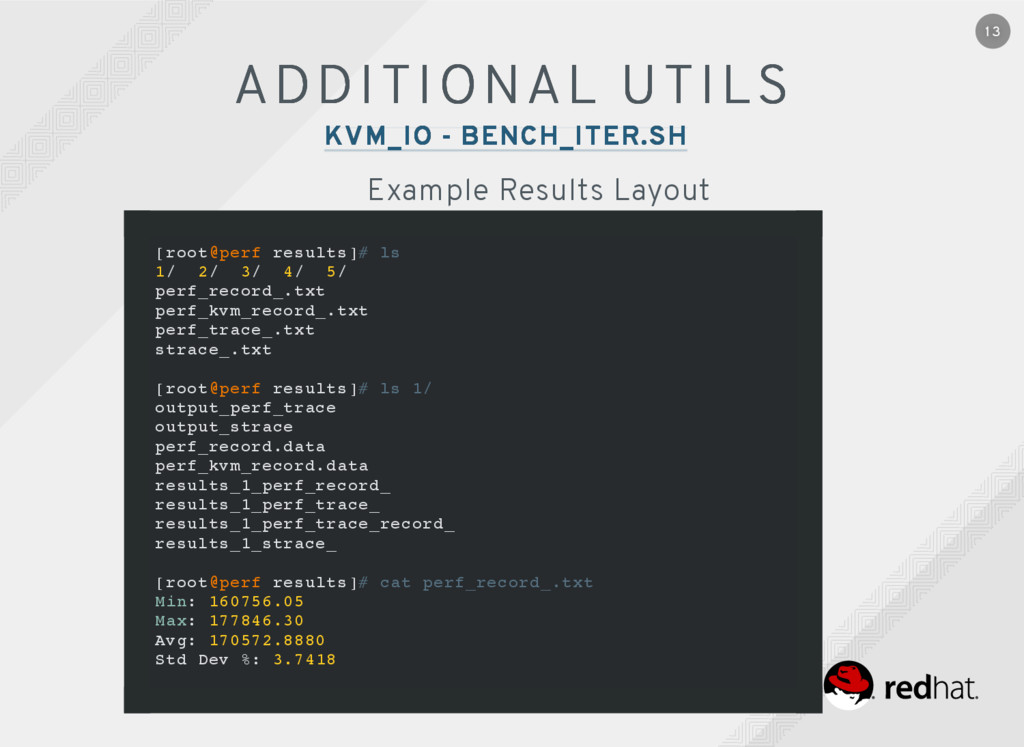
- http://github.com/psuriset/kvm_io/
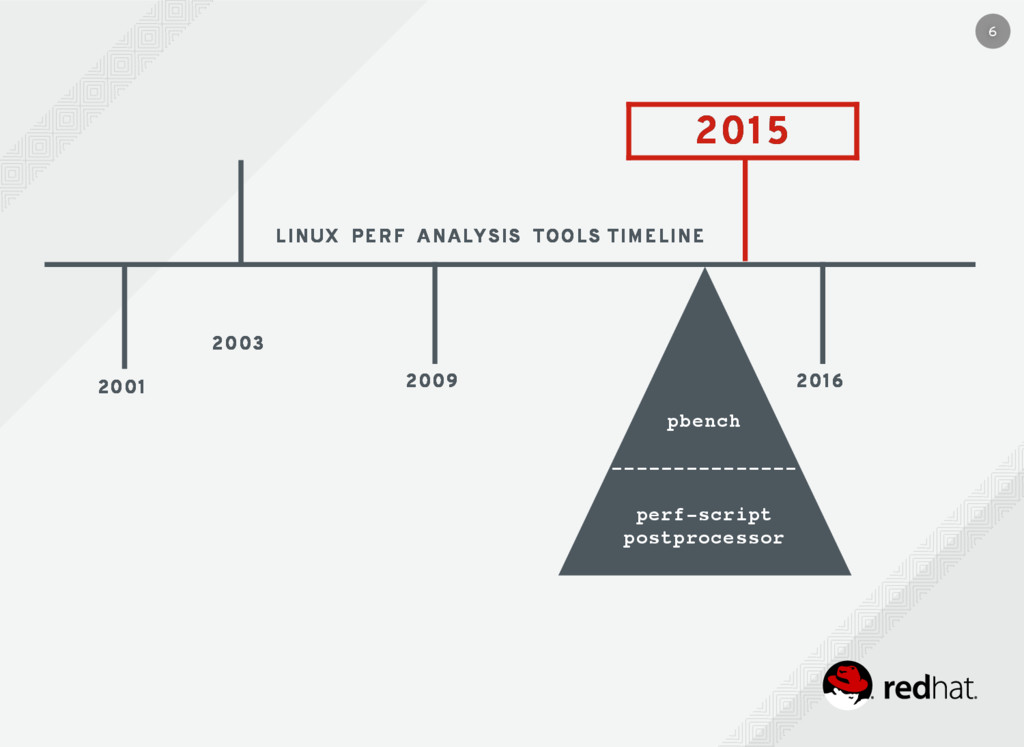
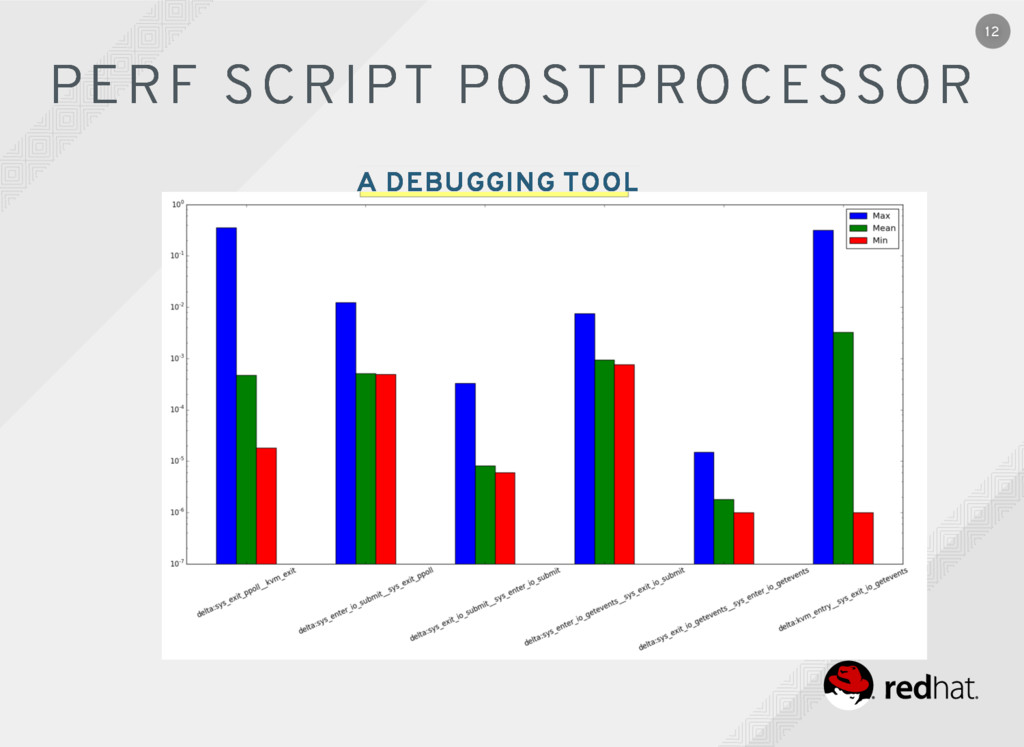
- http://github.com/arcolife/perf-script-postprocessor

Please note that vm_env_setup.sh runs perfectly on fedora 23. If you have other distros/versions, kindly at least do the following, to speed up the workshop:

install the pip2 module perf-script-postprocessor. You might get dependency erros on rpm based systems. So install the equivalent of following packages.
gcc lapack lapack-devel blas blas-devel gcc-gfortran gcc-c++ liblas libffi-devel libxml-devel libxml2-devel libxslt-devel redhat-rpm-config

install @Virtualization packages for your distro, as well as qemu-kvm ..so we could use virsh / virt-install / qemu-kvm as accelerator..

run the following part from vm_env_setup.sh, as following..

# ./handy_minimalistic.sh

Cheers.

-----
Youtube: https://www.youtube.com/watch?v=fJRMhT_V6_E

Archit Sharma

February 05, 2016
Tweet

More Decks by Archit Sharma

Other Decks in Technology

Transcript

  1. 1 ANALYZING LATENCY ANALYZING LATENCY OF OF I/O EVENTS I/O

    EVENTS ARCHIT SHARMA ARCHIT SHARMA ASSOCIATE PERFORMANCE ENGINEER ASSOCIATE PERFORMANCE ENGINEER BLR | Red Hat India Pvt. Ltd.
  2. 2 An I/O use case The investigation: Block I/O events

    native vs. threads in Qemu-KVM IOPS performance benchmarking/debugging General approaches Tools/utilities we've rolled out: includes benchmarking IOPS postprocessing that data Applicability of Latency analysis THINGS WE'RE GONNA THINGS WE'RE GONNA TALK ABOUT TALK ABOUT
  3. 3 Whether the delay is being produced by filesystem /

    kvm layer? IO engines: How does async compare to sync ? How does a setup with target:threads compare to one with target:native for a kernel version? Would I achieve better results if I changed iodepth? Block I/O and File I/O USE CASE USE CASE I/O EVENTS IN QEMU-KVM I/O EVENTS IN QEMU-KVM
  4. 4 [Native] kvm_exit -> sys_exit_ppoll -> sys_enter_io_submit -> sys_exit_io_submit ..

    .. -> sys_enter_io_getevents -> sys_exit_io_getevents BLOCK I/O EVENTS IN QEMU- BLOCK I/O EVENTS IN QEMU- KVM KVM An investigation of blockIO events: tracing and analyzing them Came up with a couple of utilities to help analyze I/O latency..
  5. 5 GENERAL APPROACHES GENERAL APPROACHES IOPS Benchmarking - Our addon:

    Debugging: Widely used Our addon: I/O Event FIO pbench_fio perf-tools loop latency processor IOPS PERFORMANCE BENCHMARKING/DEBUGGING IOPS PERFORMANCE BENCHMARKING/DEBUGGING
  6. 6 2003 2003 2001 2001 2009 2009 2016 2016 2015

    2015 LINUX PERF ANALYSIS TOOLS TIMELINE LINUX PERF ANALYSIS TOOLS TIMELINE pbench --------------- perf-script postprocessor
  7. 7 PBENCH PBENCH http://distributed-system-analysis.github.io/pbench/ A Benchmarking and Performance Analysis Framework

    Allows commonly used / even custom benchmarking scripts! Dynamic visualizations enabling hands-on exploration and deeper insights into potential bottleneck regions Easy to use and setup Exciting upcoming features.. Open for contributions!
  8. 8 PBENCH PBENCH http://distributed-system-analysis.github.io/pbench/ A Benchmarking and Performance Analysis Framework

    1 A collection agent (pbench-agent) -> Handles TLC - Telemetry, Logs and Configurations 2 Background tasks (bgtasks) -> Archives result tar balls, indexes them, and unpacks them for display. 3 Web server -> display various graphs and results
  9. 10 Hands-on tracing with flexible approach specify your own event

    loops! Lots of use cases - disk I/O, network I/O, .. A statistical, descriptive and visual approach to latency analysis Available on pypi! $ pip install perf-script-postprocessor PERF SCRIPT POSTPROCESSOR PERF SCRIPT POSTPROCESSOR A DEBUGGING TOOL A DEBUGGING TOOL Github: arcolife/perf-script-postprocessor
  10. 11 PERF SCRIPT POSTPROCESSOR PERF SCRIPT POSTPROCESSOR A DEBUGGING TOOL

    A DEBUGGING TOOL (PERF TOOLS) - $ PERF KVM RECORD (PERF TOOLS) - $ PERF KVM RECORD GENERATES BINARY DATA FILE GENERATES BINARY DATA FILE PERF.DATA PERF.DATA $ PERF_SCRIPT_PROCESSOR $ PERF_SCRIPT_PROCESSOR {MEAN, MEDIAN, STD_DEVIATION} {MEAN, MEDIAN, STD_DEVIATION} EVENT LOOP LATENCIES EVENT LOOP LATENCIES
  11. 13 ADDITIONAL UTILS ADDITIONAL UTILS KVM_IO - BENCH_ITER.SH KVM_IO -

    BENCH_ITER.SH [root@perf results]# ls 1/ 2/ 3/ 4/ 5/ perf_record_.txt perf_kvm_record_.txt perf_trace_.txt strace_.txt [root@perf results]# ls 1/ output_perf_trace output_strace perf_record.data perf_kvm_record.data results_1_perf_record_ results_1_perf_trace_ results_1_perf_trace_record_ results_1_strace_ [root@perf results]# cat perf_record_.txt Min: 160756.05 Max: 177846.30 Avg: 170572.8880 Std Dev %: 3.7418 Example Results Layout
  12. 14 ADDITIONAL UTILS ADDITIONAL UTILS LATENCY_ANALYZER LATENCY_ANALYZER “ swiss knife

    for getting started with [native] [file I/O] latency analysis [for Qemu-KVM] - Chewbacca “ I love this script! - Luke Skywalker “ pfft..Whatever - Darth Vader Github: arcolife/latency_analyzer
  13. 15 WHY ANALYZE LATENCY ? WHY ANALYZE LATENCY ? Code

    Optimization eg: OS profiling Distributed Computing latency distributions Cache tuning distributed cache performance (timed cache access)^N Web Performance high latency may involve: Load Balancing Network Latency Web server configuration Performance Engineering (throughput & latency) Databases recommended I/O schedulers memory / caching Virtualization Block and File I/O Networking Network I/O ..
  14. 16 1 how much time spent on each event, WHILE

    control is in user/kernel space 2 Sorting out anomalies: IOPS throughput different with strace, perf record .. At the same time, nr values should be long (they're not when using perf record). 3 .. ? FOOD FOR THOUGHT? FOOD FOR THOUGHT?