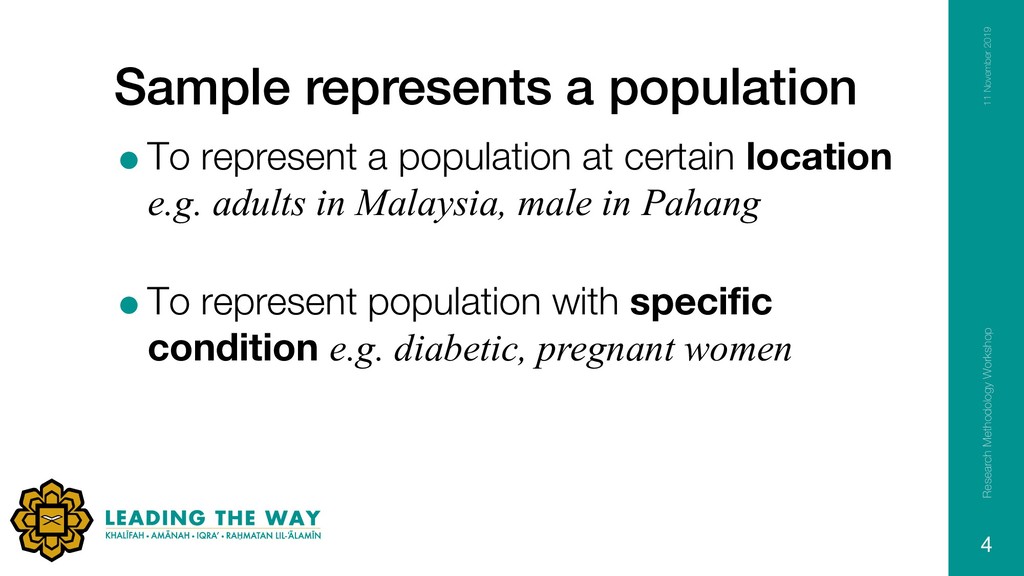
location e.g. adults in Malaysia, male in Pahang =To represent population with specific condition e.g. diabetic, pregnant women 11 November 2019 4 Research Methodology Workshop
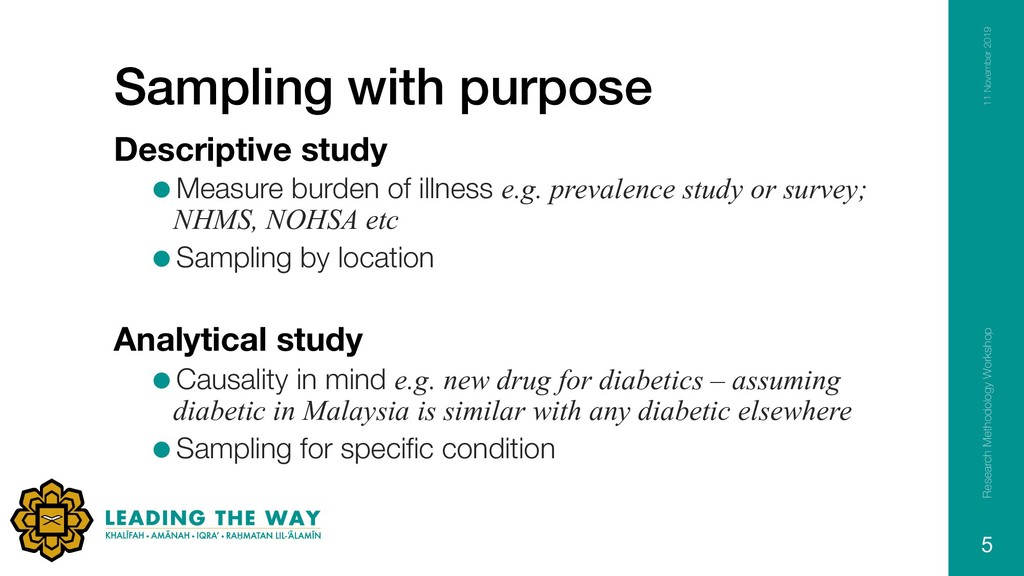
prevalence study or survey; NHMS, NOHSA etc =Sampling by location Analytical study =Causality in mind e.g. new drug for diabetics – assuming diabetic in Malaysia is similar with any diabetic elsewhere =Sampling for specific condition 11 November 2019 5 Research Methodology Workshop
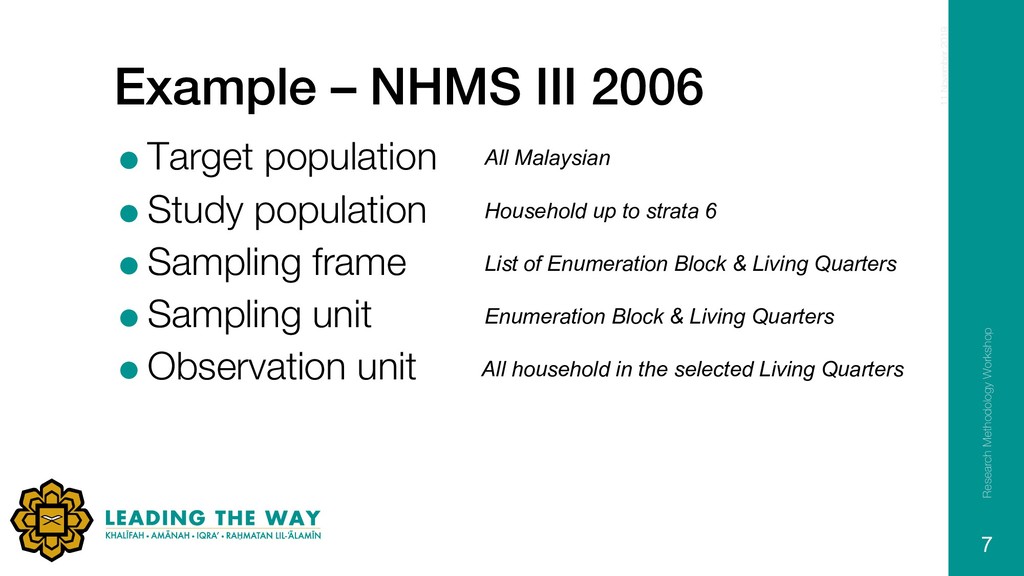
frame =Sampling unit =Observation unit 11 November 2019 7 All Malaysian Household up to strata 6 List of Enumeration Block & Living Quarters Enumeration Block & Living Quarters All household in the selected Living Quarters Research Methodology Workshop
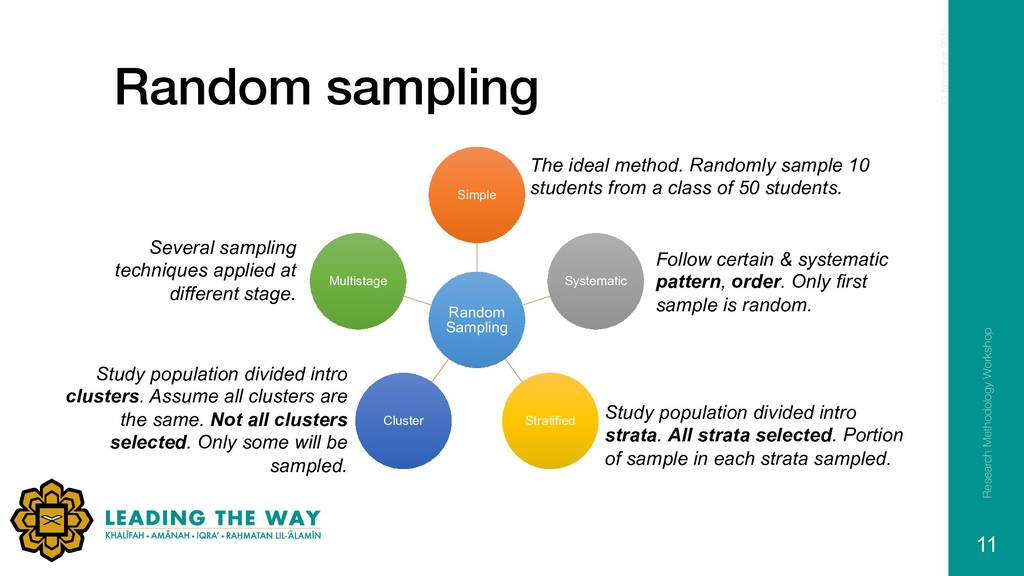
November 2019 11 The ideal method. Randomly sample 10 students from a class of 50 students. Follow certain & systematic pattern, order. Only first sample is random. Study population divided intro strata. All strata selected. Portion of sample in each strata sampled. Study population divided intro clusters. Assume all clusters are the same. Not all clusters selected. Only some will be sampled. Several sampling techniques applied at different stage. Research Methodology Workshop
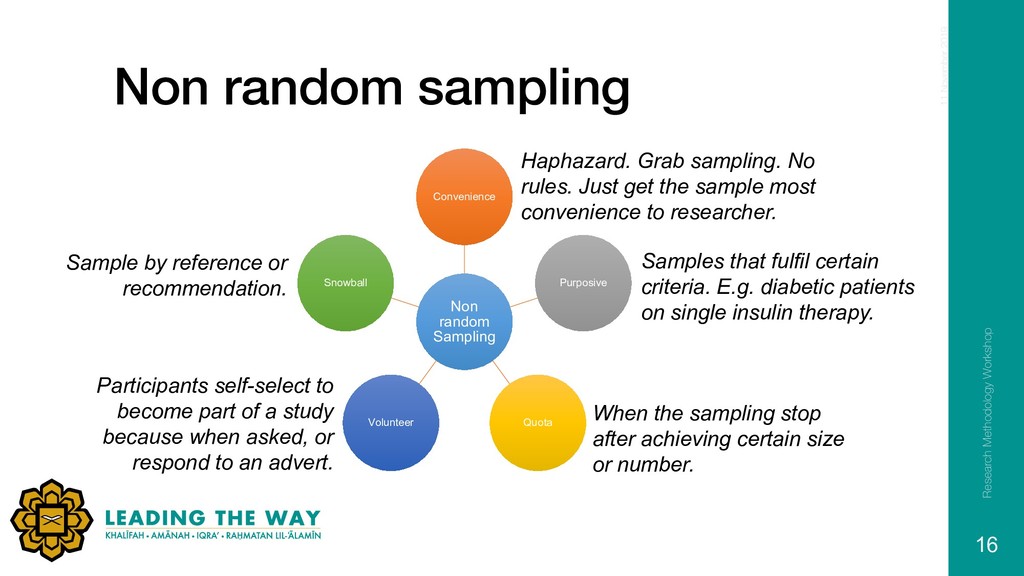
Snowball 11 November 2019 16 Haphazard. Grab sampling. No rules. Just get the sample most convenience to researcher. Samples that fulfil certain criteria. E.g. diabetic patients on single insulin therapy. When the sampling stop after achieving certain size or number. Sample by reference or recommendation. Research Methodology Workshop Participants self-select to become part of a study because when asked, or respond to an advert.
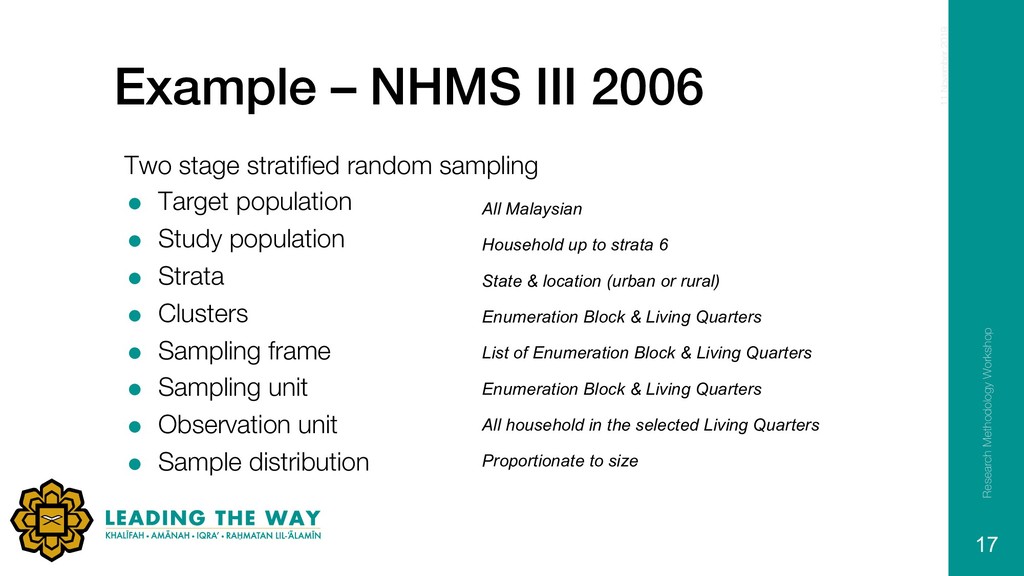
= Target population = Study population = Strata = Clusters = Sampling frame = Sampling unit = Observation unit = Sample distribution 11 November 2019 17 All Malaysian Household up to strata 6 List of Enumeration Block & Living Quarters Enumeration Block & Living Quarters All household in the selected Living Quarters State & location (urban or rural) Enumeration Block & Living Quarters Proportionate to size Research Methodology Workshop
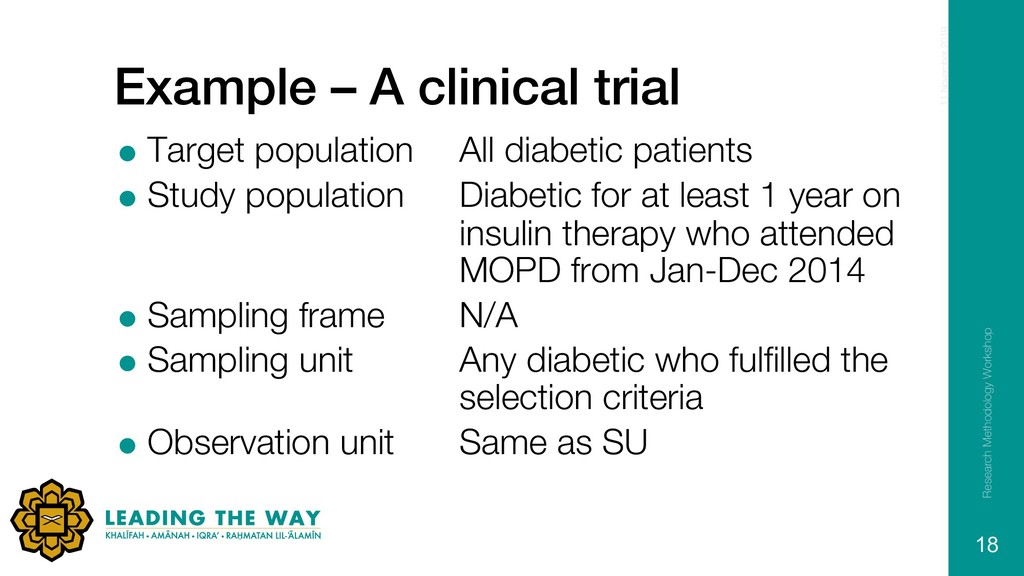
patients = Study population Diabetic for at least 1 year on insulin therapy who attended MOPD from Jan-Dec 2014 = Sampling frame N/A = Sampling unit Any diabetic who fulfilled the selection criteria = Observation unit Same as SU 11 November 2019 18 Research Methodology Workshop
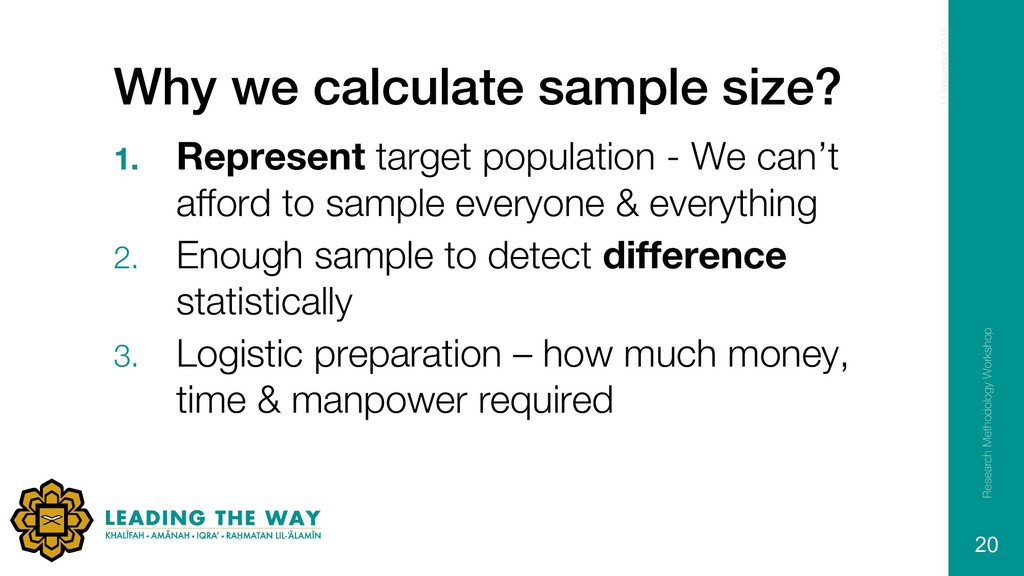
We can’t afford to sample everyone & everything 2. Enough sample to detect difference statistically 3. Logistic preparation – how much money, time & manpower required 11 November 2019 20 Research Methodology Workshop
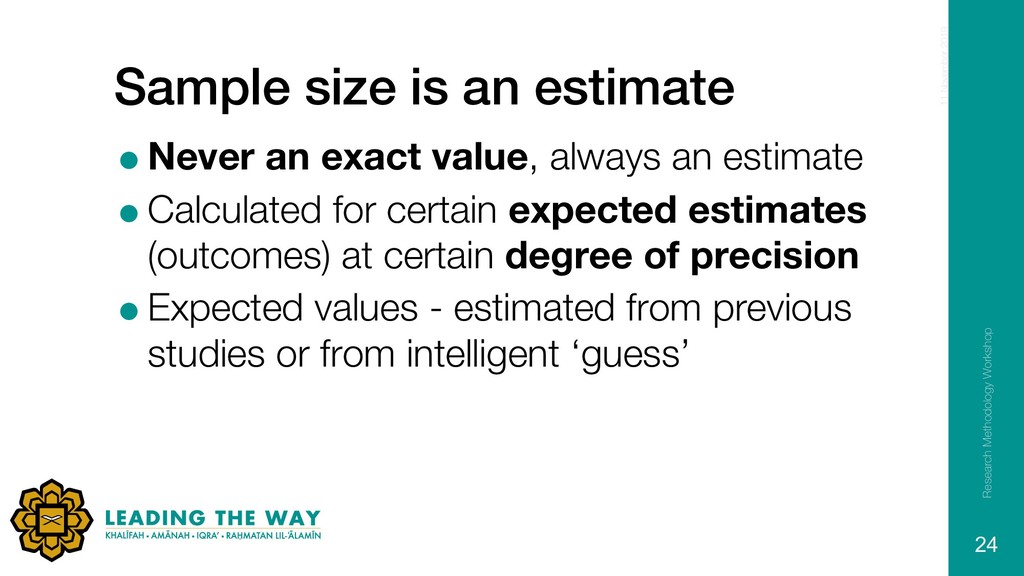
an estimate =Calculated for certain expected estimates (outcomes) at certain degree of precision =Expected values - estimated from previous studies or from intelligent ‘guess’ 11 November 2019 24 Research Methodology Workshop
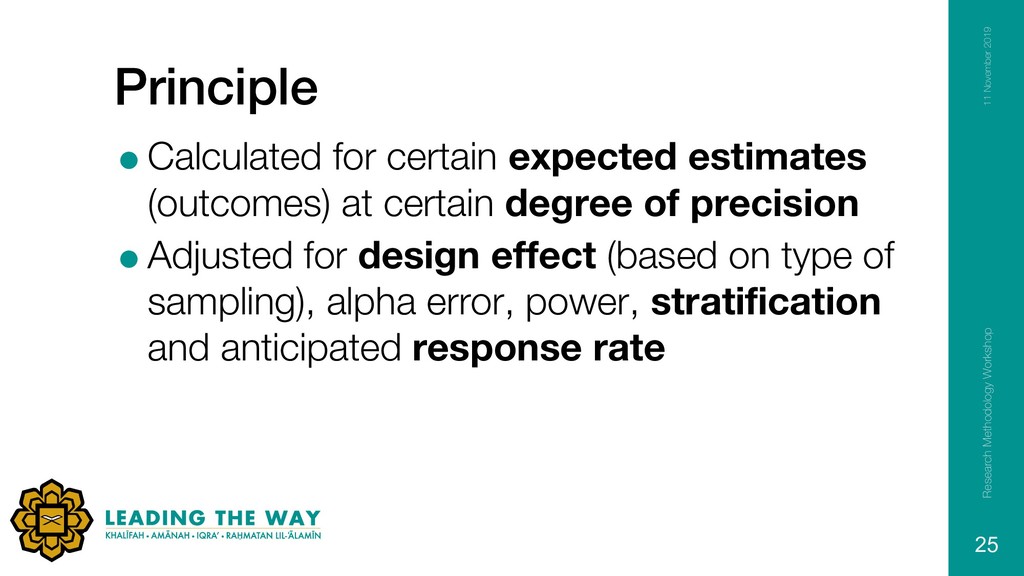
of precision =Adjusted for design effect (based on type of sampling), alpha error, power, stratification and anticipated response rate 11 November 2019 Research Methodology Workshop 25
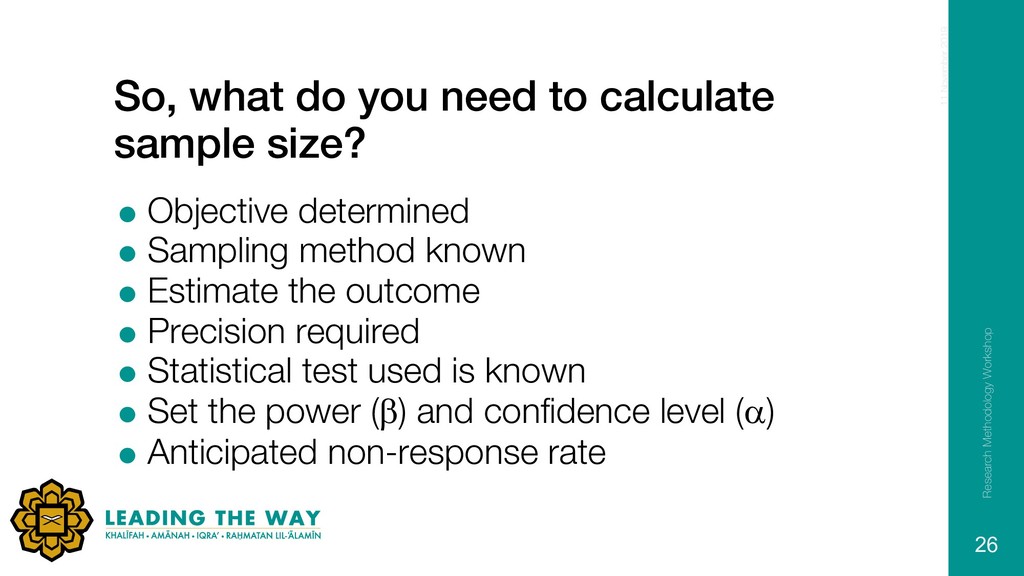
Objective determined = Sampling method known = Estimate the outcome = Precision required = Statistical test used is known = Set the power (b) and confidence level (a) = Anticipated non-response rate 11 November 2019 26 Research Methodology Workshop
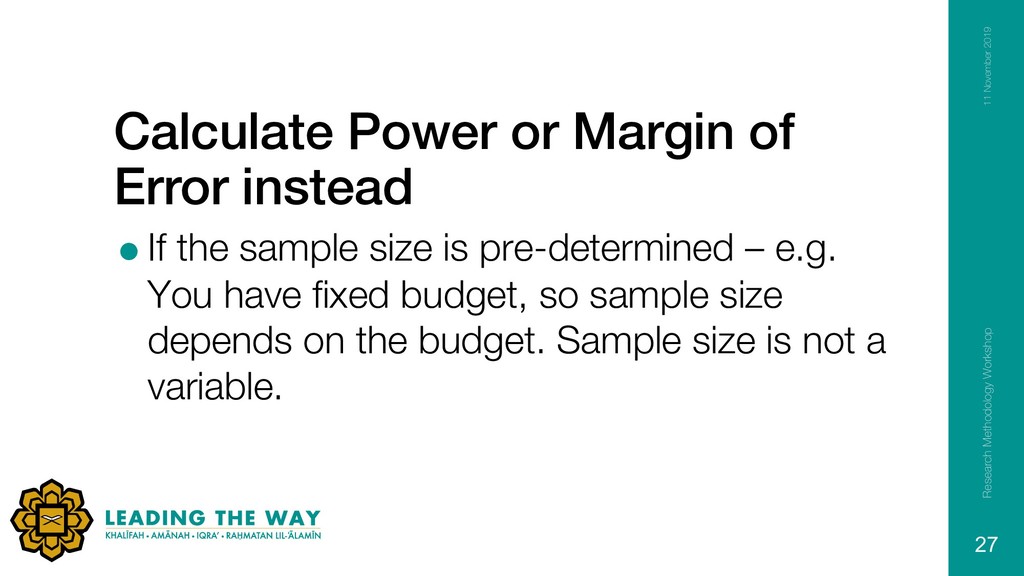
size is pre-determined – e.g. You have fixed budget, so sample size depends on the budget. Sample size is not a variable. 11 November 2019 Research Methodology Workshop 27
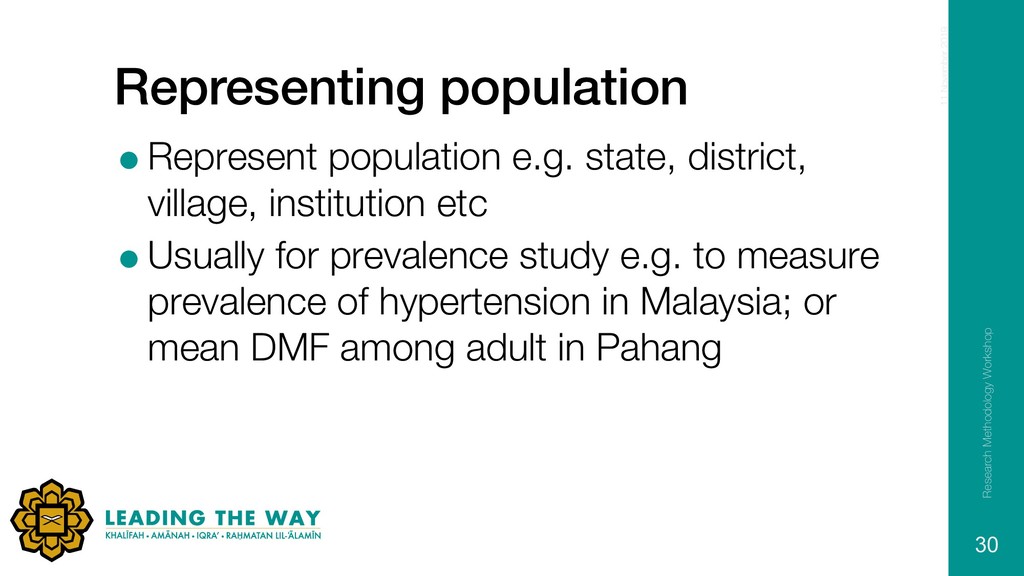
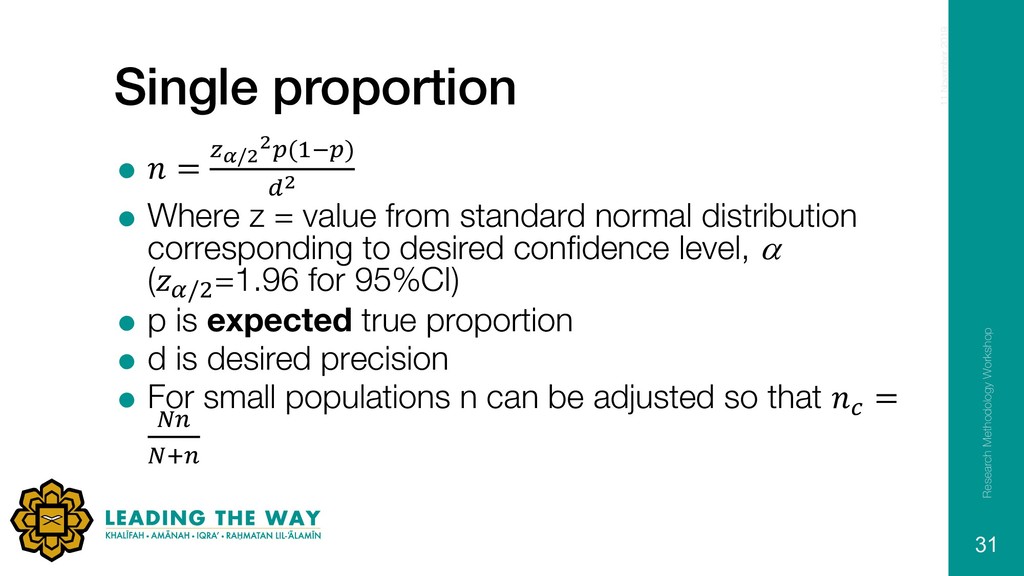
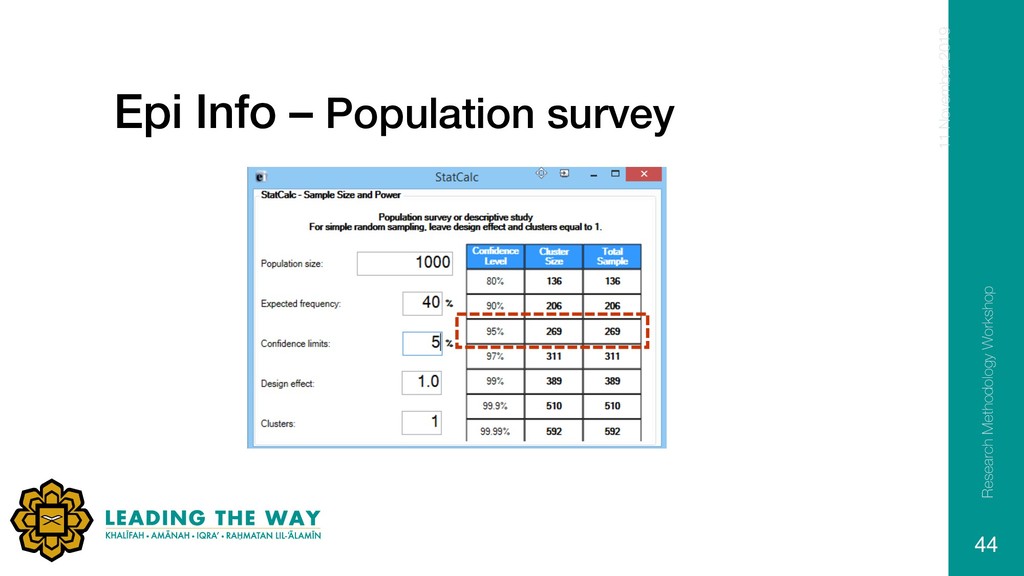
=Usually for prevalence study e.g. to measure prevalence of hypertension in Malaysia; or mean DMF among adult in Pahang 11 November 2019 30 Research Methodology Workshop
= value from standard normal distribution corresponding to desired confidence level, a (.// =1.96 for 95%CI) = p is expected true proportion = d is desired precision = For small populations n can be adjusted so that 0 = 12 132 11 November 2019 31 Research Methodology Workshop
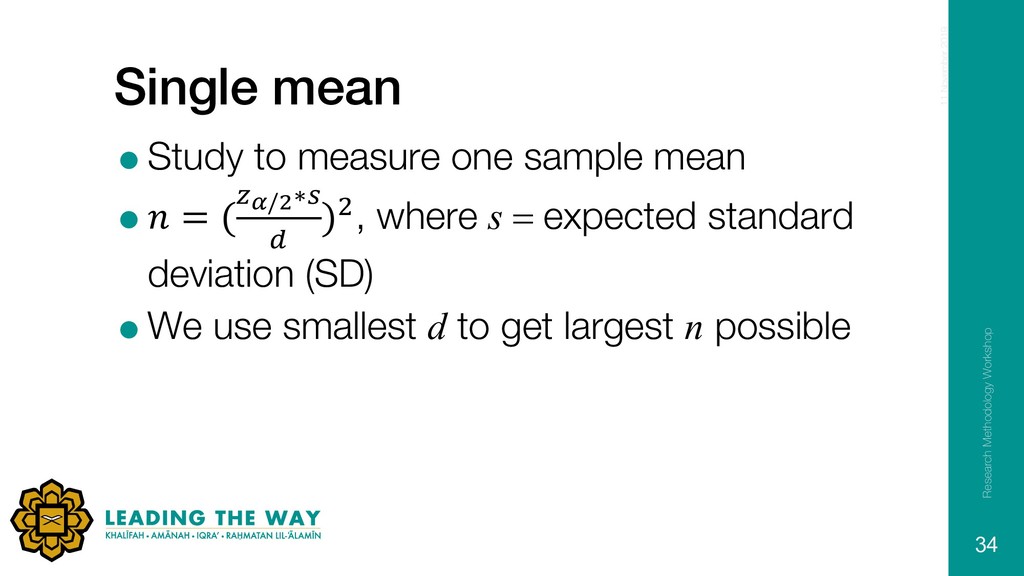
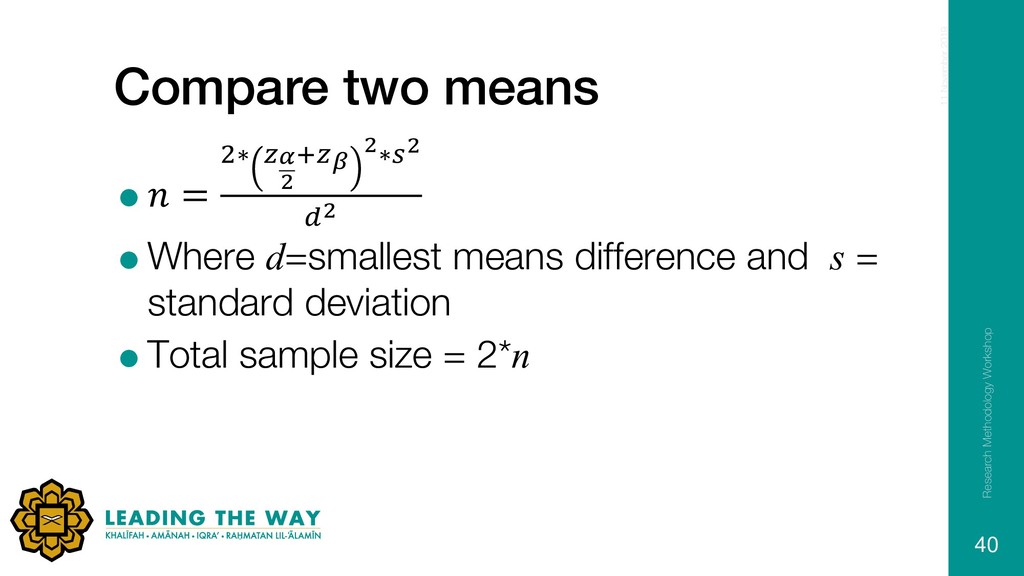
(#$/&∗D , )/, where s = expected standard deviation (SD) =We use smallest d to get largest n possible 11 November 2019 34 Research Methodology Workshop
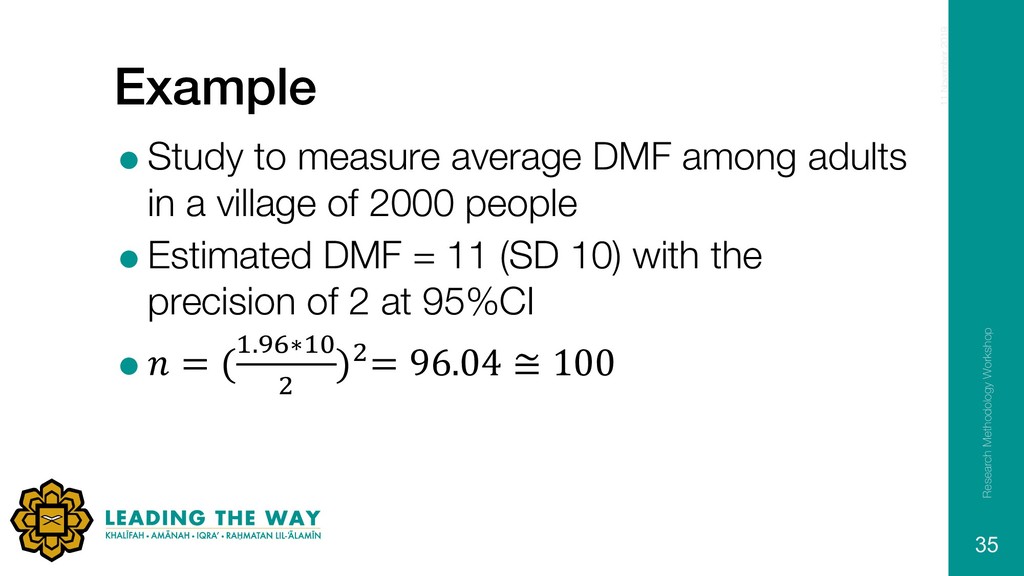
village of 2000 people =Estimated DMF = 11 (SD 10) with the precision of 2 at 95%CI = = ().67∗)9 / )/= 96.04 ≅ 100 11 November 2019 35 Research Methodology Workshop
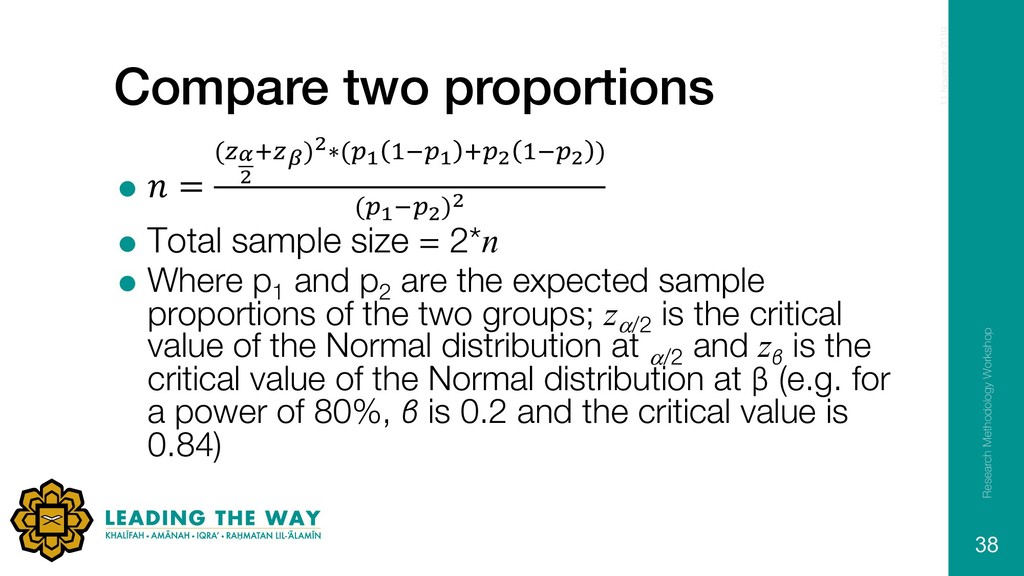
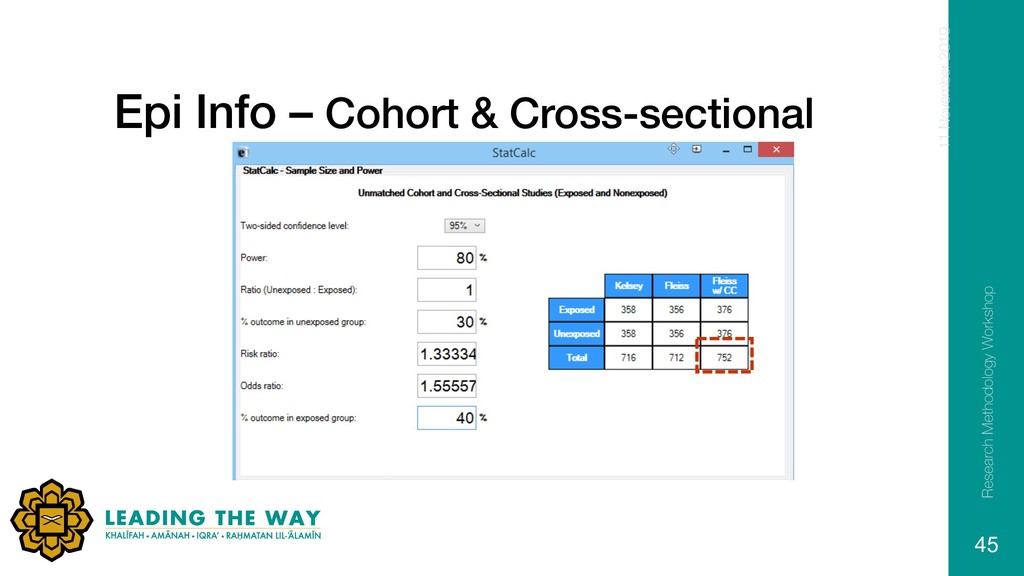
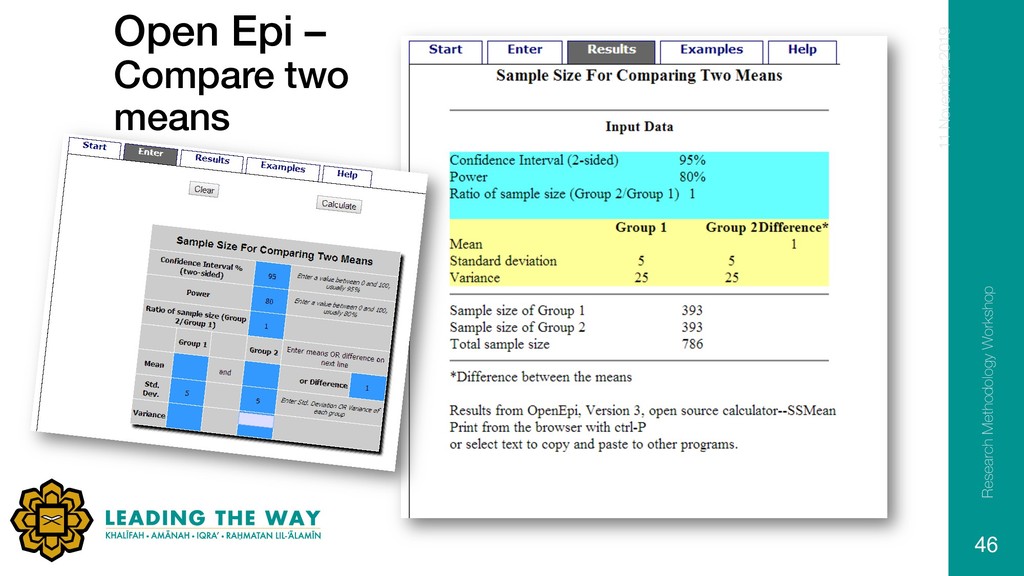
)*'& ) ('G*'&)& = Total sample size = 2*n = Where p1 and p2 are the expected sample proportions of the two groups; za/2 is the critical value of the Normal distribution at a/2 and zβ is the critical value of the Normal distribution at β (e.g. for a power of 80%, β is 0.2 and the critical value is 0.84) 11 November 2019 38 Research Methodology Workshop
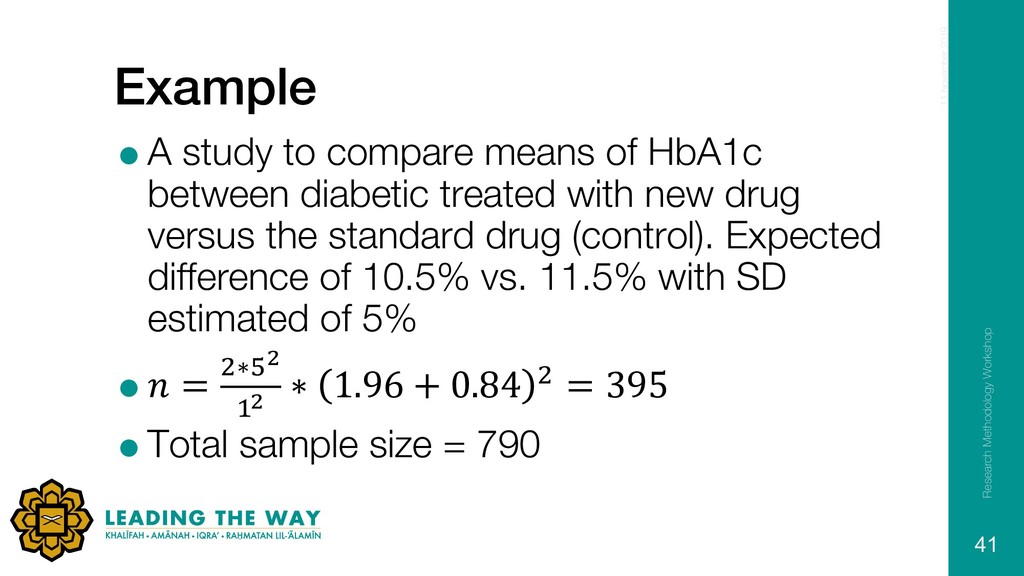
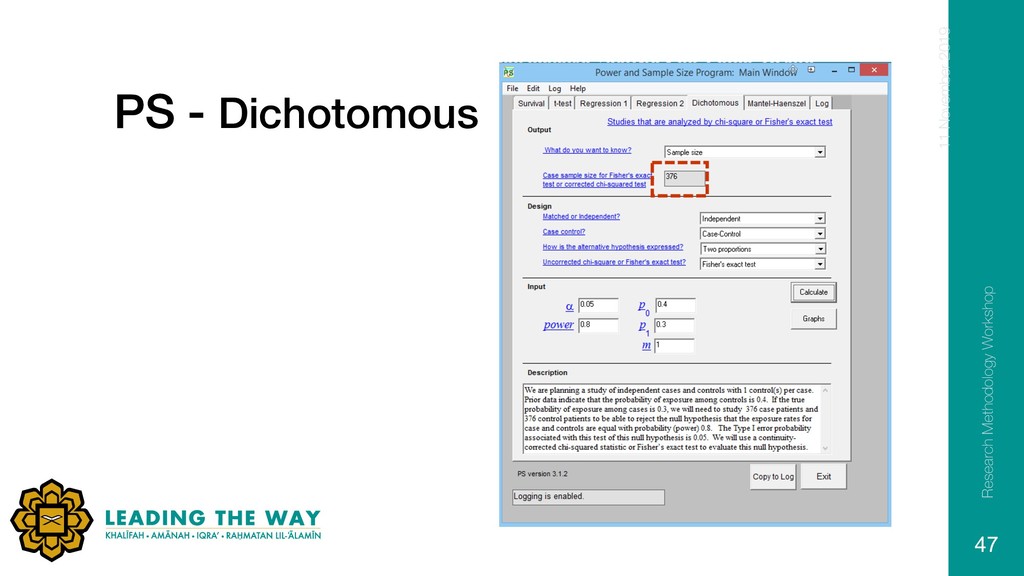
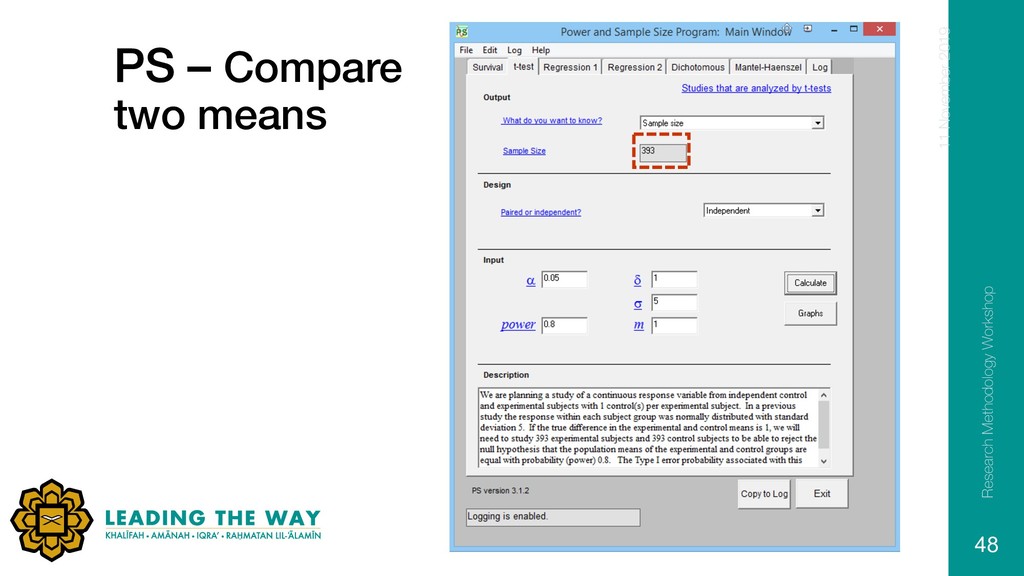
treated with new drug versus the standard drug (control). Expected difference of 10.5% vs. 11.5% with SD estimated of 5% = = /∗;& )& ∗ 1.96 + 0.84 / = 395 =Total sample size = 790 11 November 2019 41 Research Methodology Workshop
study population – random vs. non random =Calculate sample size for a specific purpose =Sample size is an estimate 11 November 2019 Research Methodology Workshop 50