We can take a glimpse at our applications or we can truly see them. We have a choice.
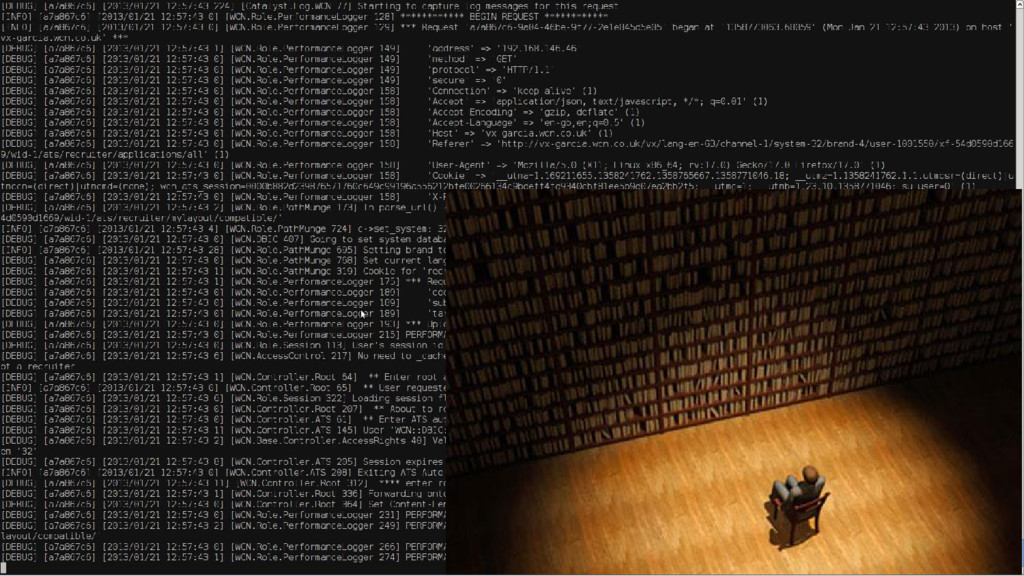
Our path is laden with problems and, when they arise, the first place to run is the log. The log is straightforward when the systems are small, but when we start to scale… the more users we get, the more data we will have to go through, and finding what we need is like staring at a well-stocked library, looking at the book titles, wondering which one could possibly have the information we need.
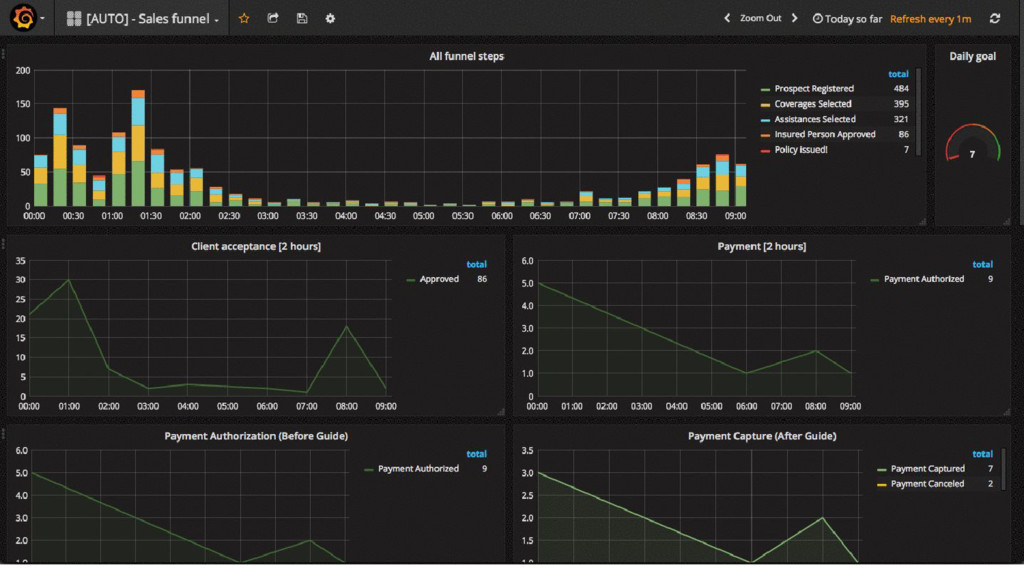
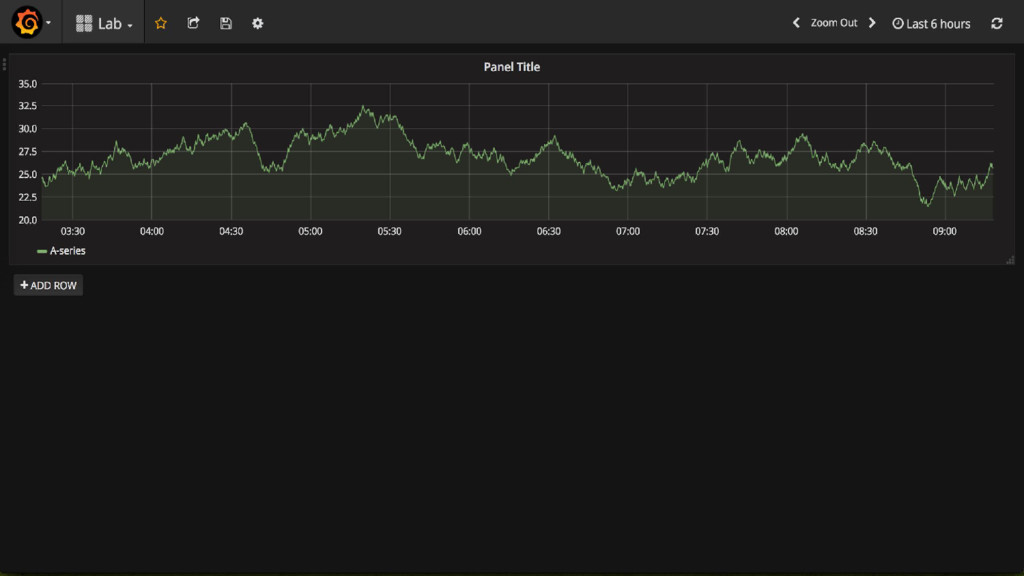
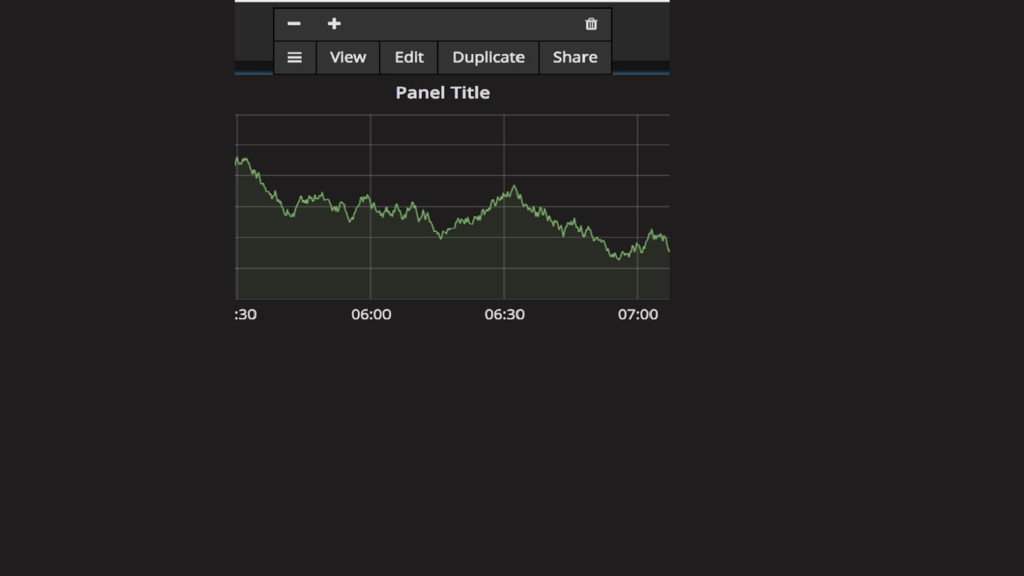
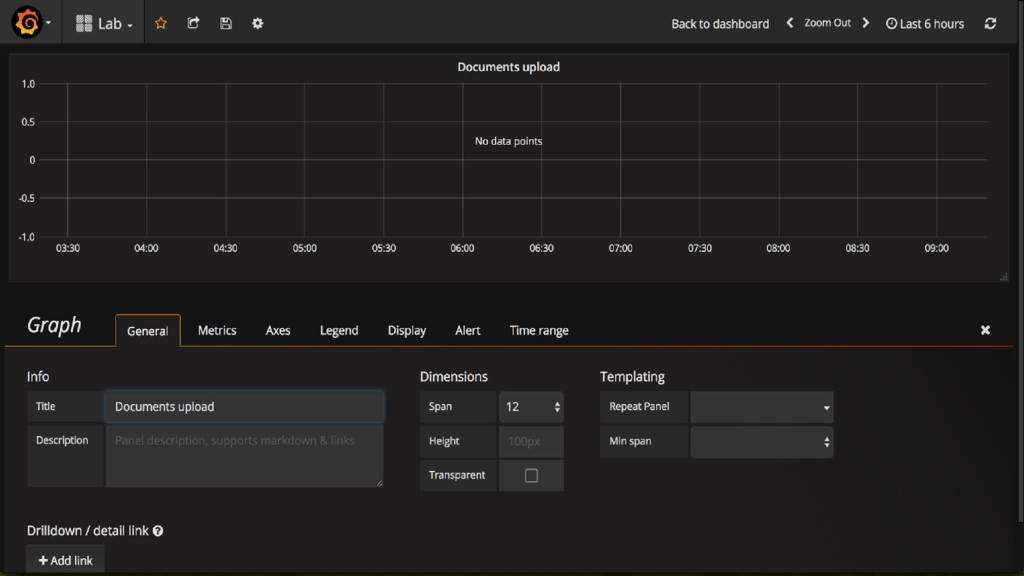
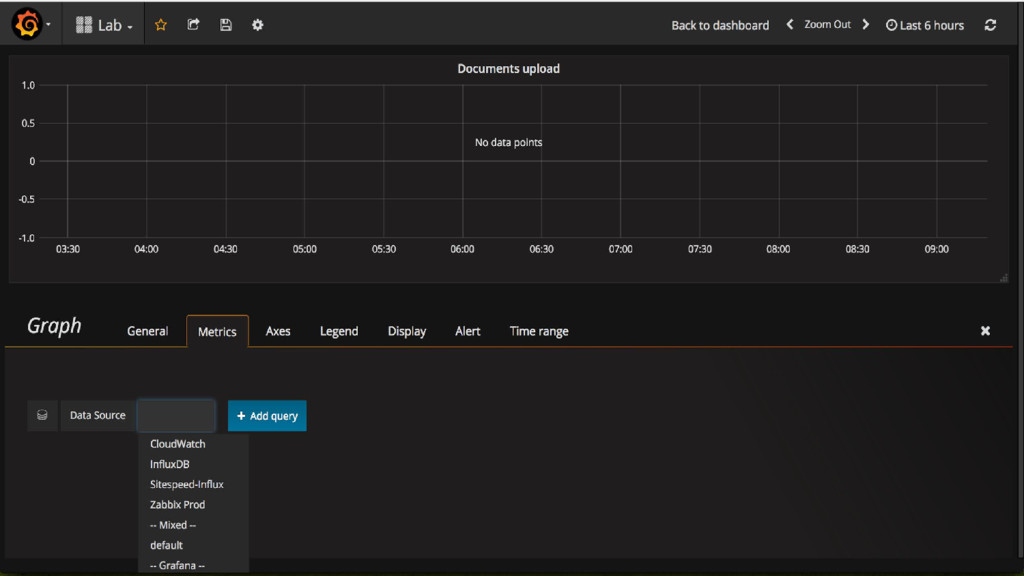
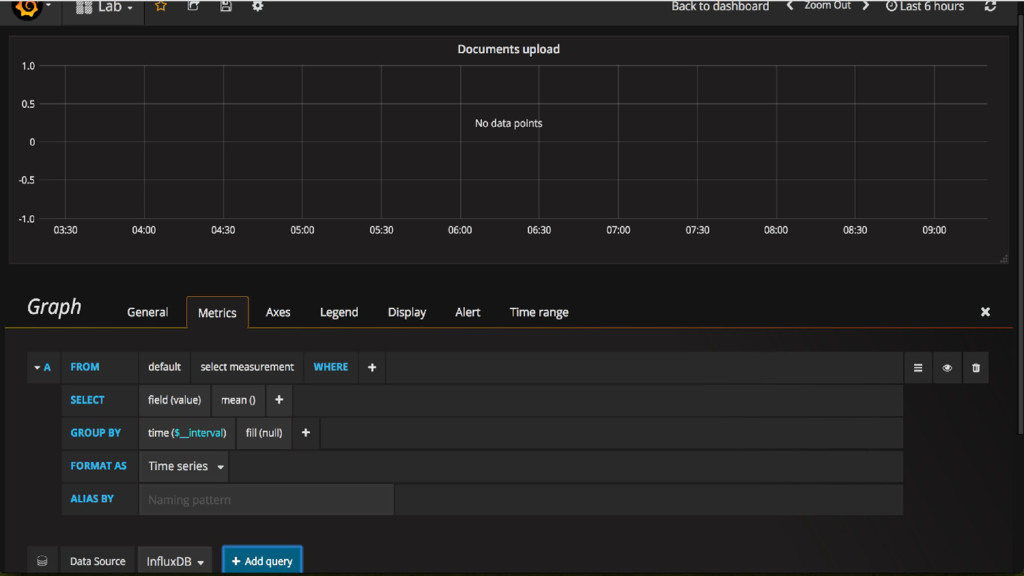
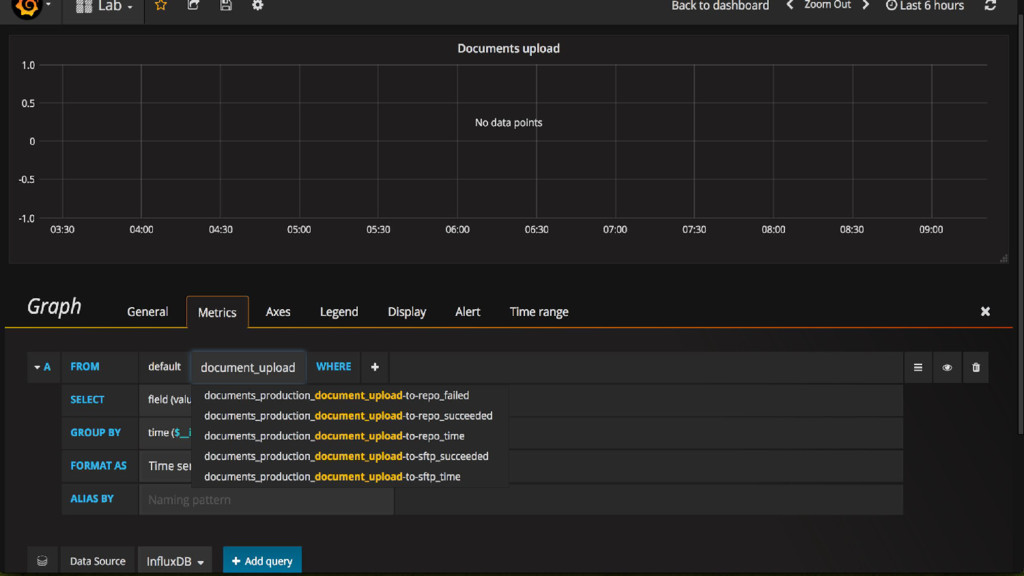
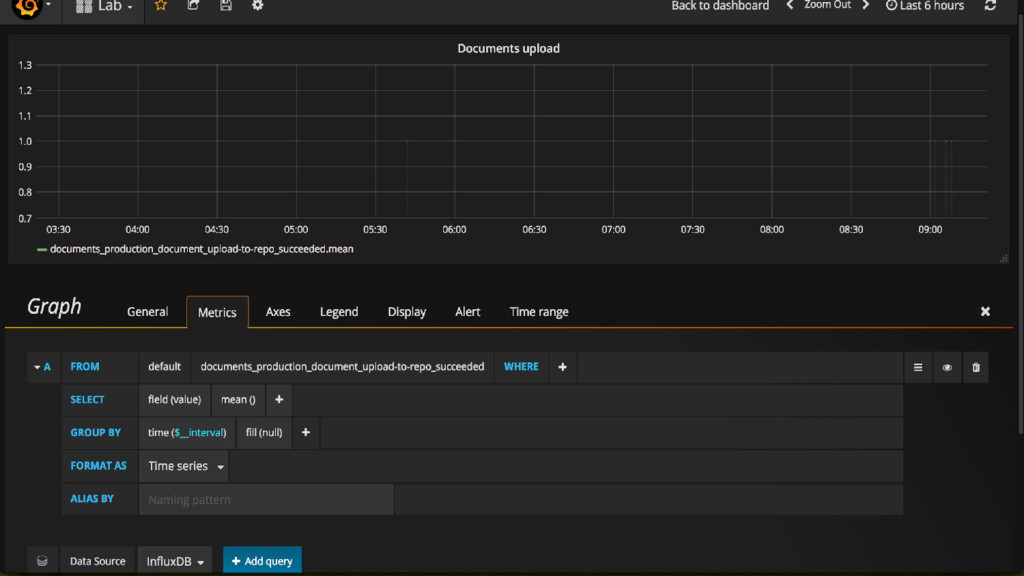
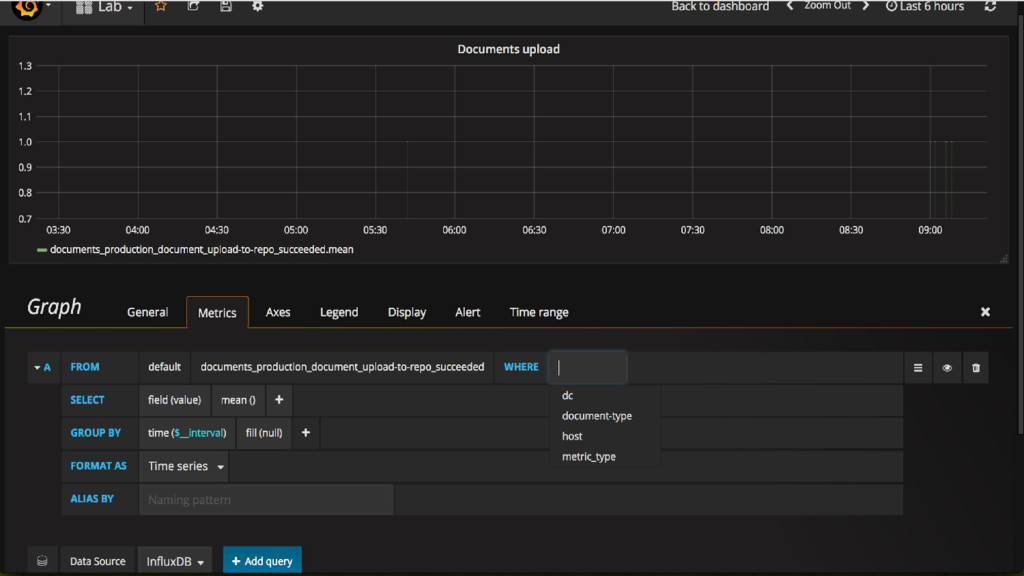
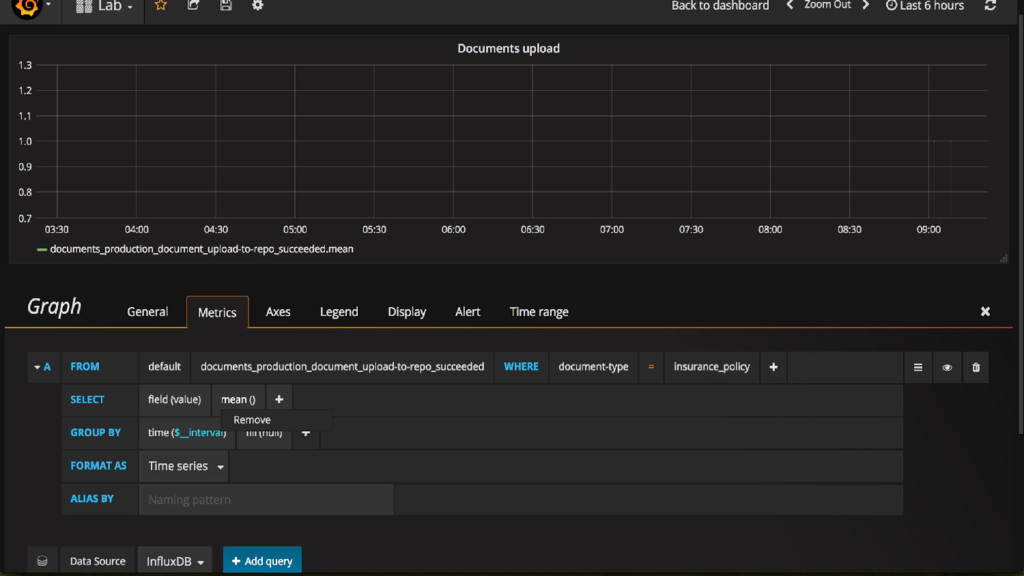
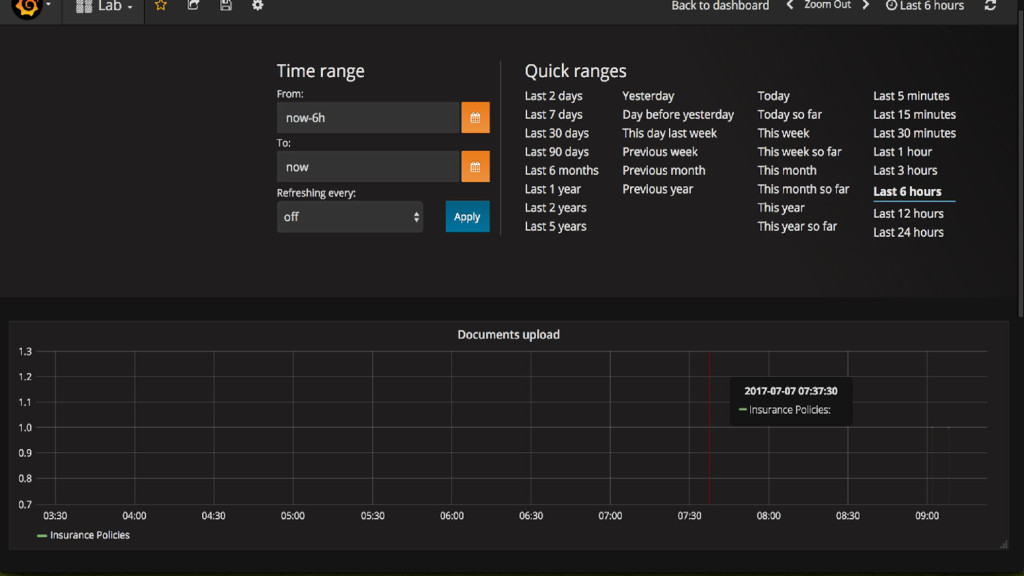
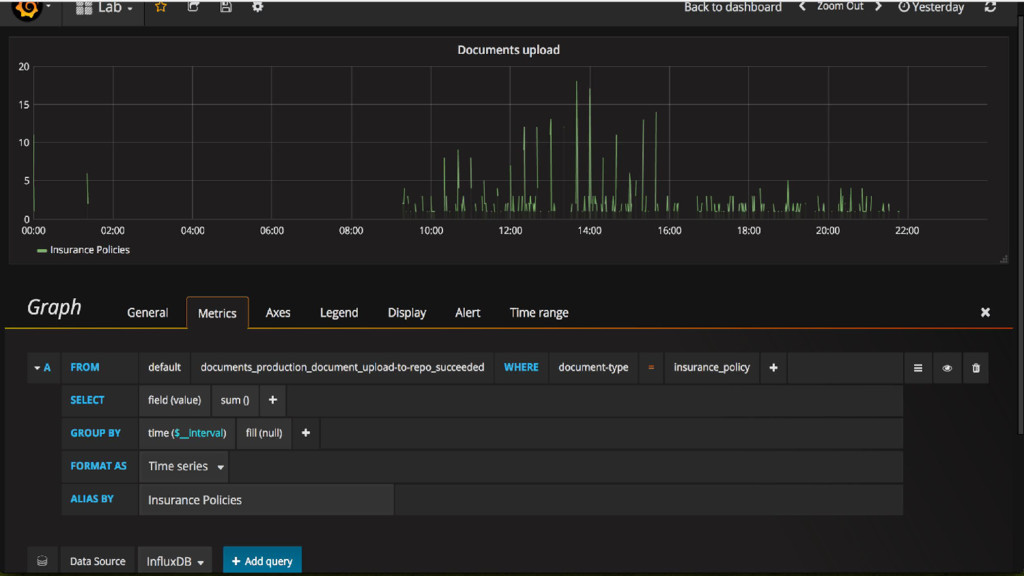
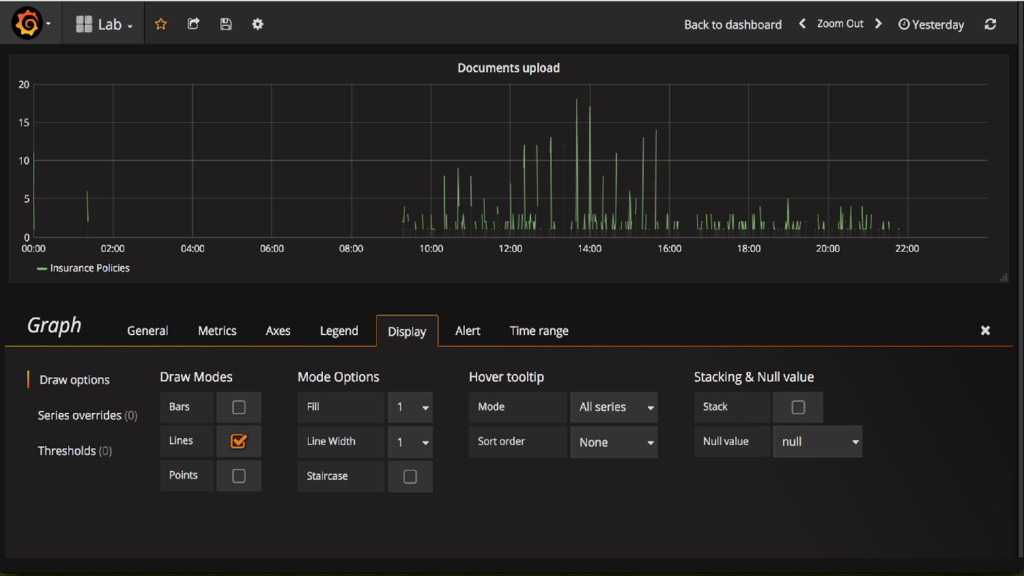
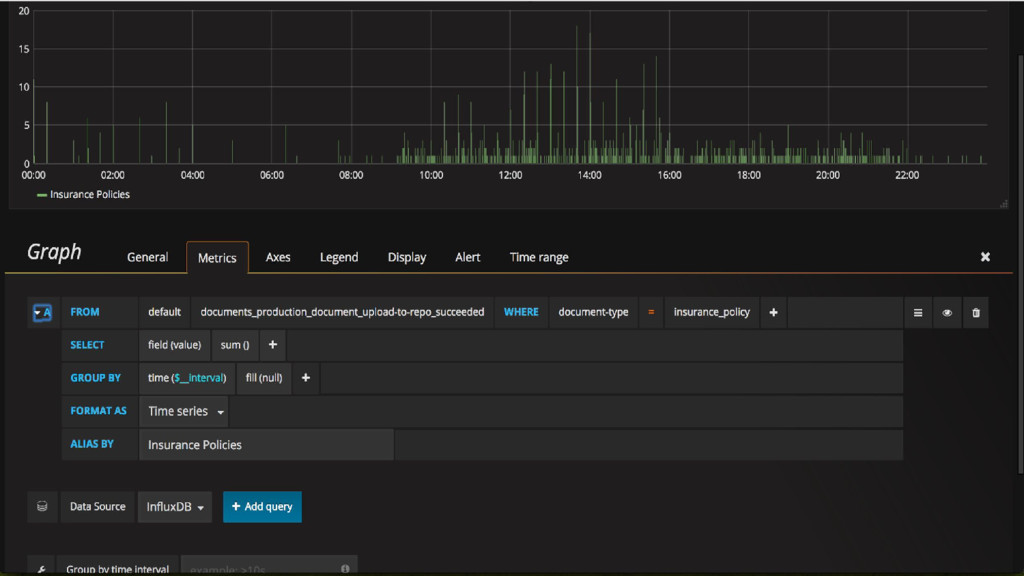
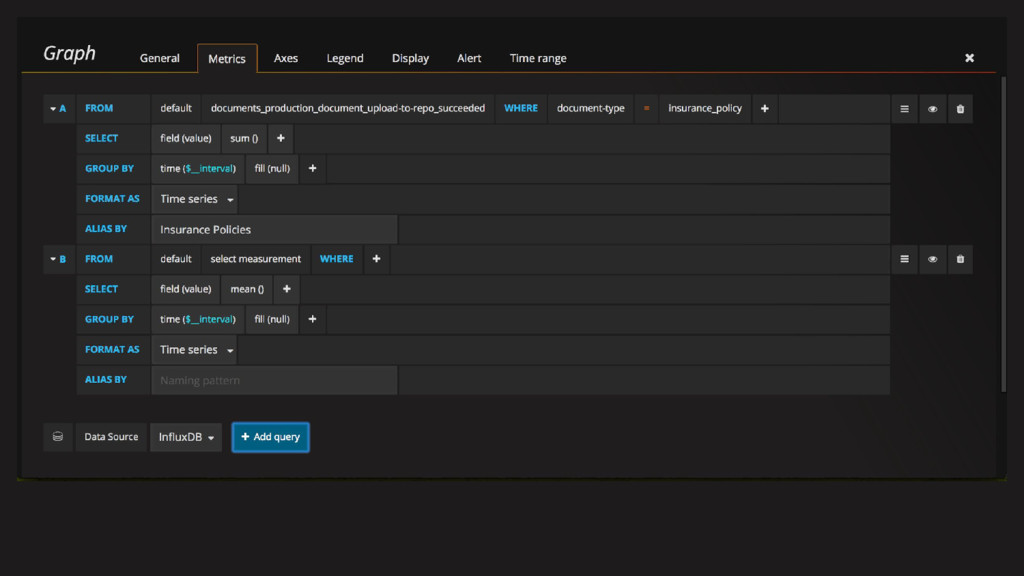
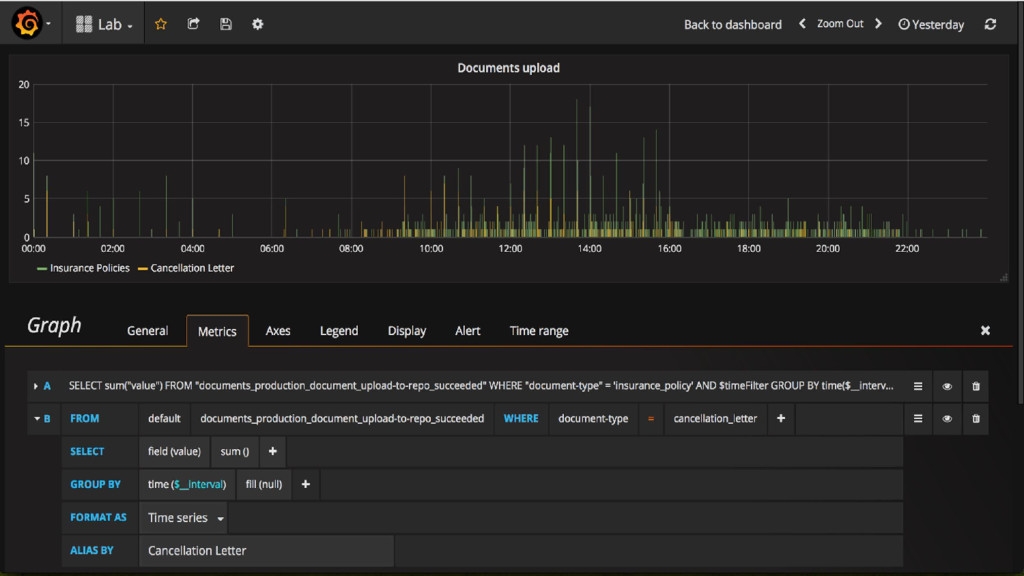
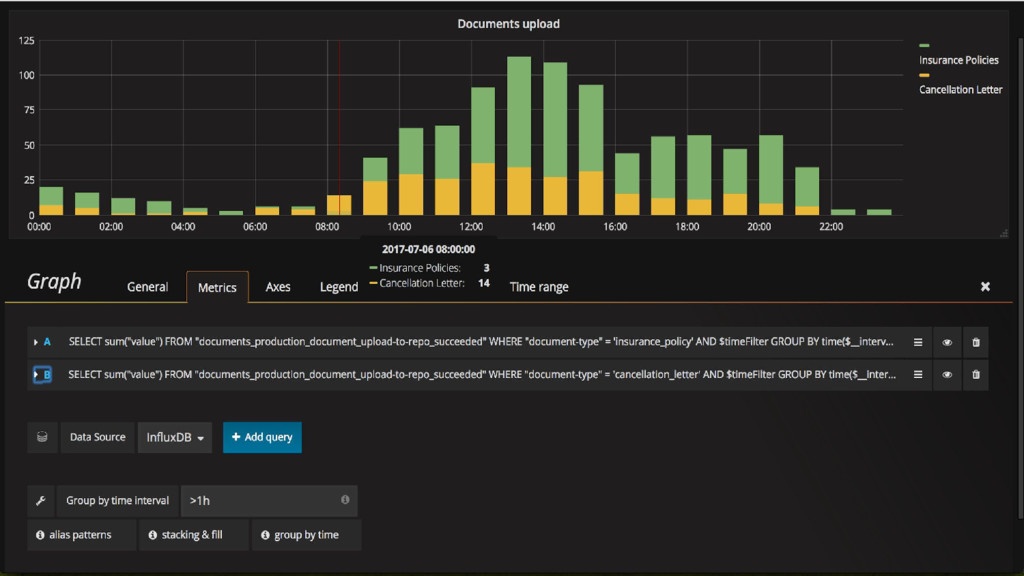
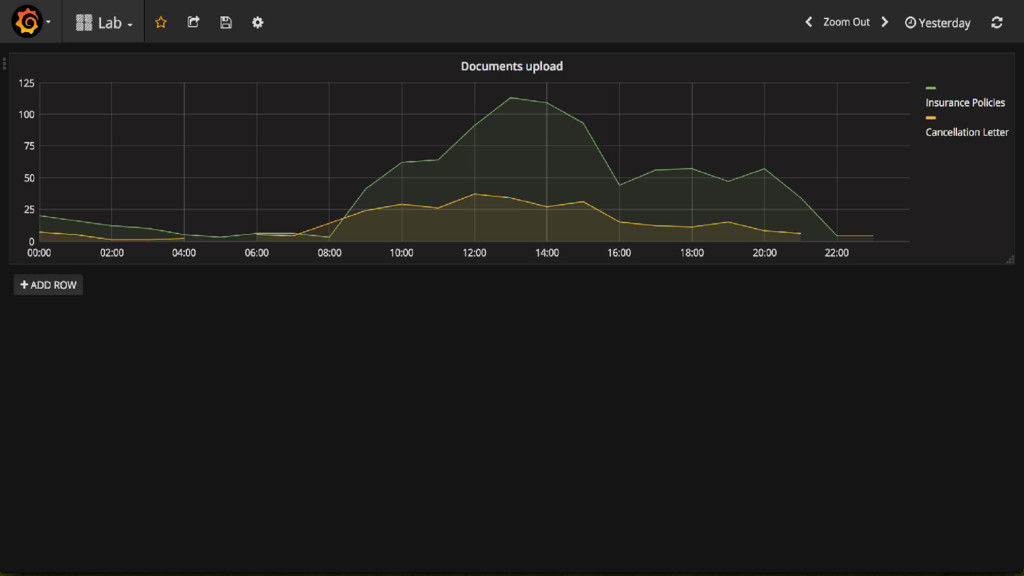
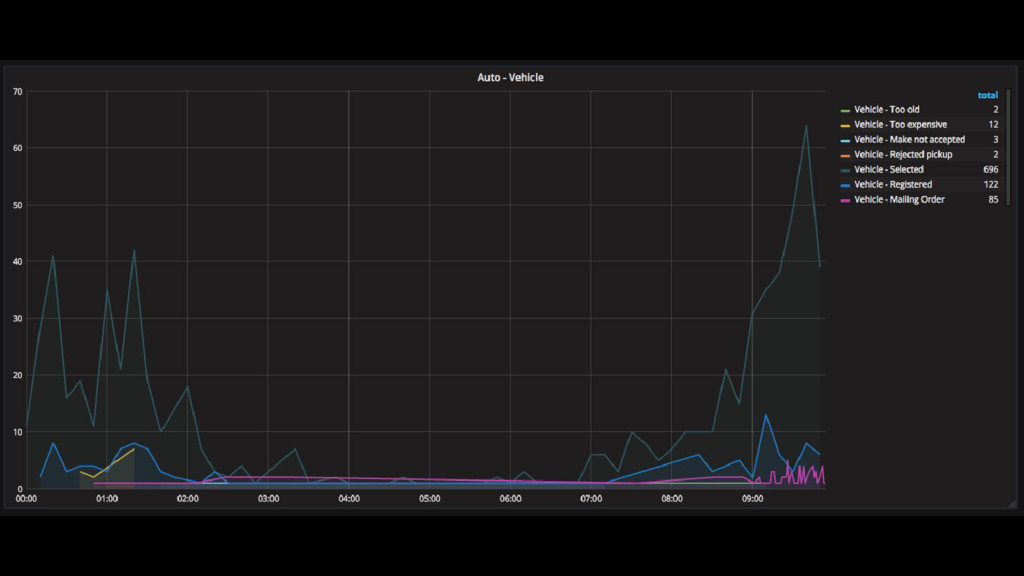
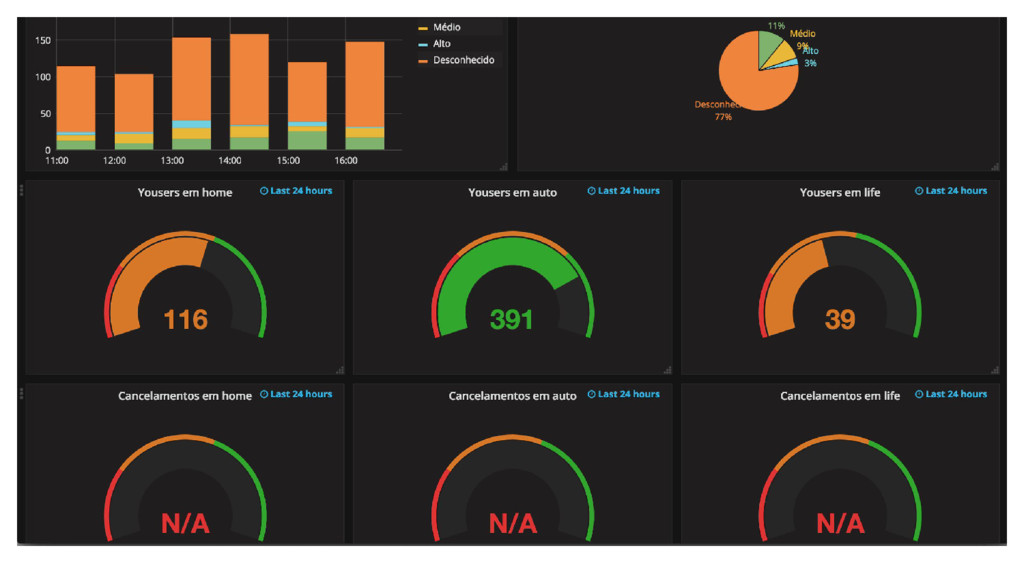
I’d like to suggest an alternative: the combination of StatsD, a platform that collects data to build statistics, and Grafana. It allows us to create beautiful, interactive dashboards that support pluggable panels.
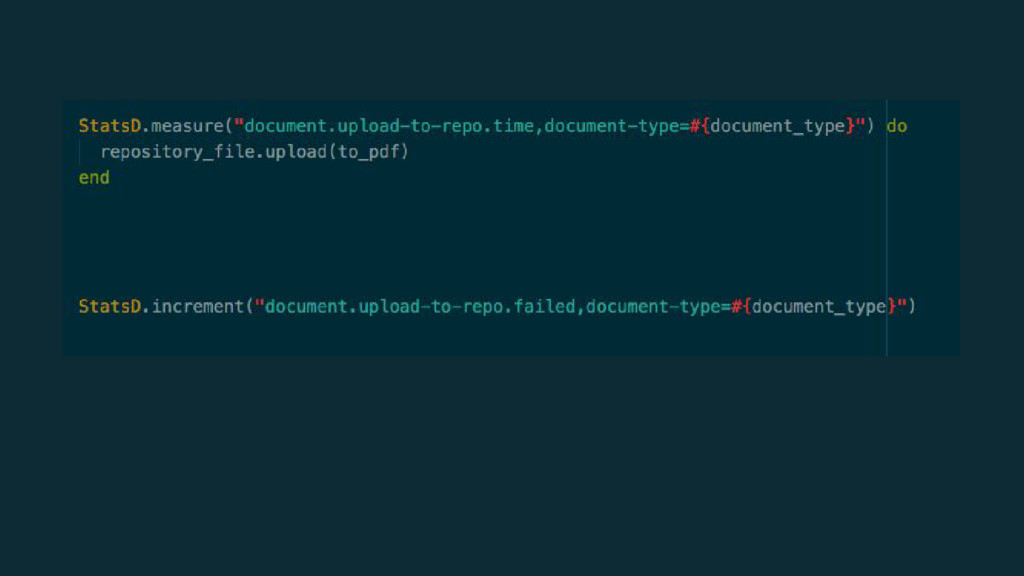
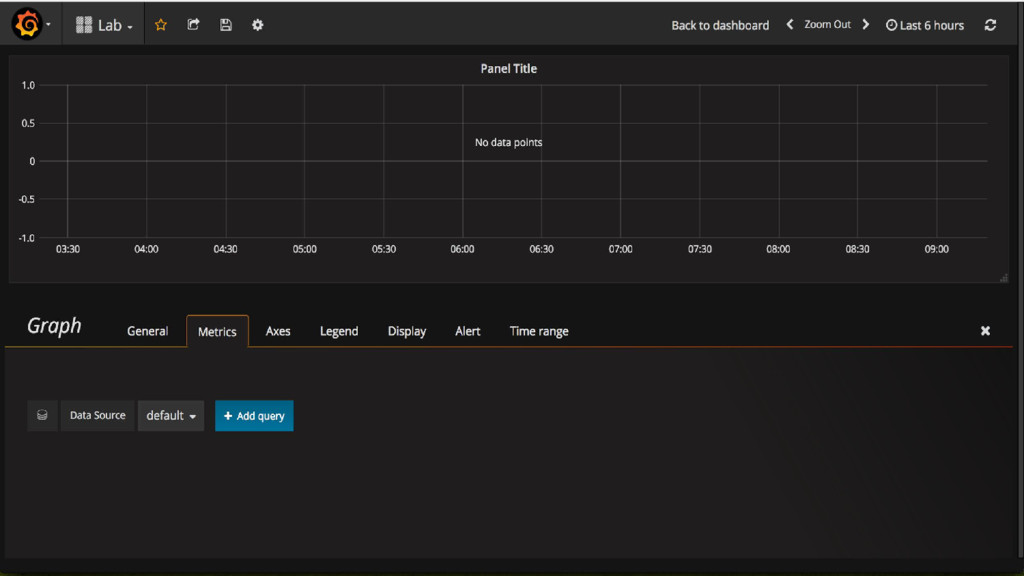
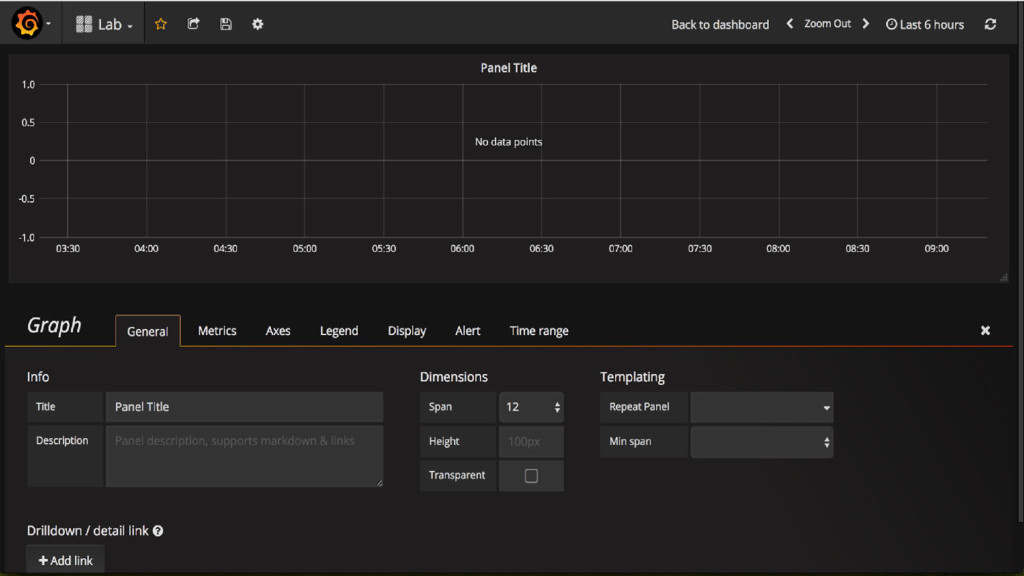
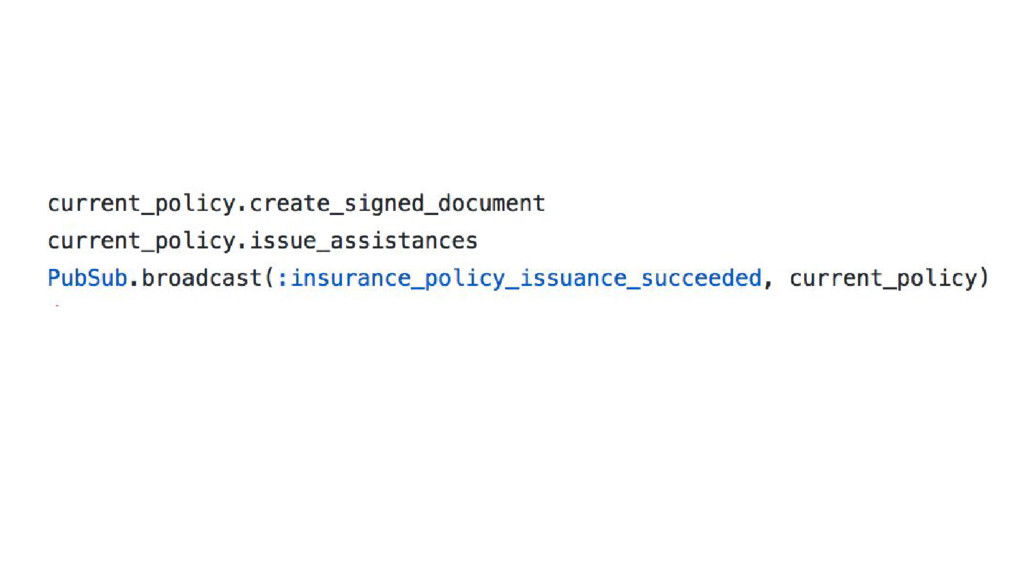
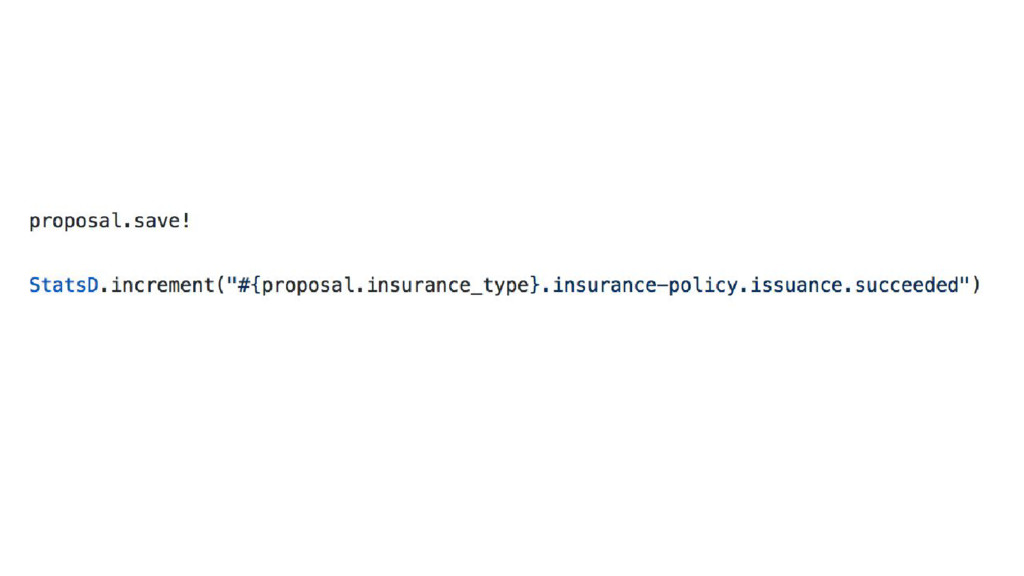
This talk is not only focused on the theory behind these tools but also in the experience we had with them at Youse. I will present the tools (and the alternative tools too), explain how to use them and show the code we need to measure the events we want to track. A chart will be build from scratch, starting with an event on the system and ending in a beautiful dashboard.
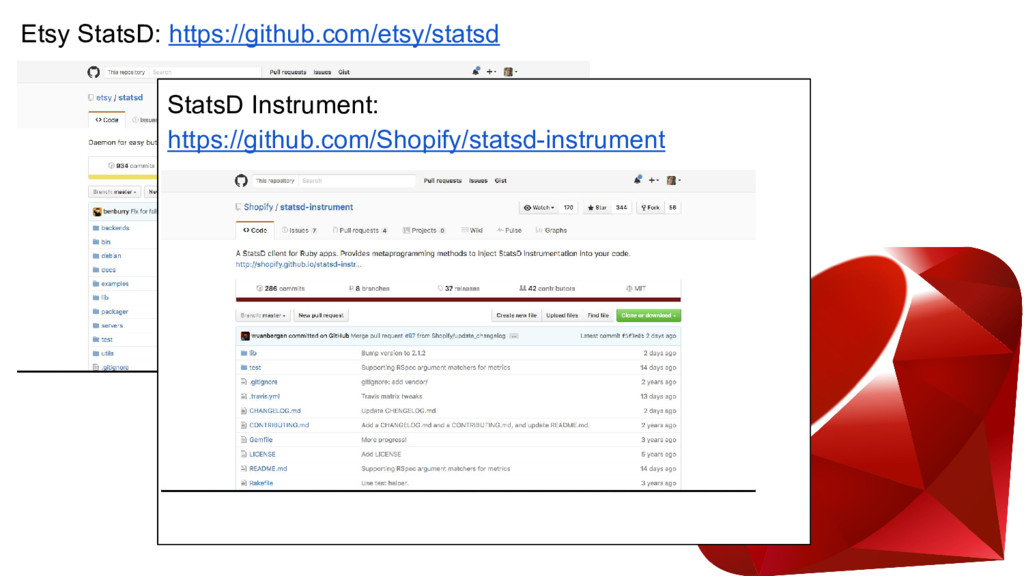
All the code is in Ruby. We use Ruby on Rails on our applications and we found good open source libraries to build and maintain the monitoring system.
![Artur Caliendo Prado http://arturprado.com/ [email protected] @artur.prado @artur_caliendo @arturcp](https://files.speakerdeck.com/presentations/c09b884b3cec4a9d9f3b4b72dadb256f/slide_4.jpg)
![http://arturprado.com/ [email protected] @artur.prado](https://files.speakerdeck.com/presentations/c09b884b3cec4a9d9f3b4b72dadb256f/slide_63.jpg)