We can take a glimpse at our applications or we can truly see them. We have a choice.
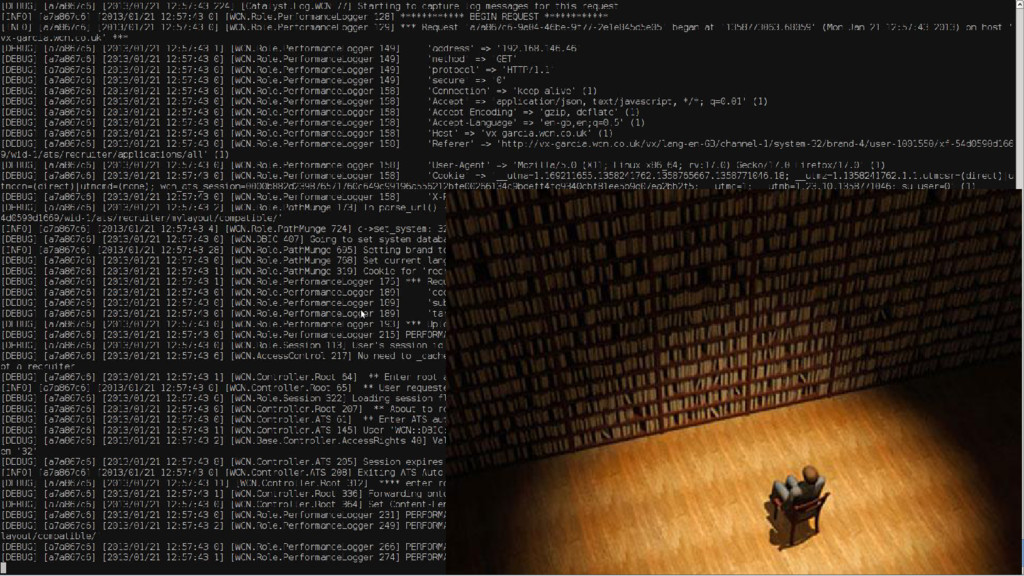
Our path is laden with problems and, when they arise, the first place to run is the log. The log is straightforward when the systems are small, but when we start to scale… the more users we get, the more data we will have to go through, and finding what we need is like staring at a well-stocked library, looking at the book titles, wondering which one could possibly have the information we need.
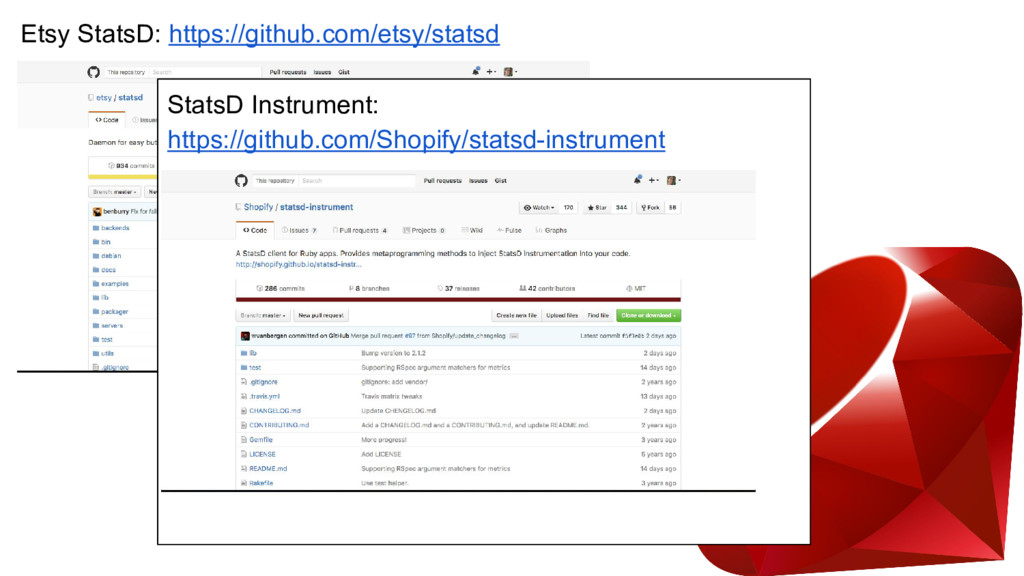
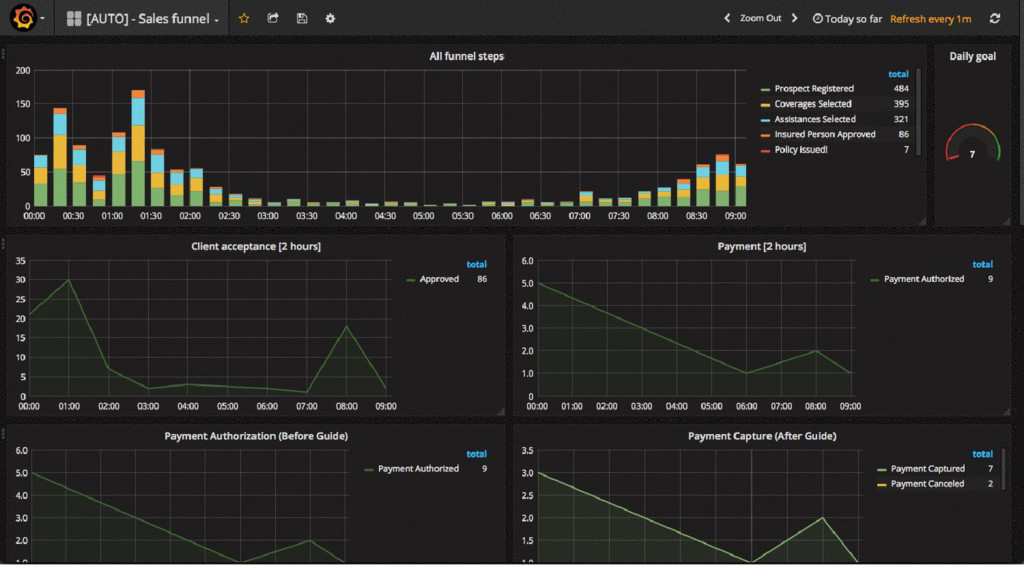
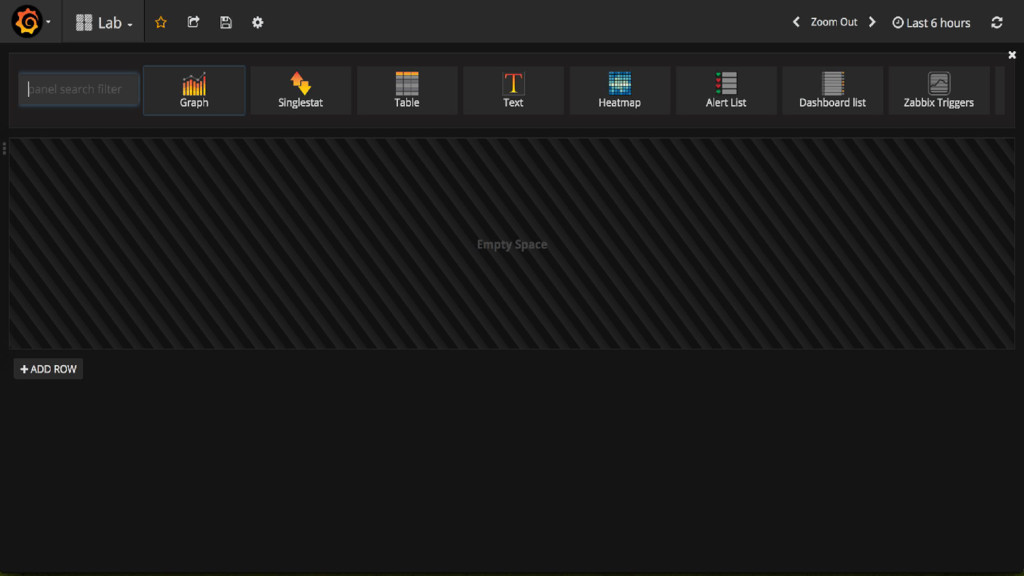
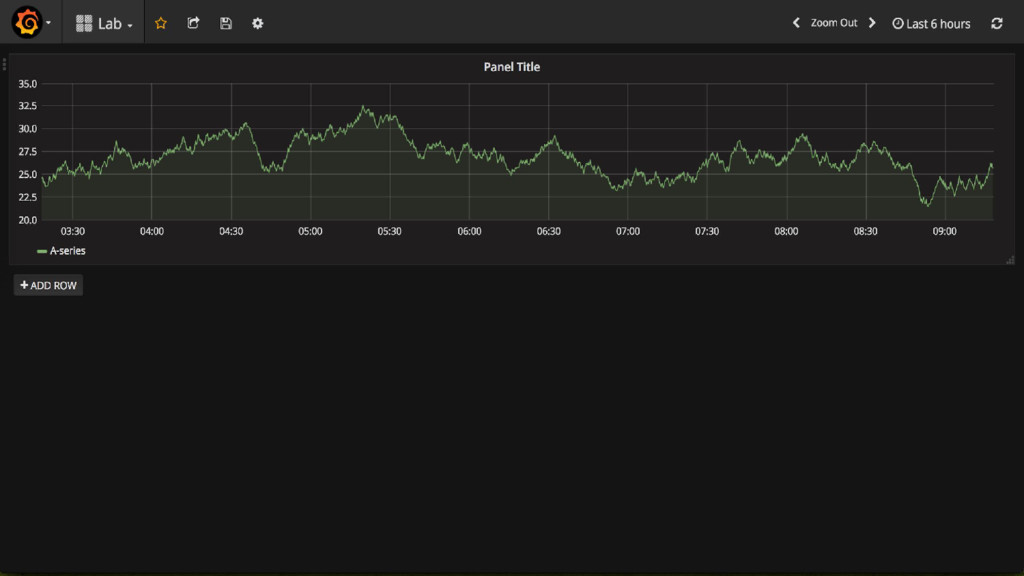
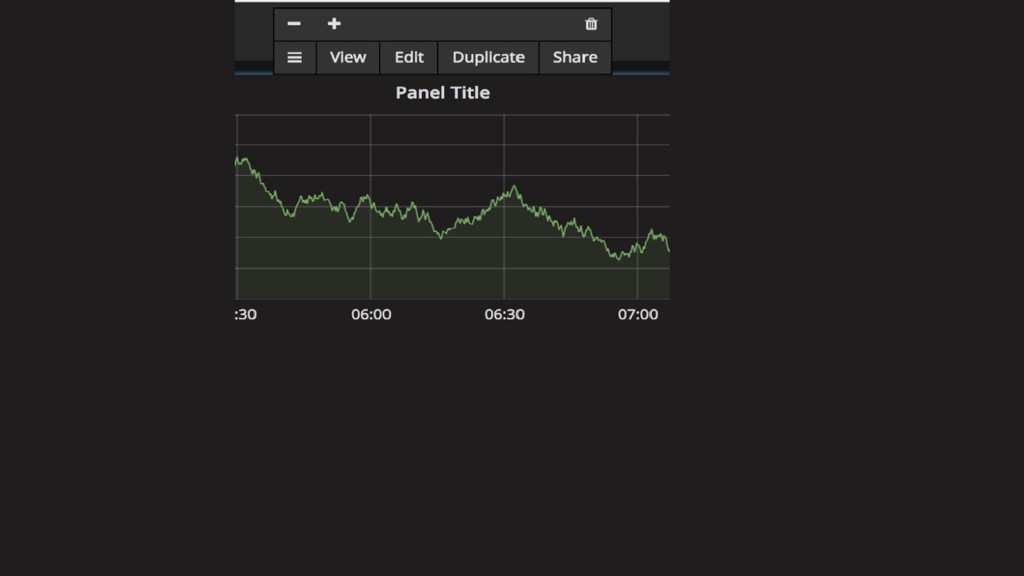
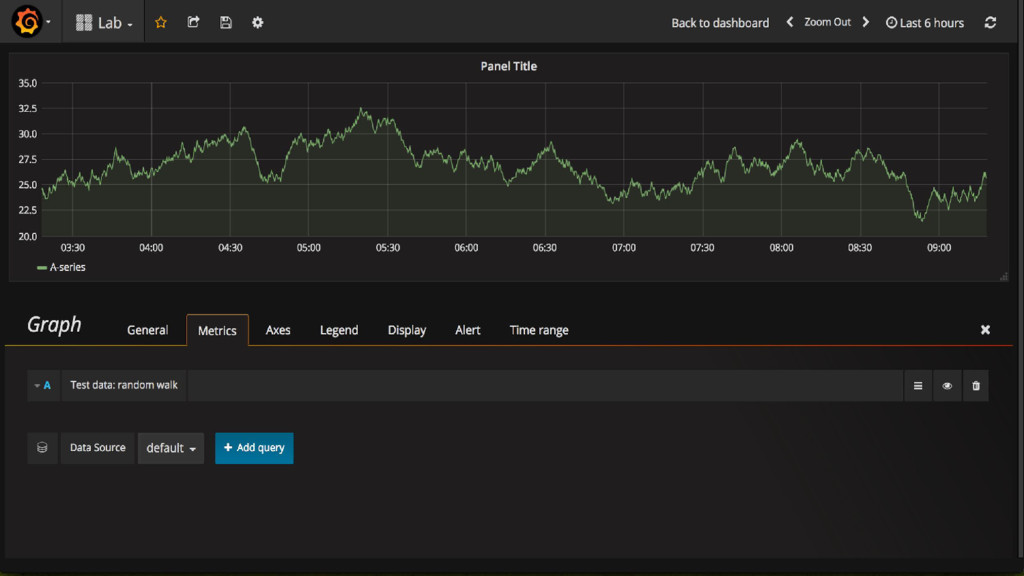
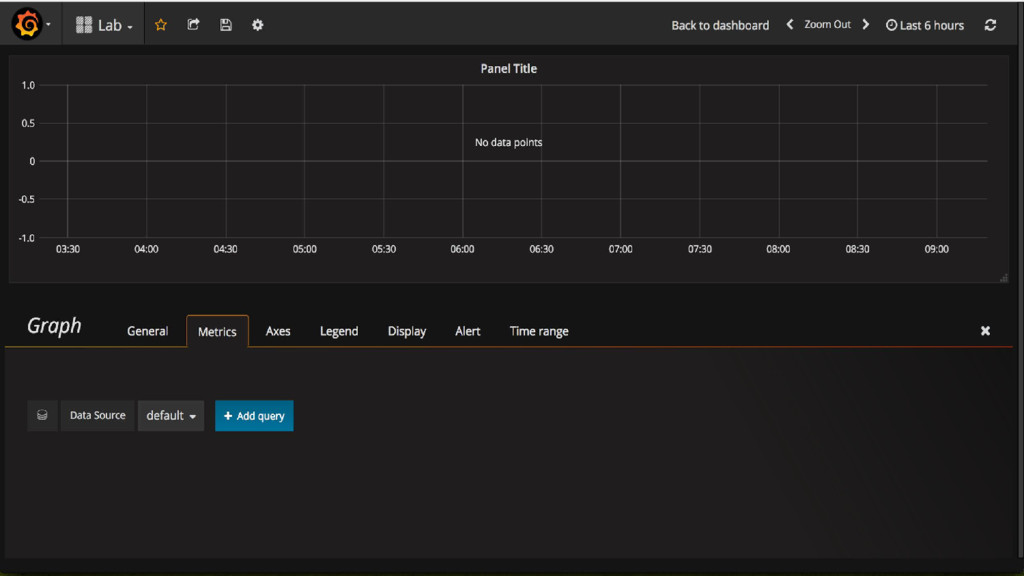
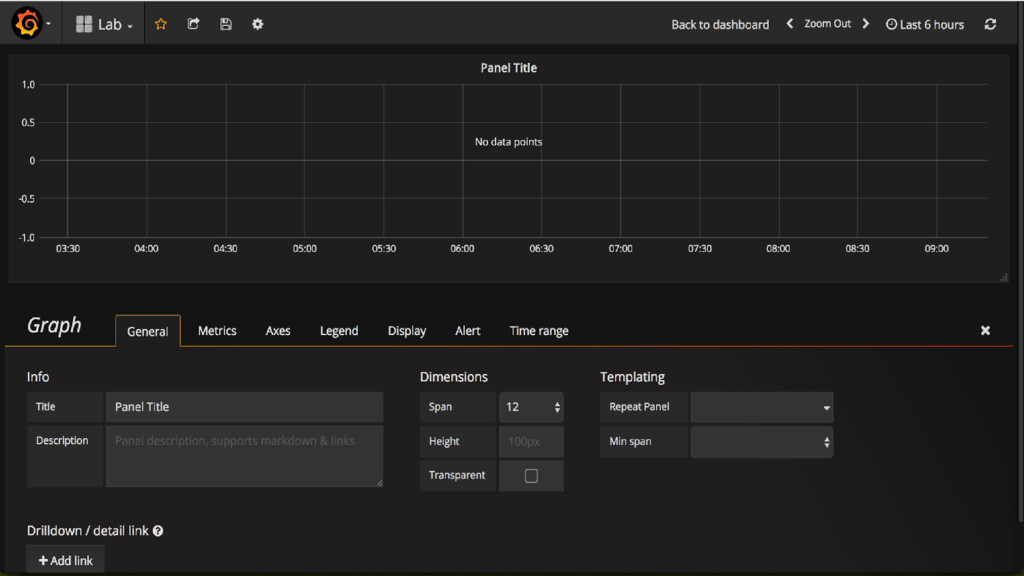
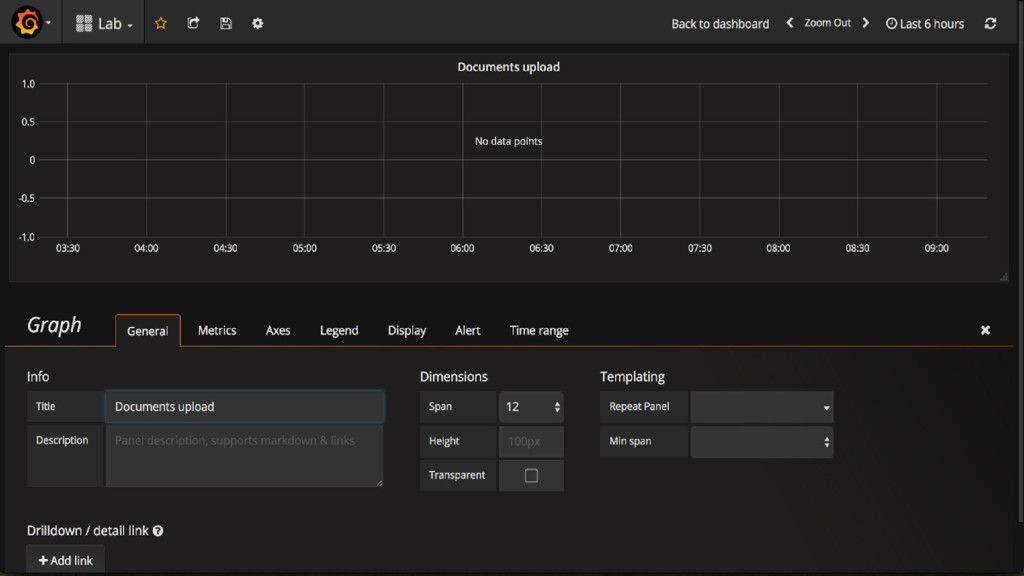
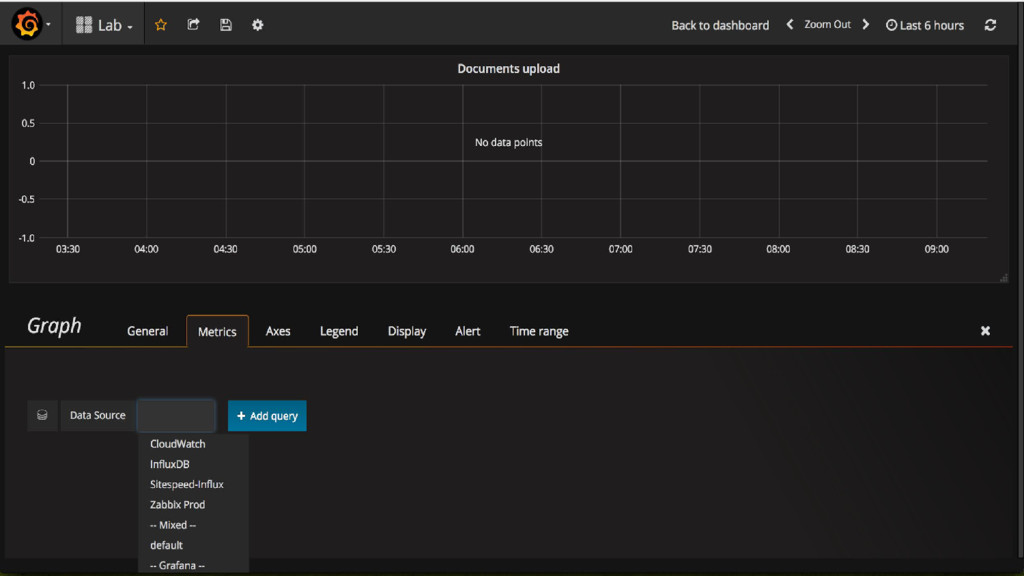
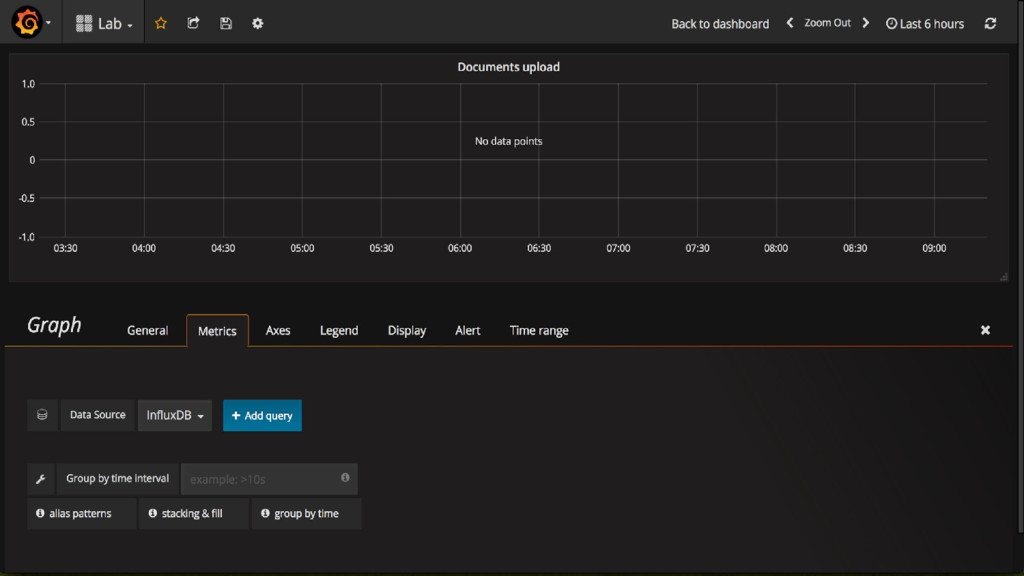
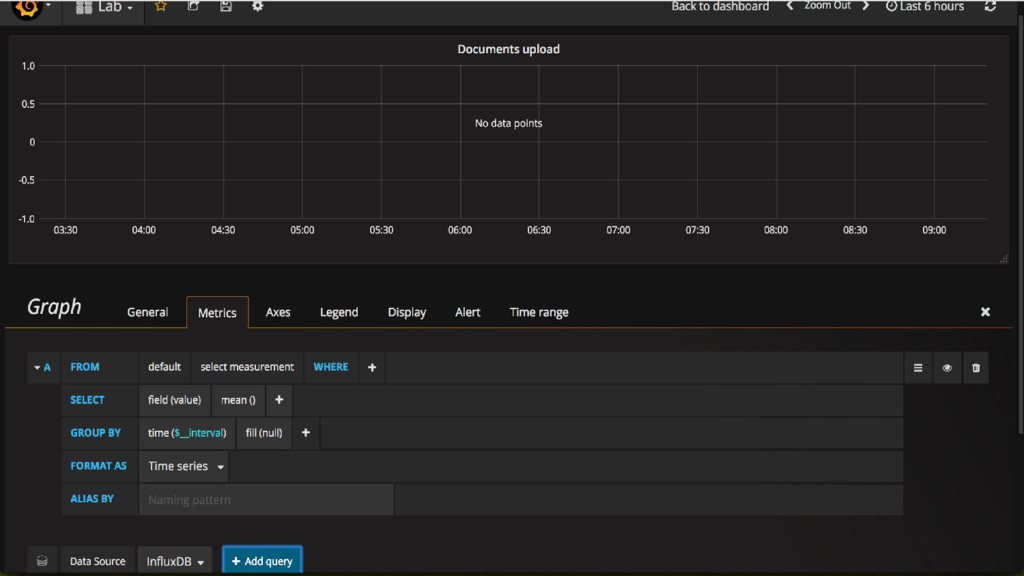
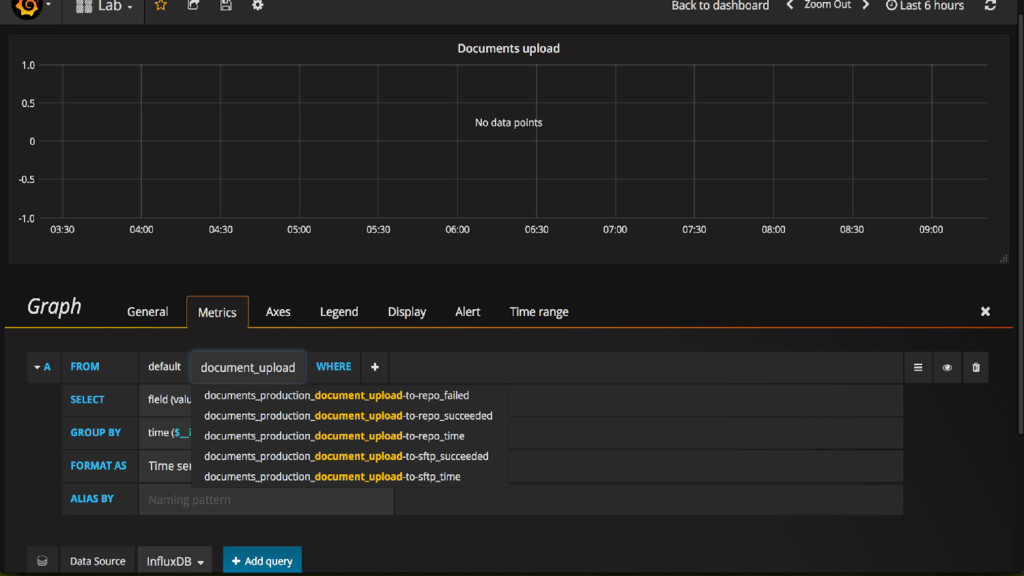
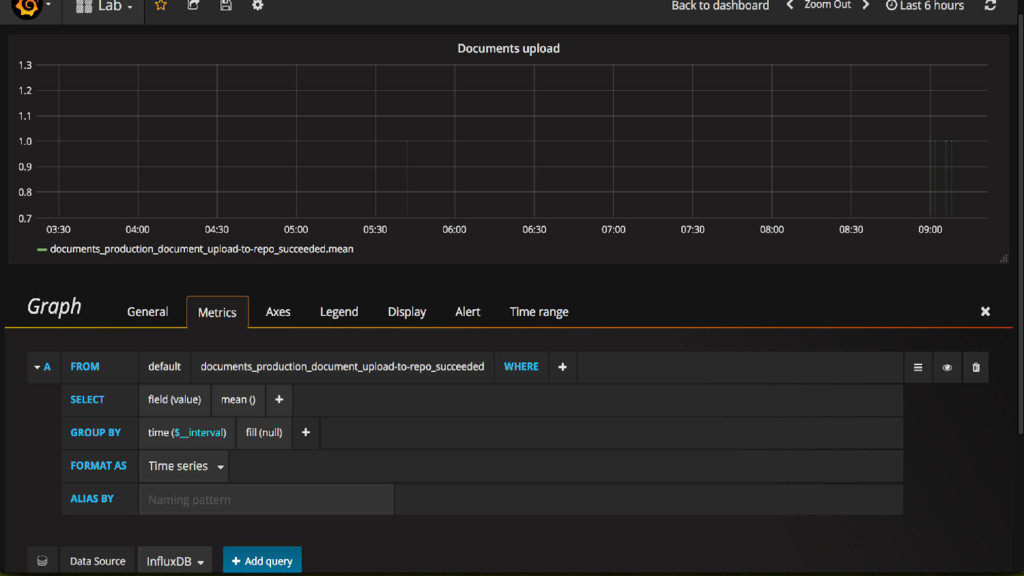
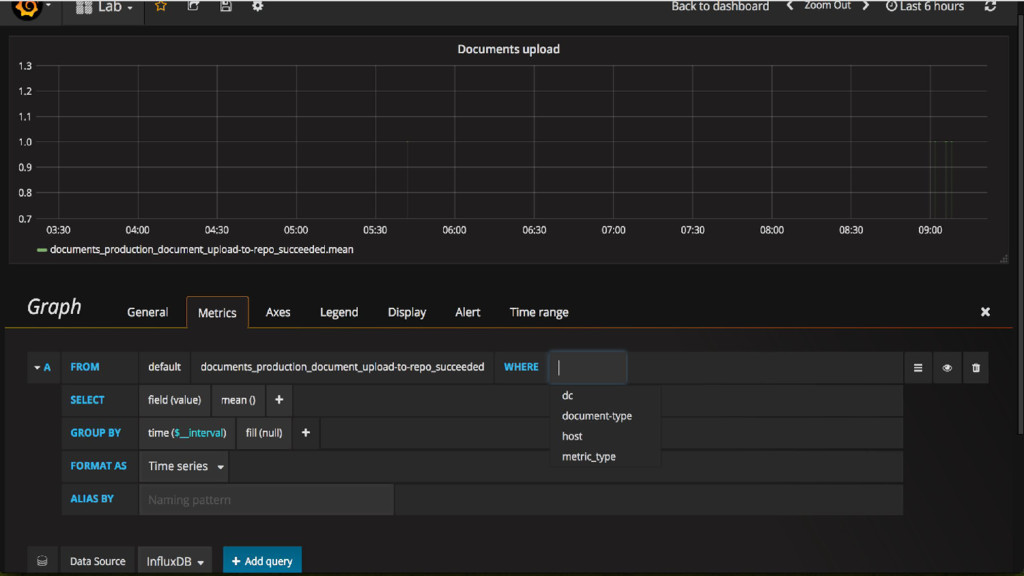
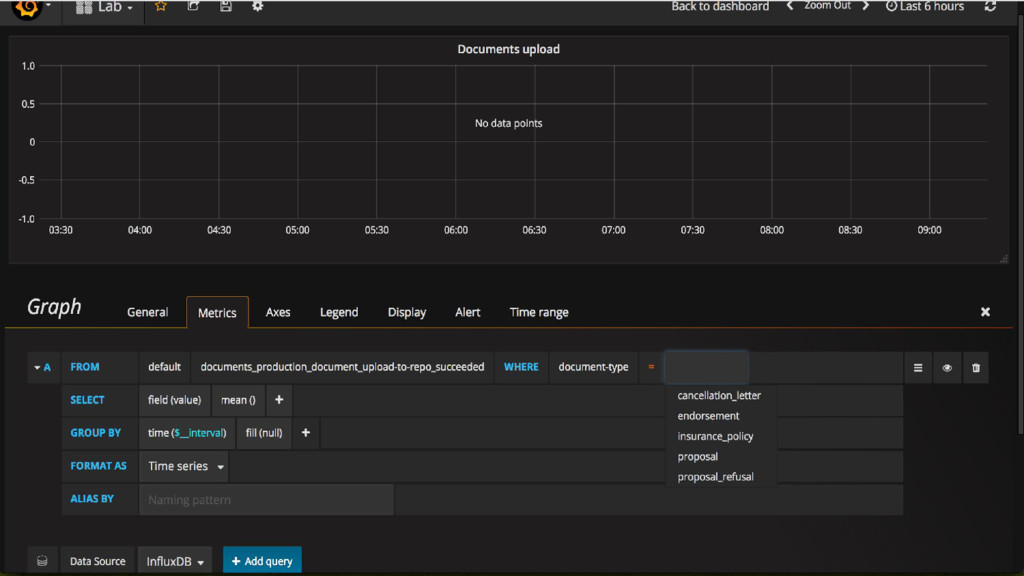
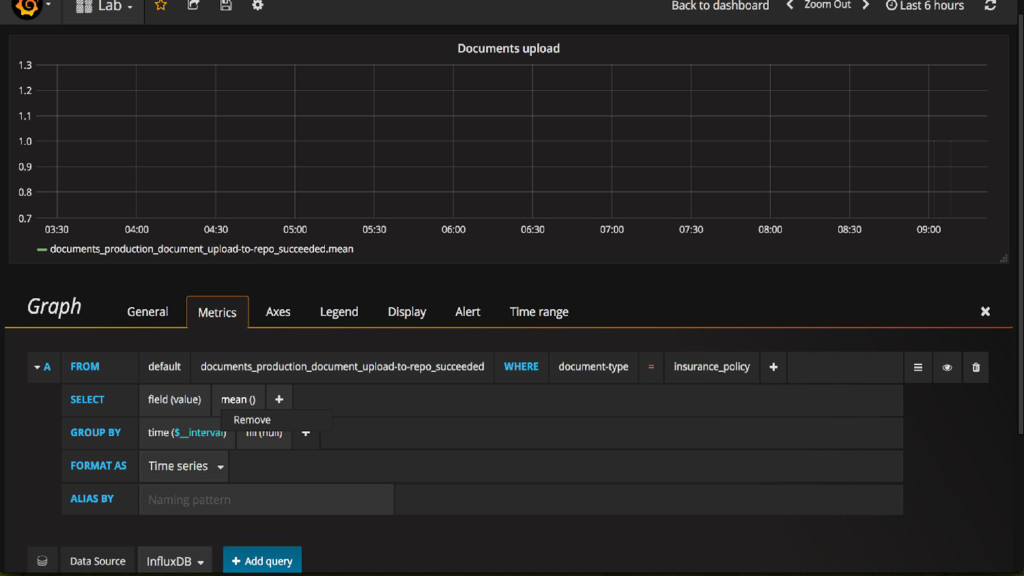
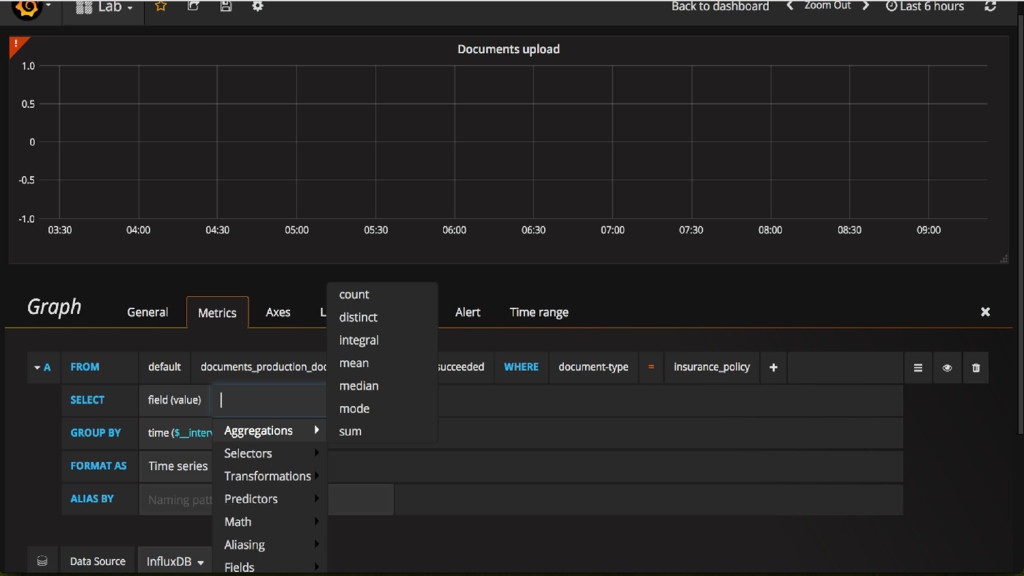
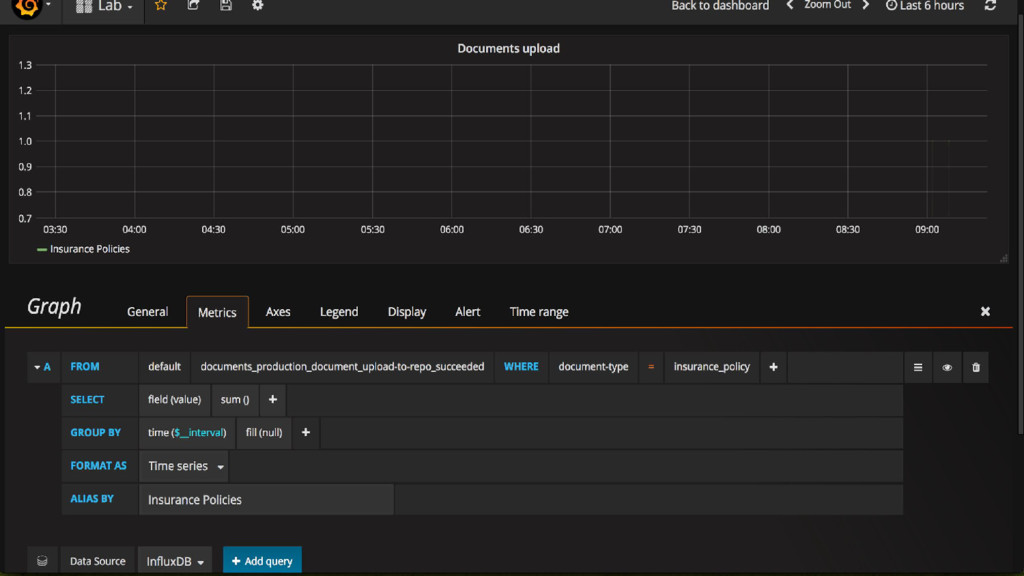
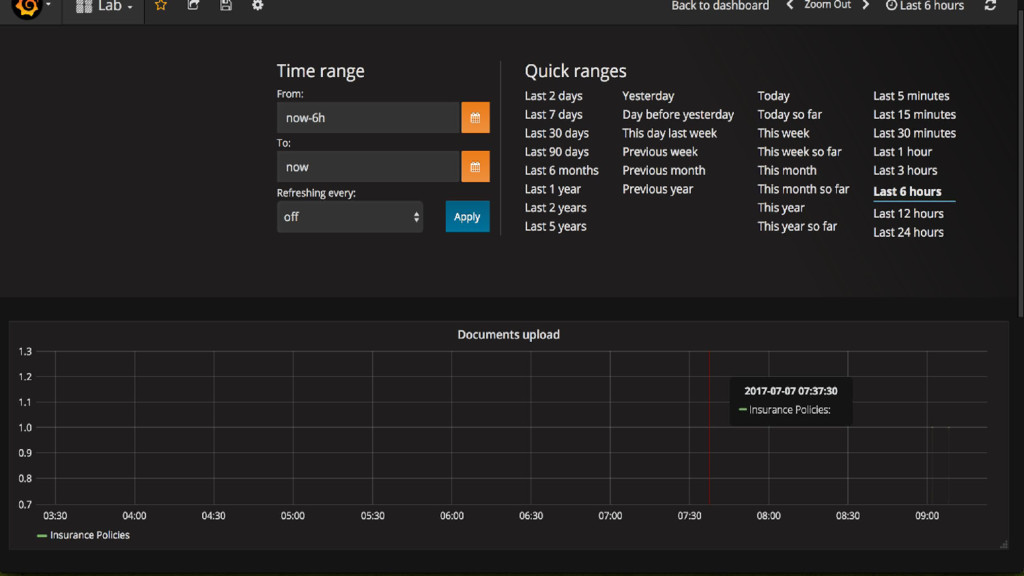
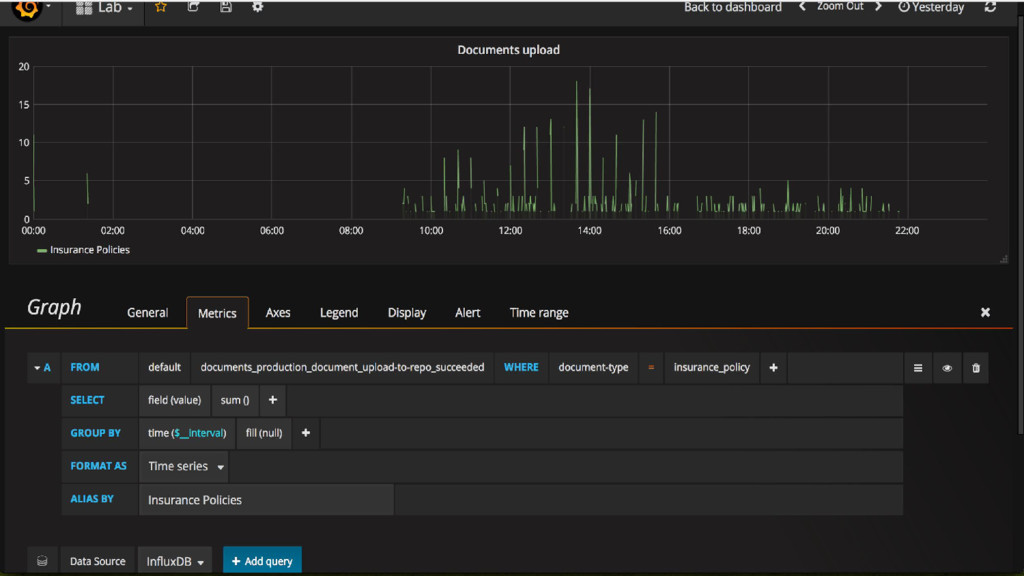
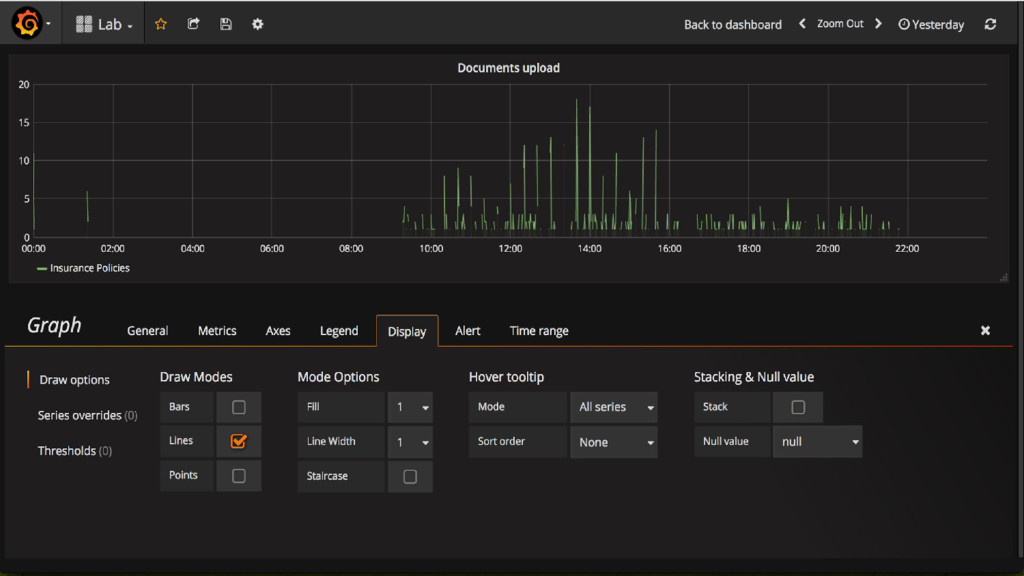
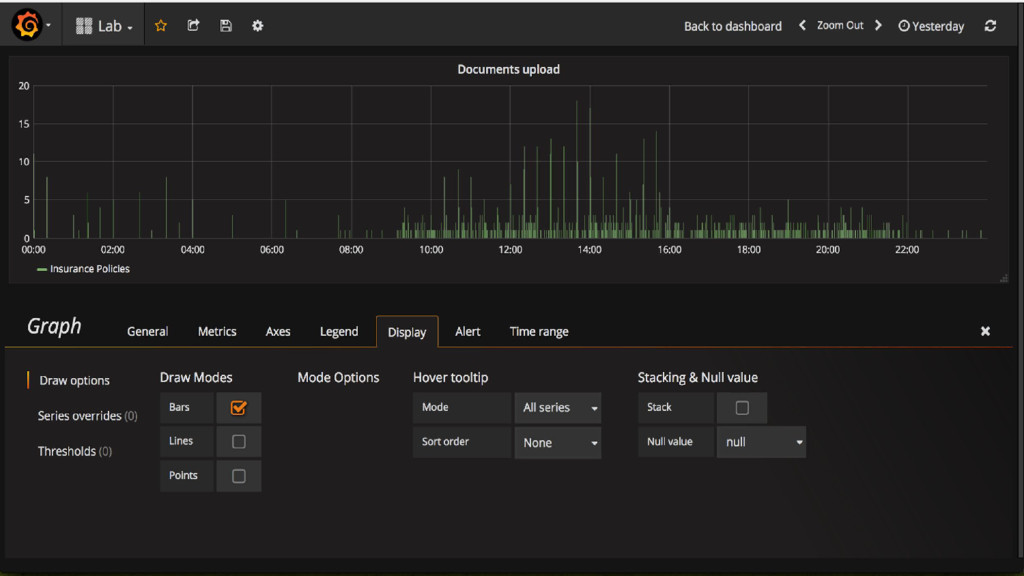
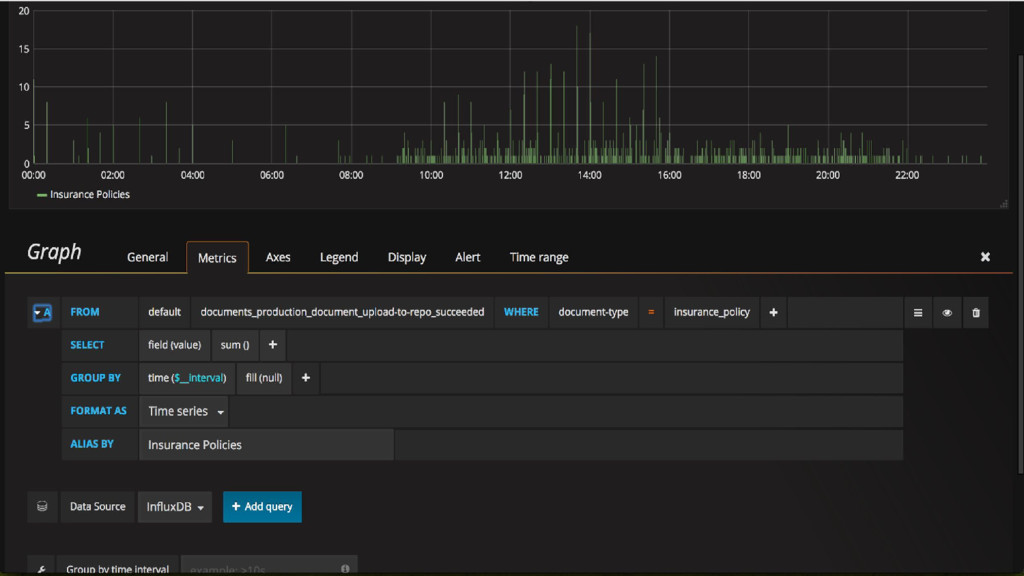
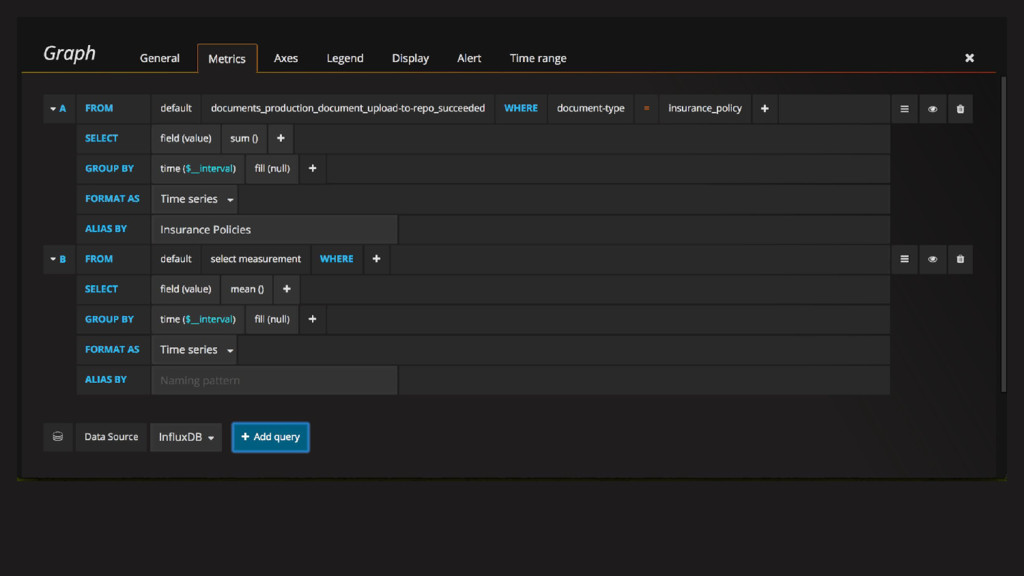
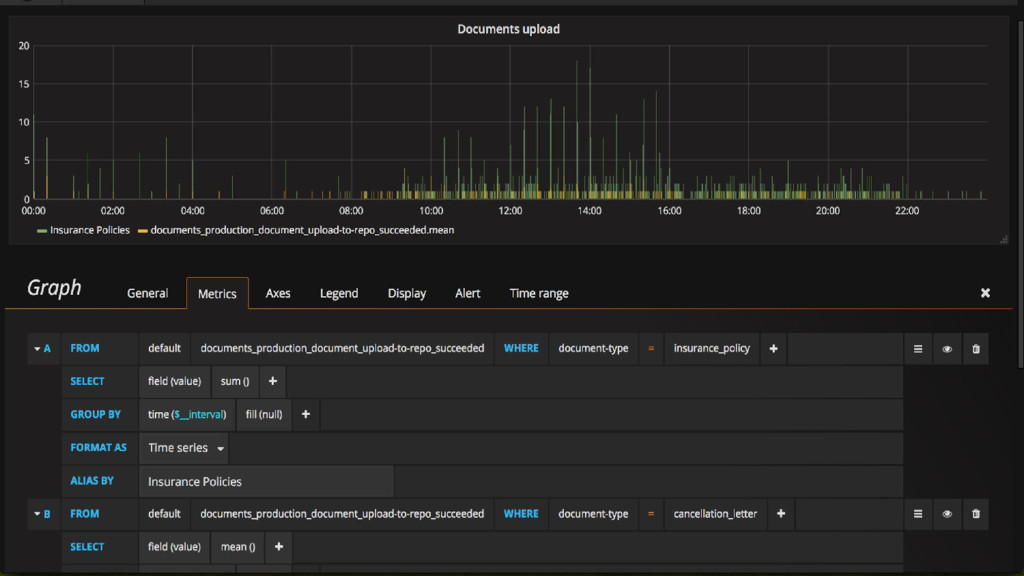
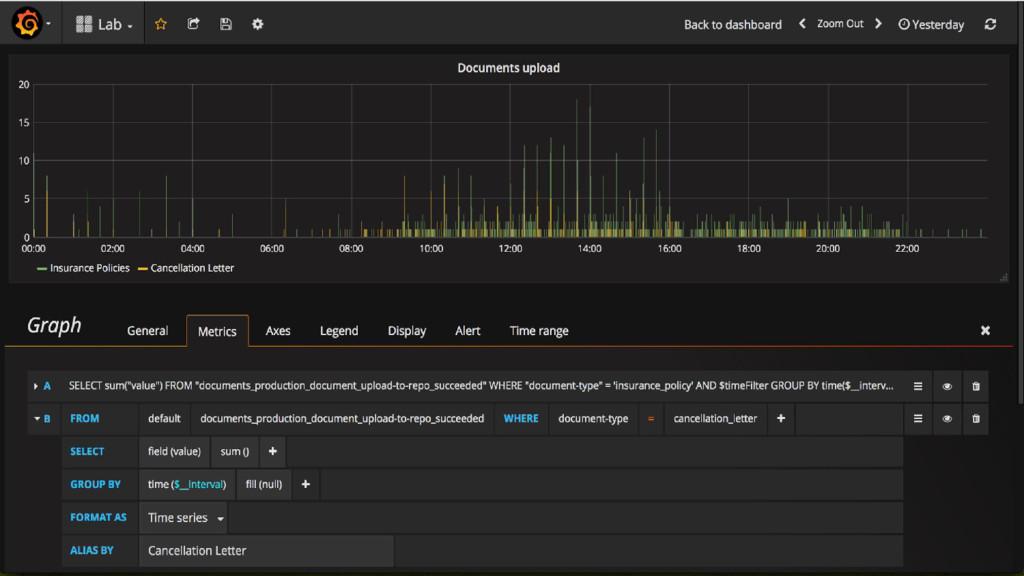
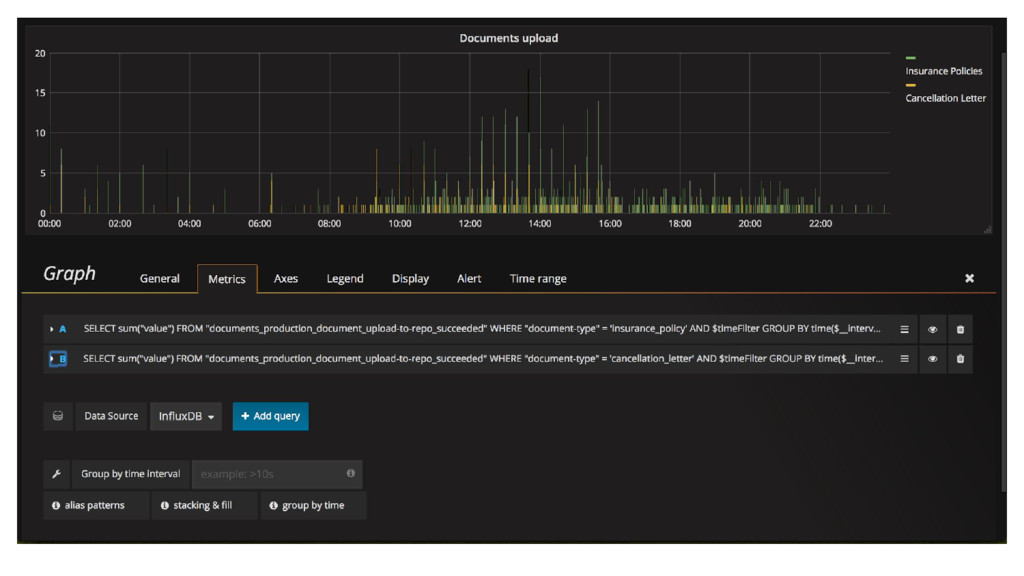
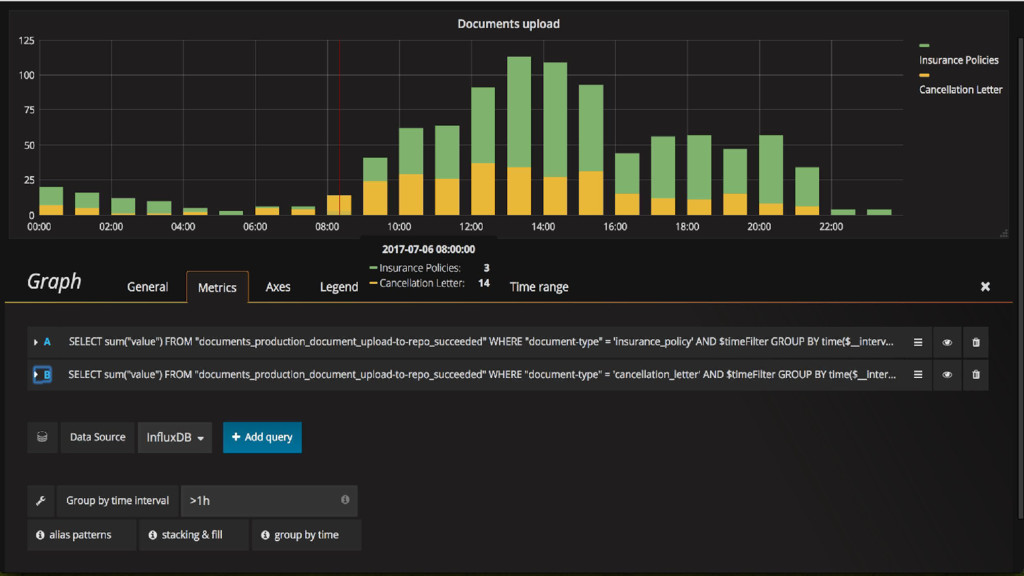
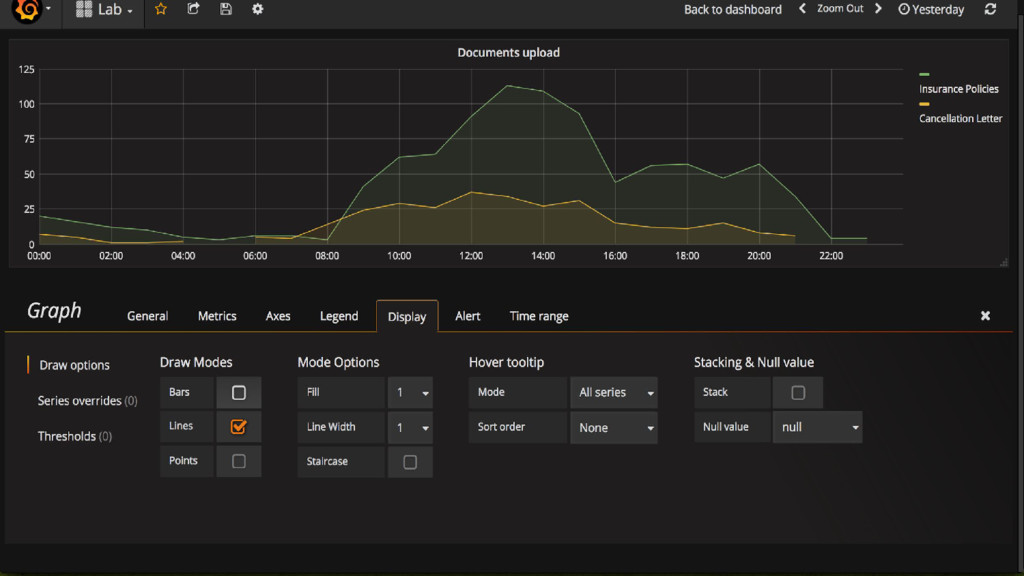
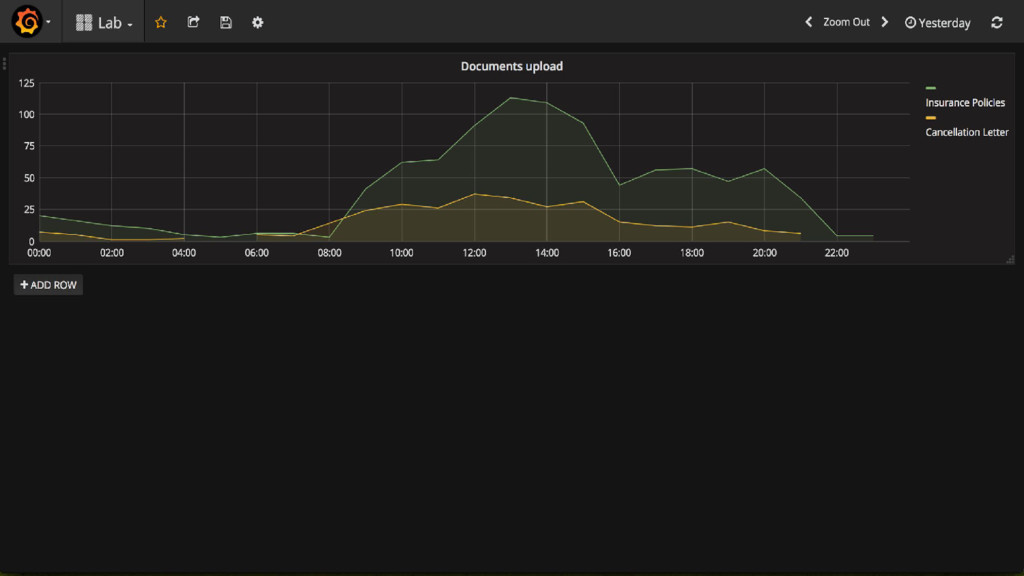
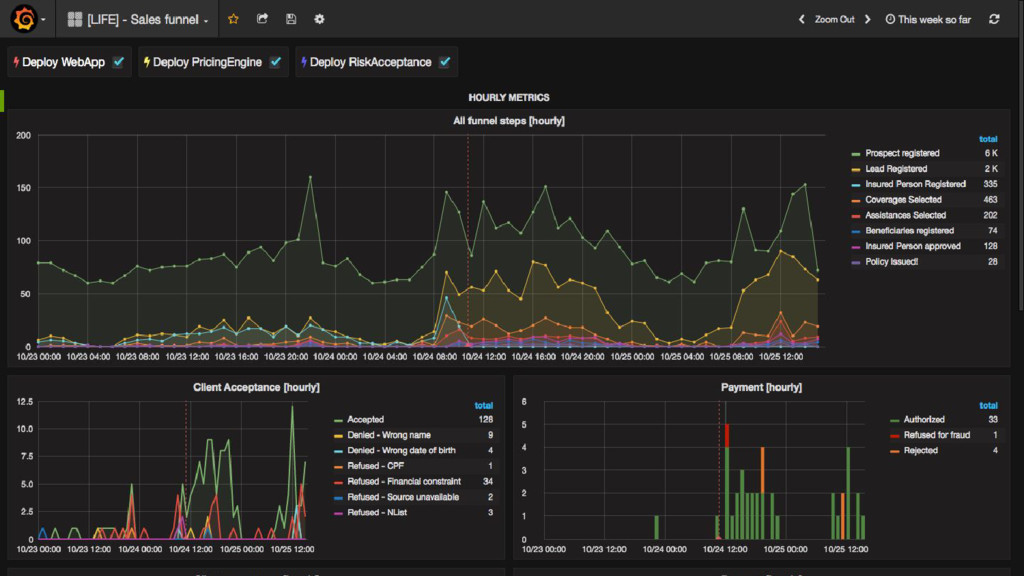
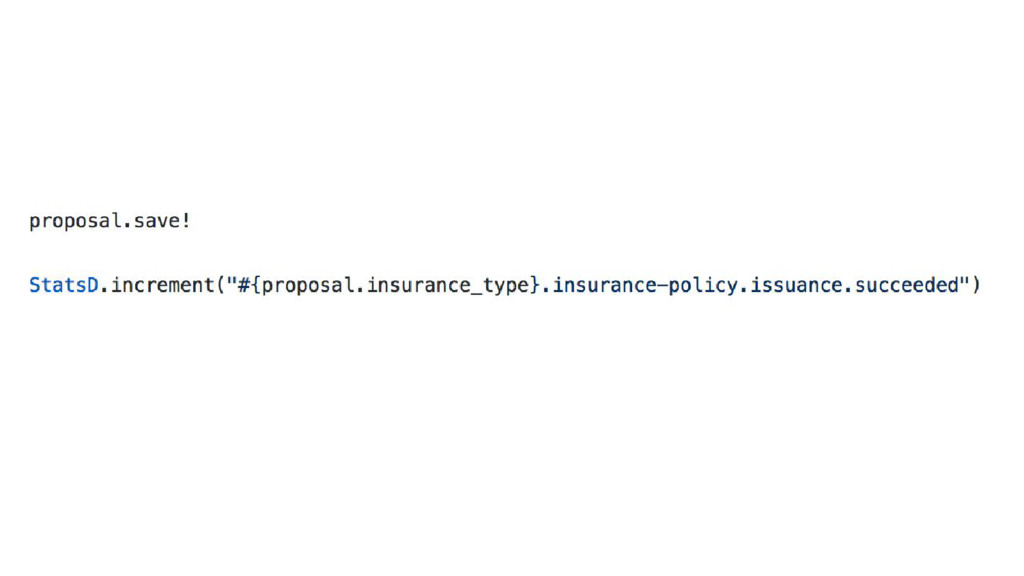
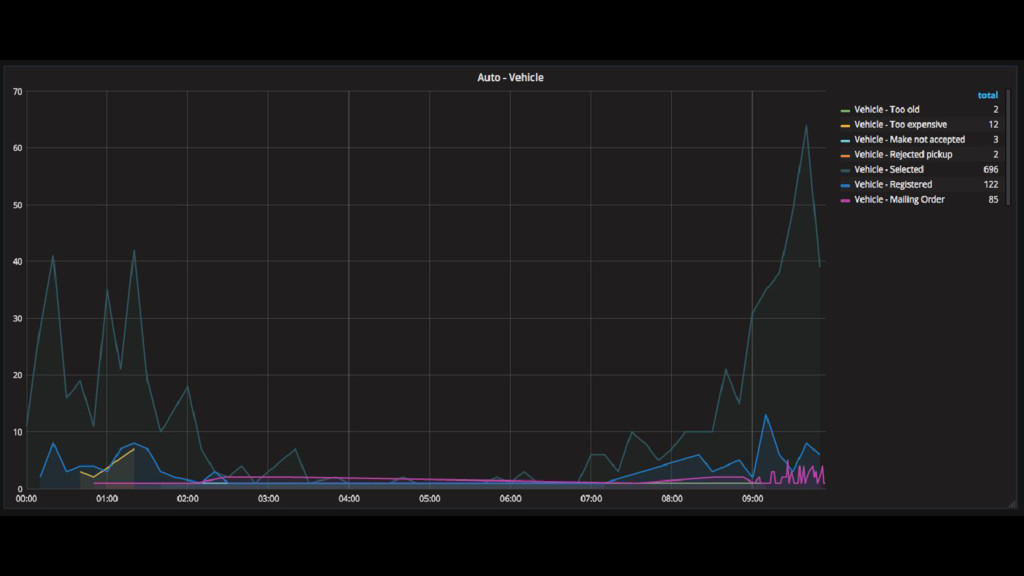
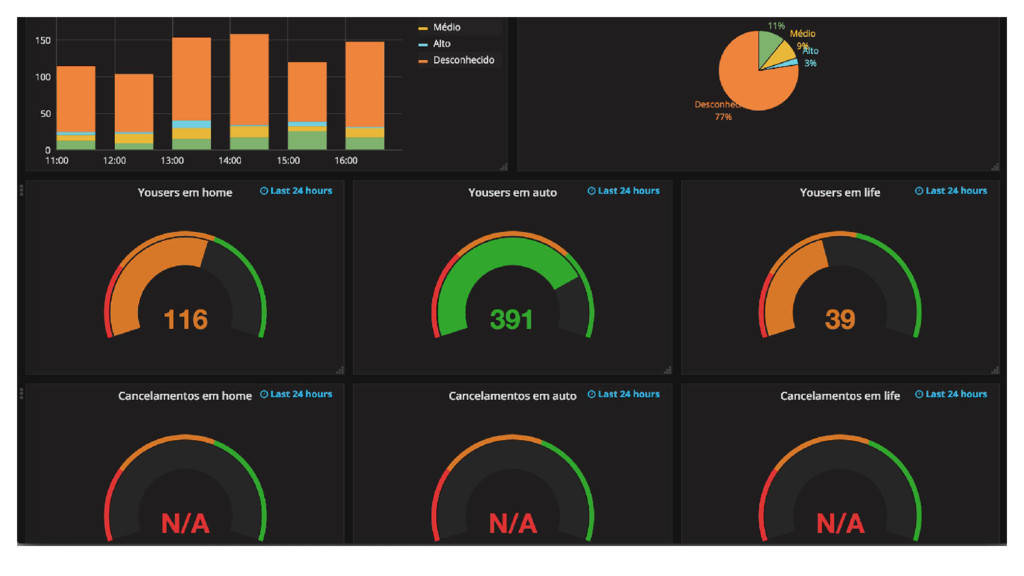
I’d like to suggest an alternative: the combination of StatsD, a platform that collects data to build statistics, and Grafana. It allows us to create beautiful, interactive dashboards that support pluggable panels.
![Artur Caliendo Prado [email protected] @artur.prado @artur_caliendo @arturcp](https://files.speakerdeck.com/presentations/494dd5bb32be48febfae8af99c7afd8e/slide_4.jpg)
![[email protected] @artur.prado](https://files.speakerdeck.com/presentations/494dd5bb32be48febfae8af99c7afd8e/slide_62.jpg)