$30 off During Our Annual Pro Sale. View Details »

Predicting the Popularity of GitHub Repositories (PROMISE 2016)

ASERG, DCC, UFMG
September 07, 2016

Predicting the Popularity of GitHub Repositories (PROMISE 2016)

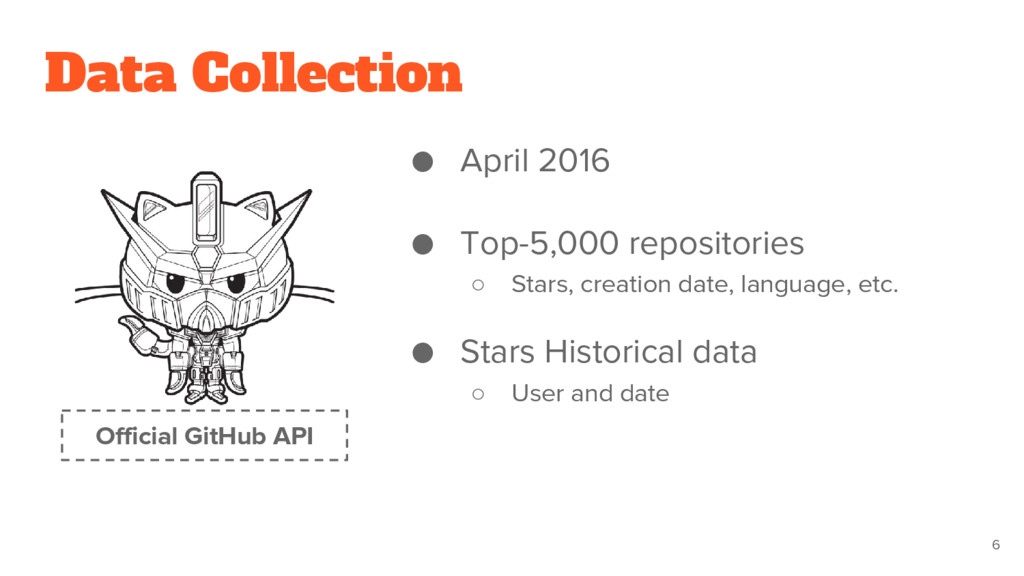
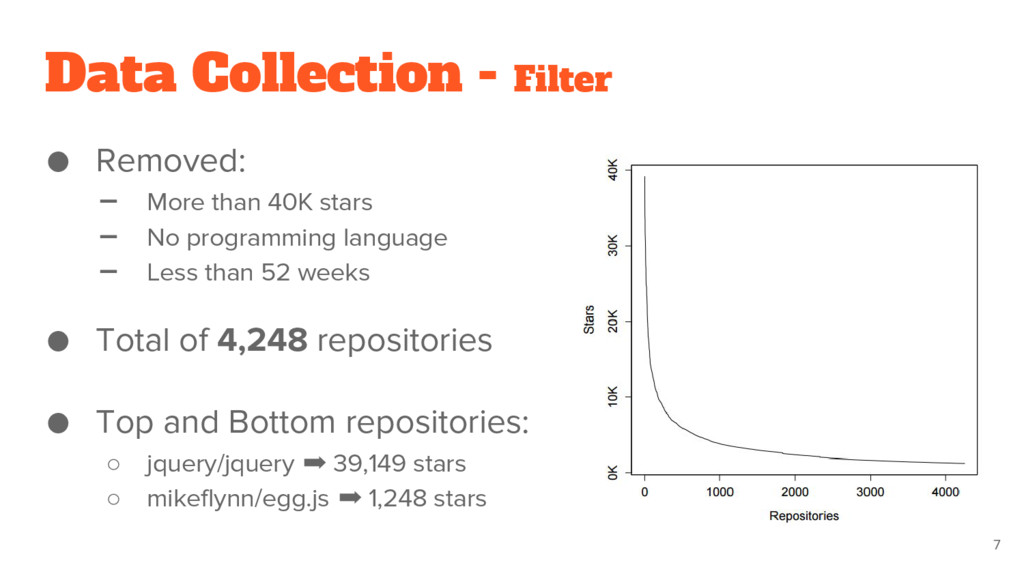
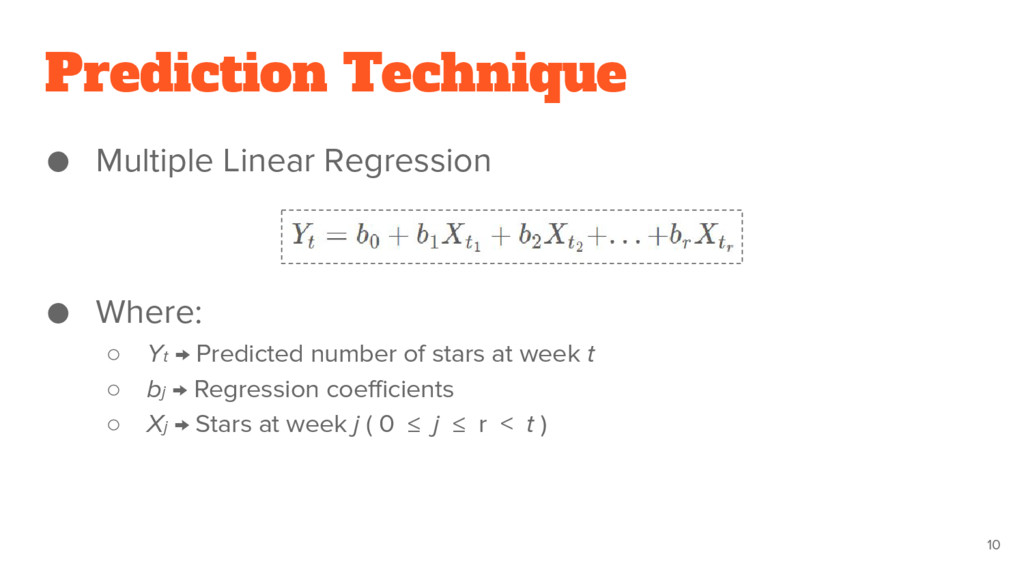
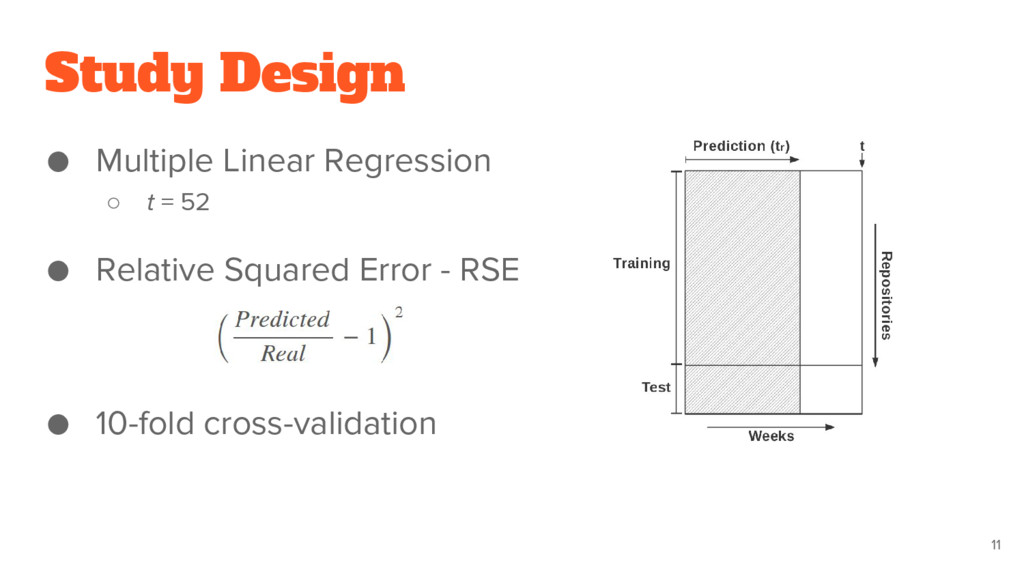
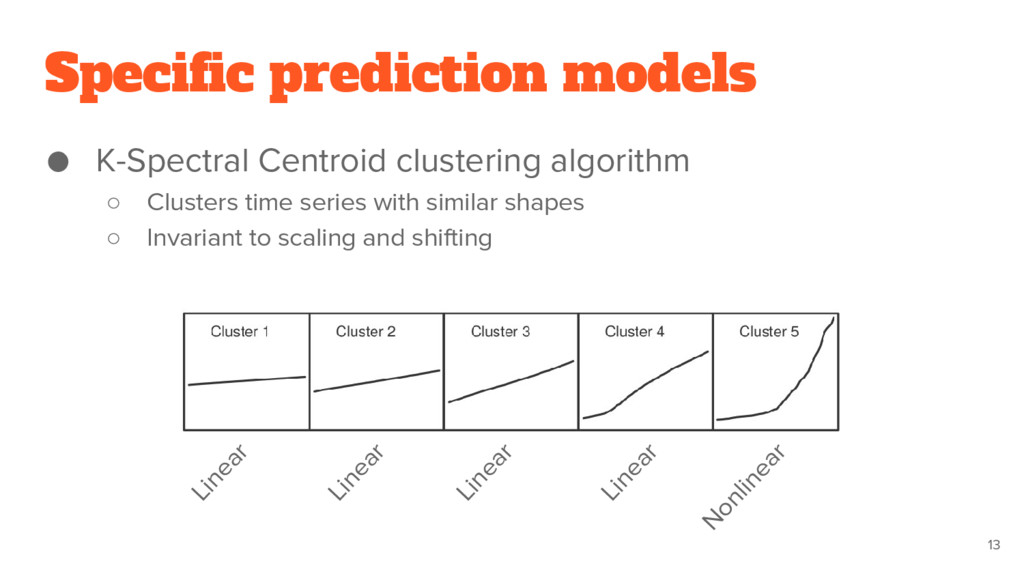
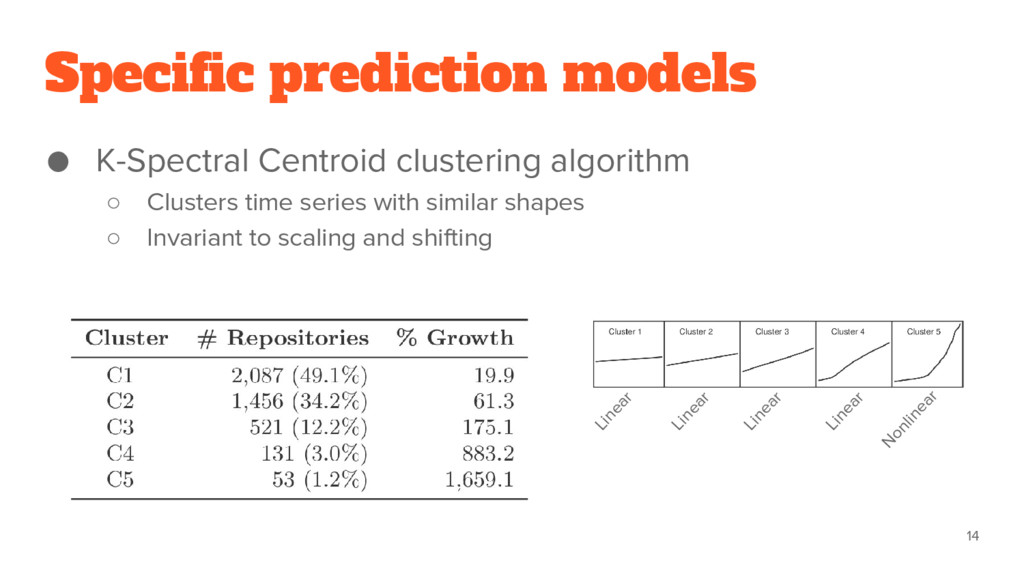
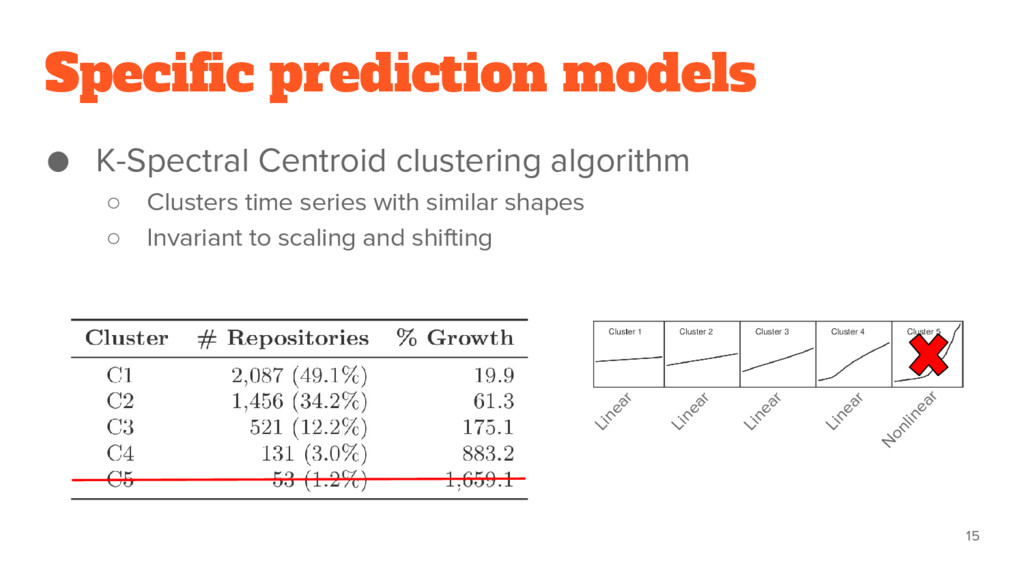
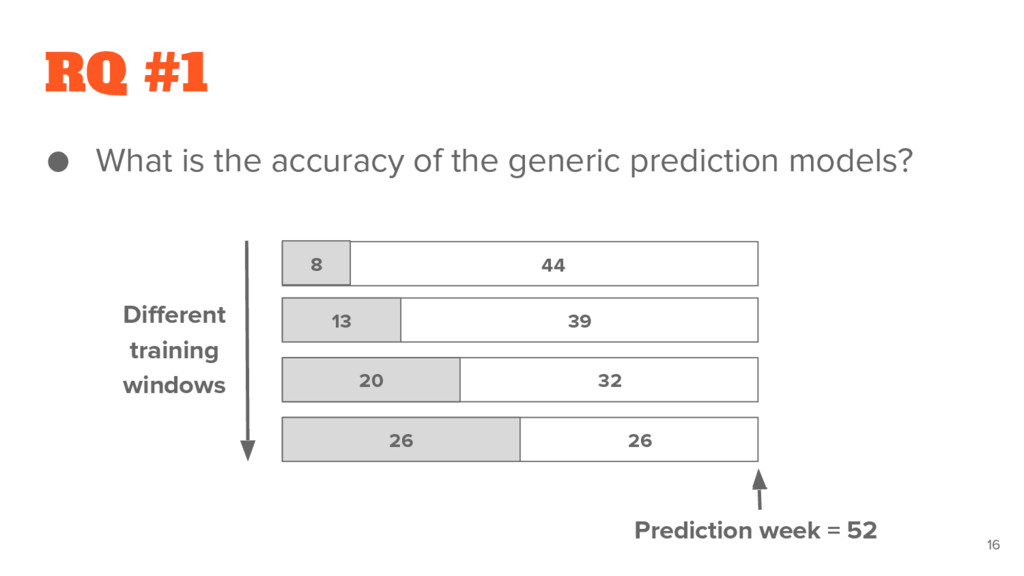
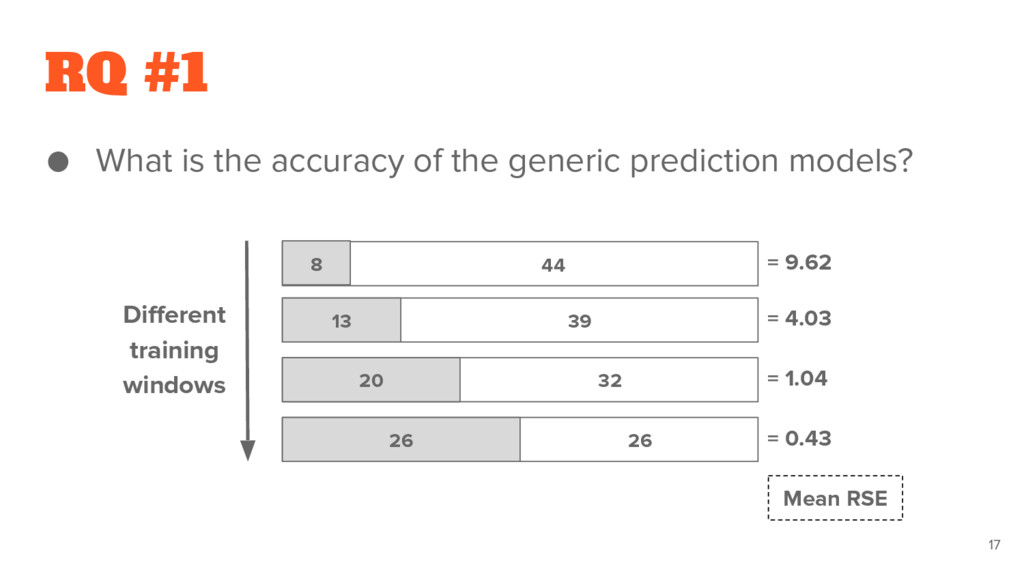
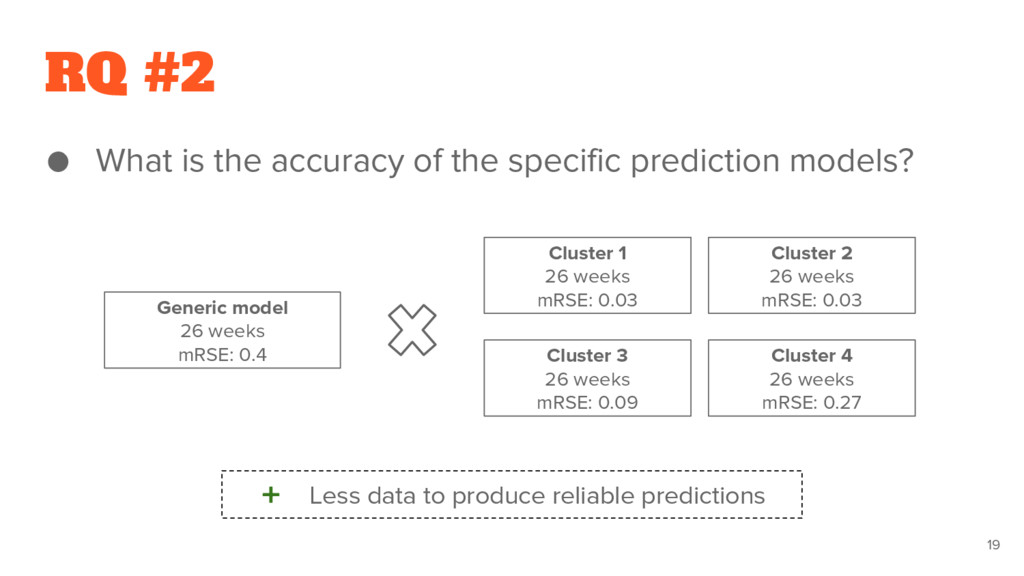
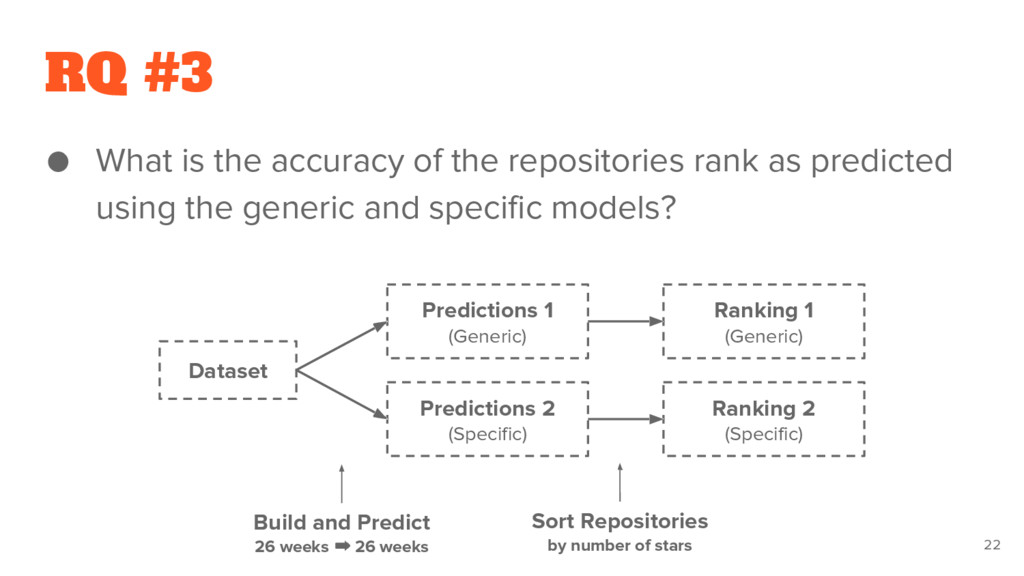
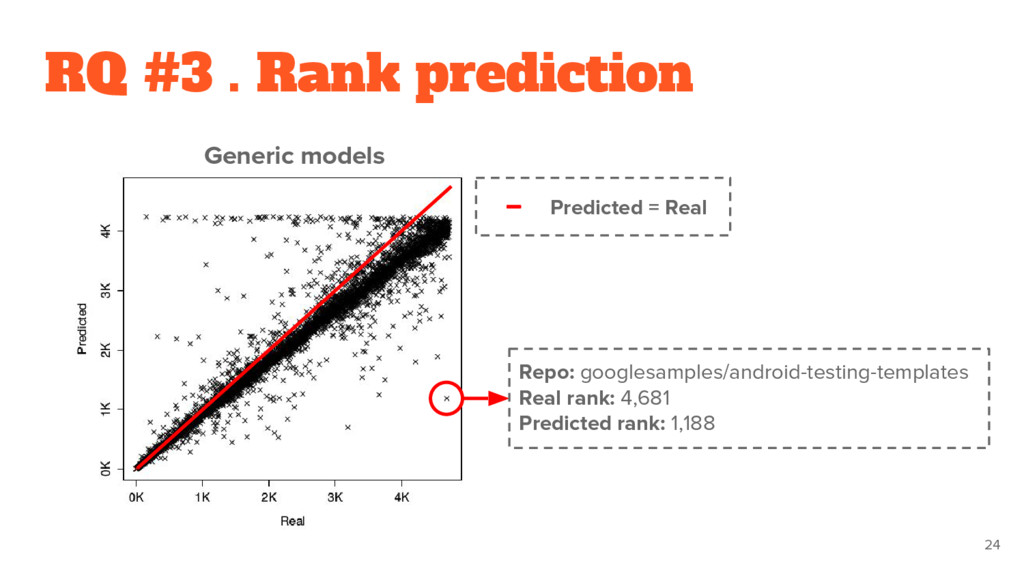
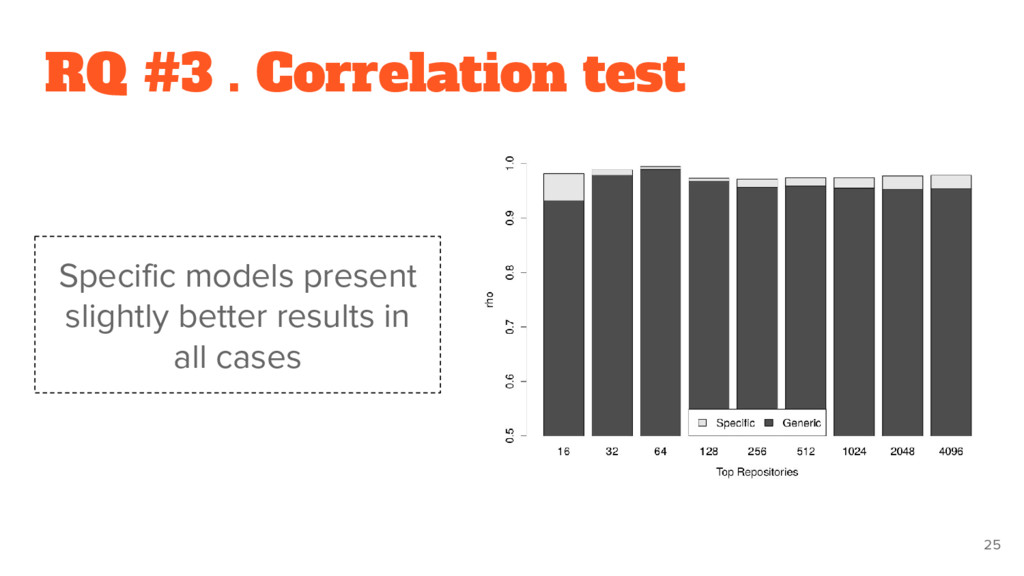
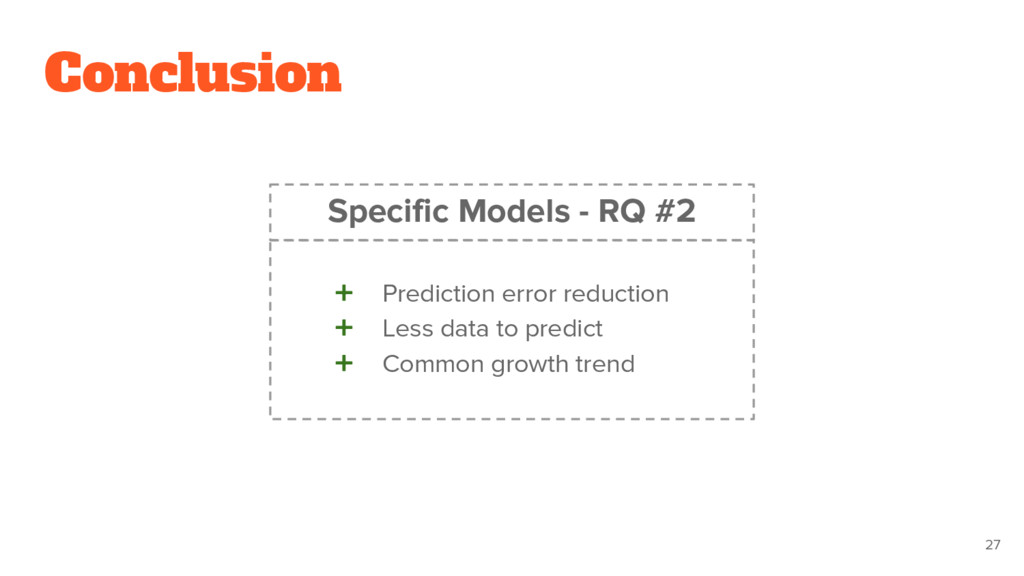
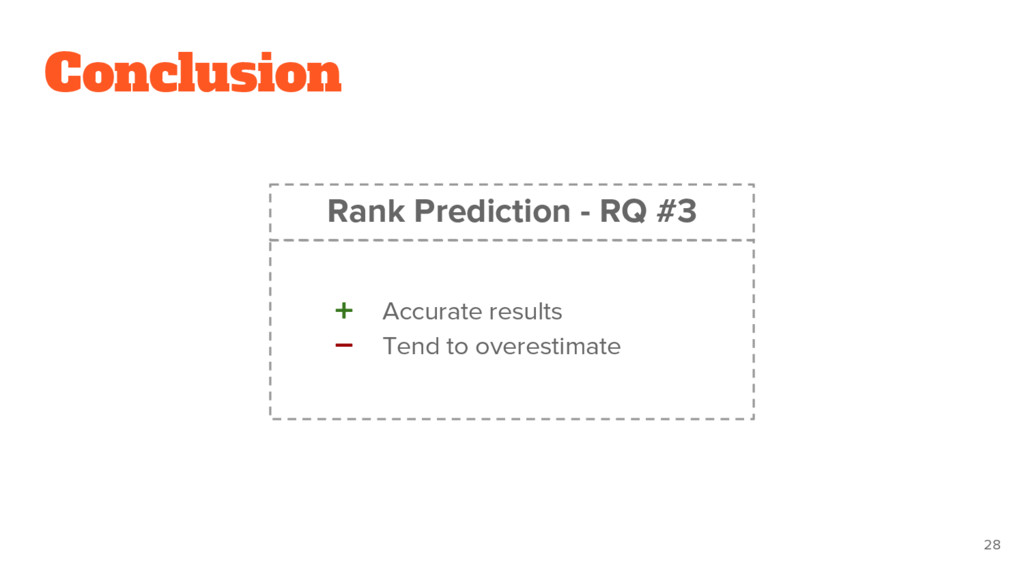
GitHub is the largest source code repository in the world. It provides a git-based source code management platform and also many features inspired by social networks. For example, GitHub users can show appreciation to projects by adding stars to them. Therefore, the number of stars of a repository is a direct measure of its popularity. In this paper, we use multiple linear regressions to predict the number of stars of GitHub repositories. These predictions are useful both to repository owners and clients, who usually want to know how their projects are performing in a competitive open source development market. In a large-scale analysis, we show that the proposed models start to provide accurate predictions after being trained with the number of stars received in the last six months. Furthermore, specific models—generated using data from repositories that share the same growth trends—are recommended for repositories with slow growth and/or for repositories with less stars. Finally, we evaluate the ability to predict not the number of stars of a repository but its rank among the GitHub repositories. We found a very strong correlation between predicted and real rankings (Spearman’s rho greater than 0.95).

ASERG, DCC, UFMG

September 07, 2016
Tweet

More Decks by ASERG, DCC, UFMG

Other Decks in Research

Transcript

  1. Predicting the Popularity
    of GitHub Repositories
    Hudson Borges, Andre Hora, Marco Tulio Valente
    {hsborges, hora, mtov}@dcc.ufmg.br

    View Slide

  2. Introduction
    15M users 36M repositories
    2

    View Slide

  3. Social Coding Features
    3

    View Slide

  4. Our Goal
    ● Goal
    ○ Predict the popularity of GitHub repositories
    ● Why?
    4
    Signal of stagnation Comparison

    View Slide

  5. Research Questions
    1. What is the accuracy of the generic prediction models?
    2. What is the accuracy of the specific prediction models?
    3. What is the accuracy of the repositories rank as predicted
    using the generic and specific models?
    5

    View Slide

  6. Data Collection
    ● April 2016
    ● Top-5,000 repositories
    ○ Stars, creation date, language, etc.
    ● Stars Historical data
    ○ User and date
    6
    Official GitHub API

    View Slide

  7. Data Collection - Filter
    ● Removed:
    ➖ More than 40K stars
    ➖ No programming language
    ➖ Less than 52 weeks
    ● Total of 4,248 repositories
    ● Top and Bottom repositories:
    ○ jquery/jquery ➡ 39,149 stars
    ○ mikeflynn/egg.js ➡ 1,248 stars
    7

    View Slide

  8. Examples of Time Series
    8

    View Slide

  9. 9
    Examples of Time Series

    View Slide

  10. Prediction Technique
    ● Multiple Linear Regression
    ● Where:
    ○ Yt → Predicted number of stars at week t
    ○ bj → Regression coefficients
    ○ Xj → Stars at week j ( 0 ≤ j ≤ r < t )
    10

    View Slide

  11. Study Design
    ● Multiple Linear Regression
    ○ t = 52
    ● Relative Squared Error - RSE
    ● 10-fold cross-validation
    11

    View Slide

  12. Prediction models
    ● Generic models
    ○ Produced from the complete dataset
    ● Specific models
    ○ Produced from repositories with similar growth trends
    12

    View Slide

  13. Specific prediction models
    ● K-Spectral Centroid clustering algorithm
    ○ Clusters time series with similar shapes
    ○ Invariant to scaling and shifting
    13
    Linear
    Linear
    Linear
    Linear
    Nonlinear

    View Slide

  14. ● K-Spectral Centroid clustering algorithm
    ○ Clusters time series with similar shapes
    ○ Invariant to scaling and shifting
    14
    Specific prediction models
    Linear
    Linear
    Linear
    Linear
    Nonlinear

    View Slide

  15. ● K-Spectral Centroid clustering algorithm
    ○ Clusters time series with similar shapes
    ○ Invariant to scaling and shifting
    15
    Specific prediction models
    Linear
    Linear
    Linear
    Linear
    Nonlinear

    View Slide

  16. RQ #1
    ● What is the accuracy of the generic prediction models?
    16
    Different
    training
    windows
    Prediction week = 52
    26 26
    20 32
    13 39
    8 44

    View Slide

  17. RQ #1
    ● What is the accuracy of the generic prediction models?
    17
    Different
    training
    windows
    26 26
    20 32
    13 39
    8 44 = 9.62
    = 4.03
    = 1.04
    = 0.43
    Mean RSE

    View Slide

  18. Stars: 565
    Predicted: 667
    Difference: +18.05%
    Stars: 18,443
    Predicted: 19,373
    Difference: +5.04%
    RQ #1 . Prediction Examples
    18
    Stars: 6,160
    Predicted: 5,369
    Difference: -12.84%
    Stars: 9,919
    Predicted: 10,082
    Difference: +1.64%
    Stars: 584
    Predicted: 793
    Difference: +35.79%
    Stars: 890
    Predicted: 712
    Difference: -20.00%

    View Slide

  19. RQ #2
    ● What is the accuracy of the specific prediction models?
    ➕ Less data to produce reliable predictions
    19
    Generic model
    26 weeks
    mRSE: 0.4
    Cluster 1
    26 weeks
    mRSE: 0.03
    Cluster 2
    26 weeks
    mRSE: 0.03
    Cluster 3
    26 weeks
    mRSE: 0.09
    Cluster 4
    26 weeks
    mRSE: 0.27

    View Slide

  20. RQ #2 . Improvement
    Median
    ● Cluster 1 ➡ 15.72%
    ● Cluster 2 ➡ 1.08%
    ● Cluster 3 ➡ 2%
    ● Cluster 4 ➡ 6.66%
    20

    View Slide

  21. RQ #2 . Prediction Examples
    21
    Stars: 565
    Predicted: 583
    Improve: +82.35%
    Stars: 18,443
    Predicted: 18,432
    Improve: +4.98%
    Stars: 6,160
    Predicted: 5,578
    Improve: +3.39%
    Stars: 9,919
    Predicted: 10,571
    Improve: -4.93%
    Stars: 584
    Predicted: 523
    Improve: +25.34%
    Stars: 890
    Predicted: 853
    Improve: +14.29%

    View Slide

  22. RQ #3
    ● What is the accuracy of the repositories rank as predicted
    using the generic and specific models?
    22
    Dataset
    Predictions 1
    (Generic)
    Predictions 2
    (Specific)
    Build and Predict
    26 weeks ➡ 26 weeks
    Ranking 1
    (Generic)
    Ranking 2
    (Specific)
    Sort Repositories
    by number of stars

    View Slide

  23. RQ #3
    ● What is the accuracy of the repositories rank as predicted
    using the generic and specific models?
    23
    Ranking 1
    (Generic)
    Ranking 2
    (Specific)
    Ranking 3
    (GitHub - April, 2016)

    View Slide

  24. RQ #3 . Rank prediction
    Generic models
    24
    ➖ Predicted = Real
    Repo: googlesamples/android-testing-templates
    Real rank: 4,681
    Predicted rank: 1,188

    View Slide

  25. RQ #3 . Correlation test
    Specific models present
    slightly better results in
    all cases
    25

    View Slide

  26. Conclusion
    ➕ 6 months ➡ 6 months
    ➕ Highly popular repositories
    Generic Models - RQ #1
    26

    View Slide

  27. Conclusion
    ➕ Prediction error reduction
    ➕ Less data to predict
    ➕ Common growth trend
    Specific Models - RQ #2
    27

    View Slide

  28. Conclusion
    ➕ Accurate results
    ➖ Tend to overestimate
    Rank Prediction - RQ #3
    28

    View Slide

  29. Conclusion
    ➕ Different prediction approaches
    ➕ Other measures (e.g., forks)
    Future Work
    29

    View Slide

  30. Thank you!
    30

    View Slide