Upgrade to Pro — share decks privately, control downloads, hide ads and more …

IT Metrics and Loyola University Chicago (EDUCAUSE Annual National Conference 2009)

Adam Smeets
November 04, 2009

IT Metrics and Loyola University Chicago (EDUCAUSE Annual National Conference 2009)

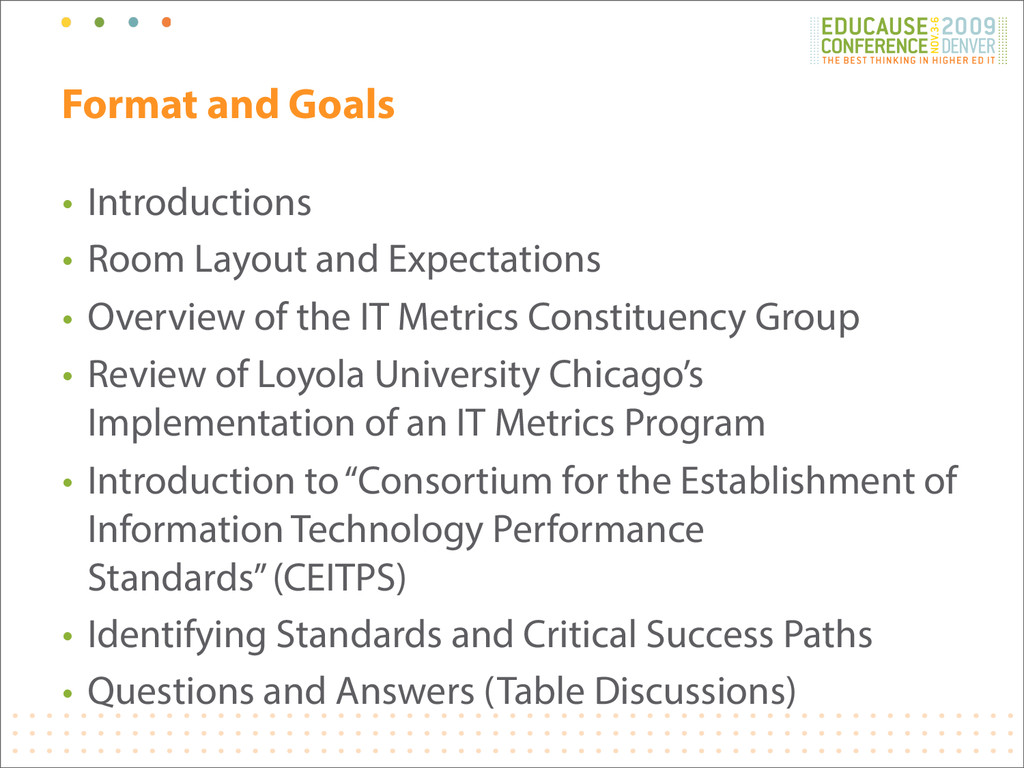
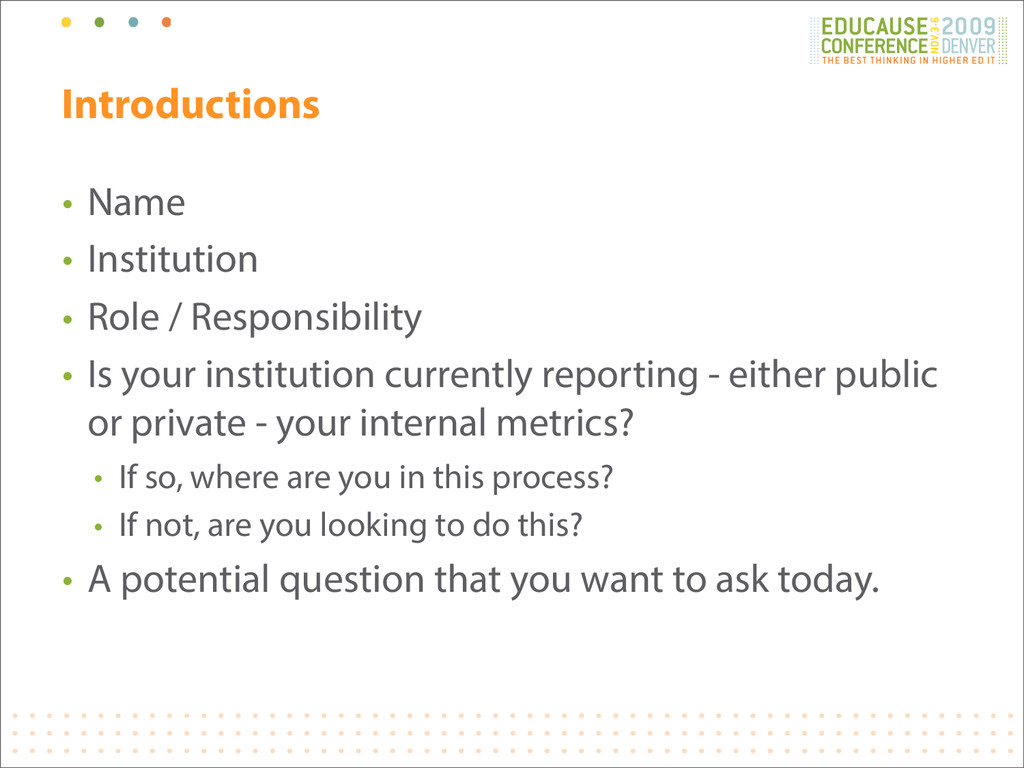
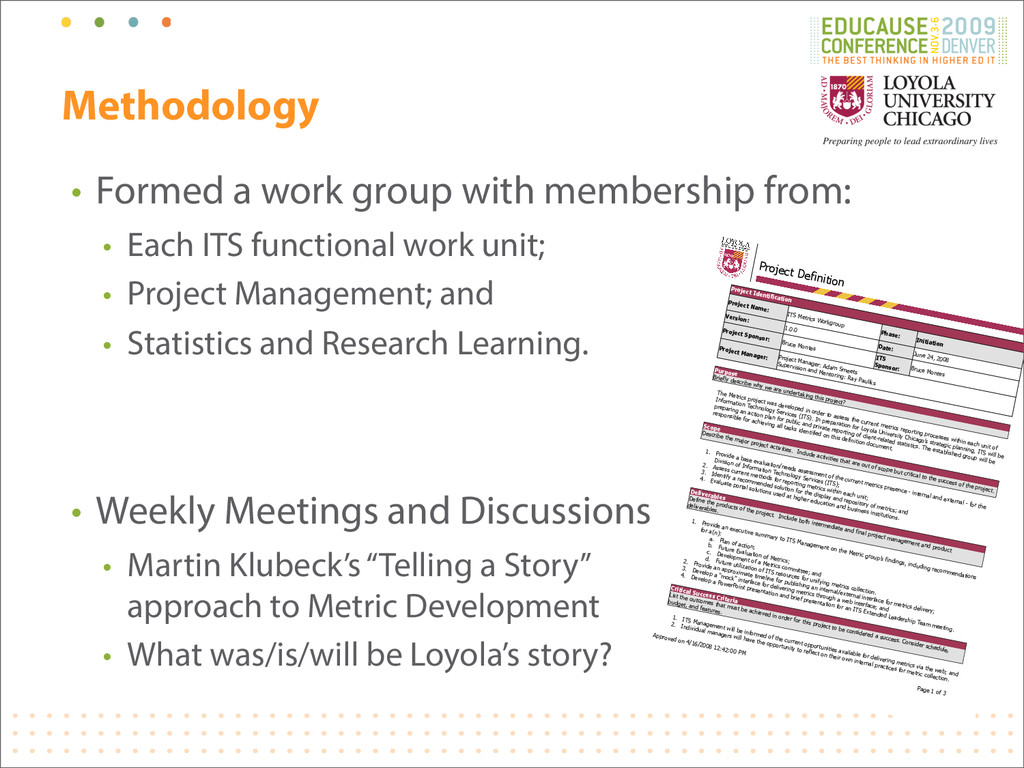
In the first hour of the IT Metrics discussion session, participants are invited to learn about the experiences of implementing a division-wide metrics education program at Loyola University Chicago. During this time attendees will also learn about a new consortium offering through the IT Metrics Constituent Group. In the remaining time, participants will have an opportunity to participate in peer group discussions regarding IT Metrics topics, interest and/or involvement in metrics at their institutions, as well as identifying questions for further discussion throughout the year between EDUCAUSE meetings.

Adam Smeets

November 04, 2009
Tweet

More Decks by Adam Smeets

Other Decks in Education

Transcript

  1. IT Metrics Martin Klubeck, University of Notre Dame Adam Smeets,

    Loyola University Chicago November 4, 2009
  2. Welcome • Martin Klubeck, University of Notre Dame [email protected] Strategy

    and Planning Consultant • Adam Smeets, Loyola University Chicago [email protected] Digital Media Specialist
  3. Format and Goals • Introductions • Room Layout and Expectations

    • Overview of the IT Metrics Constituency Group • Review of Loyola University Chicago’s Implementation of an IT Metrics Program • Introduction to “Consortium for the Establishment of Information Technology Performance Standards” (CEITPS) • Identifying Standards and Critical Success Paths • Questions and Answers (Table Discussions)
  4. Introductions • Name • Institution • Role / Responsibility •

    Is your institution currently reporting - either public or private - your internal metrics? • If so, where are you in this process? • If not, are you looking to do this? • A potential question that you want to ask today.
  5. IT Metrics Constituency Group • Forum for discussing issues and

    challenges associated with developing, collecting, and reporting IT metrics in a higher education environment. • Leverage efforts of peers and identify benchmarks that can be used to improve the overall performance of IT departments. • Goal of this constituent group is to assist others in implementing metrics in a more rigorous, meaningful, and timely manner than would otherwise be possible.
  6. IT Metrics Constituency Group: Future Meetings and Discussions • IT

    Metrics CG meets annually at the EDUCAUSE Annual Conference • Communication through “Of-the-Month” Topics and Discussions via the IT Metrics Listserv • Utilization of other Avenues for Meeting More Frequently?
  7. Loyola University Chicago • One of 28 Jesuit colleges and

    universities in the U.S. • 15,000 total enrollment • 40% of undergrads come from outside Illinois • 9 schools and colleges • 14:1 student/faculty ratio
  8. 10 Loyola University Chicago Division of Information Technology Services Information

    Technology Services Business Operations & Administrative Services Systems Implementation & Consulting Database Management & Business Intelligence Web Development & Content Management Application Integration & Middleware Application Development & Systems Integration Infrastructure Services Network Services Systems Maintenance & Administration Desktop Services Academic Technology Services Student Services Media Services Research & Teaching Services Technology Support Center Information Commons Project Management Information Security Enterprise Architecture & Project Management Office (PMO) Office of the VP\CIO Enterprise Architecture Susan Malisch VP\CIO Ana Prokic Business Manager Yolanda Neal Executive Assistant Bruce Montes Director Jim Sibenaller Director Dan Vonder Heide Director Kevin Smith Director Katy Holiday Manager Elizabeth Aguirre Ariana Lewis Dorothy Rodriguez Student Support (1) Open Position Christina Bello Lauree Garvin Liz Van Kleeck Grad Asst (6) Student Support (2) Joseph Brunner Sean Ohlinger Paul Zlatkin Student Support (7) Nick Liberatore Jared Thomas Greg Small (PPT) RESNET (9) Student Support (37) Giorgio Costa Bill Davies Robert DiBlasi Cristina Herrera Jeremiah Holt Cory Martin Sean Obrock Chuck Zelinski Student Support (3) Paul Kott Sam Martinez Bill Martin Jimmy Smith Joe Wardzala Corkey Wilburn Elisabeth Haroldson Dave Gabrovich Jeff Fergle Bob Heesemann Jaime Herrera Chris Oh Tim Winckowski Adina Tenenbaum (PPT) Student Support (1) Ed Yurco Michelle Dayton Karen Dodaro Saundra Harrison Ivan Siap Xiomara Franco Mark Raymond Rich Gruss Bob Kraft Linda Moser Patricia Trinco Russ Yoshioka Paul Zolnierczyk Student Support (1) Sorin Ciobanu Tom Hulihan Leslie Moore Jose Martinez Sue Nicholas Conrad Vanek Matt Riolo Michael Bessette (PPT) Greg Biskoski Marilyn Burk Bob Klein Michael Martin Mark Reich Kayalvizhi Asokan Jack Corliss Manager Tim Walker Manager Alison Stillwell Manager Kathy Ryan Manager Jeff Apa Manager Dave Wieczorek Manager Larry Adams Manager Walt Slazyk Manager Cheryl Heckel Manager Charlotte Pullen Manager Peter Prina Florence Yun Student Support (2) Mary Jo Banks Administrative Assistant Student Support (2) Ray Pauliks Sr. Project Manager Katherine Kim Ashley Brenke Erik Decker Student Support (2) Open Position Adam Smeets Student Support (9) Leilani Lauger Information Security Officer Tom Mathewson Business Process Architect ITS @ Loyola University Chicago
  9. Overview • Assess the current metrics reporting process within each

    unit of Information Technology Services (ITS); • Developed and implemented an action plan for public/private reporting of client-related statistics; • Compiled a needs assessment plan, evaluation of campus efforts at AJCU and Chicago institutions, as well as recommendations for future action; • Better prepared to answer the “What if...?” and “What happens when...?” questions.
  10. Methodology • Formed a work group with membership from: •

    Each ITS functional work unit; • Project Management; and • Statistics and Research Learning. • Weekly Meetings and Discussions • Martin Klubeck’s “Telling a Story” approach to Metric Development • What was/is/will be Loyola’s story? Project Identification Project Name: ITS Metrics Workgroup Phase: Initiation Version: 1.0.0 Date: June 24, 2008 Project Sponsor: Bruce Montes ITS Sponsor: Bruce Montes Project Manager: Project Manager: Adam Smeets Supervision and Mentoring: Ray Pauliks Purpose Briefly describe why we are undertaking this project? The Metrics project was developed in order to assess the current metrics reporting processes within each unit of Information Technology Services (ITS). In preparation for Loyola University Chicago’s strategic planning, ITS will be preparing an action plan for public and private reporting of client-related statistics. The established group will be responsible for achieving all tasks identified on this definition document. Scope Describe the major project activities. Include activities that are out of scope but critical to the success of the project. 1. Provide a base evaluation/needs assessment of the current metrics presence - internal and external - for the Division of Information Technology Services (ITS); 2. Assess current methods for reporting metrics within each unit; 3. Identify a recommended solution for the display and repository of metrics; and 4. Evaluate portal solutions used at higher education and business institutions. Deliverables Define the products of the project. Include both intermediate and final project management and product deliverables. 1. Provide an executive summary to ITS Management on the Metric group’s findings, including recommendations for a(n): a. Plan of action; b. Future Evaluation of Metrics; c. Development of a Metrics committee; and d. Future utilization of ITS resources for unifying metrics collection. 2. Provide an approximate timeline for publishing an internal/external interface for metrics delivery; 3. Develop a “mock” interface for delivering metrics through a web interface; and 4. Develop a PowerPoint presentation and brief presentation for an ITS Extended Leadership Team meeting. Critical Success Criteria List the outcomes that must be achieved in order for this project to be considered a success. Consider schedule, budget, and features. 1. ITS Management will be informed of the current opportunities available for delivering metrics via the web; and 2. Individual managers will have the opportunity to reflect on their own internal practices for metric collection. Project Definition Approved on 4/16/2008 12:42:00 PM Page 1 of 3
  11. Wikis & Documentation Dashboard > ITS Metrics Project > Welcome

    to the Metrics Project Search ITS Metrics Project Welcome Adam Smeets | History | Preferences | Log Out Welcome to the Metrics Project View Edit Attachments (1) Info Browse Space Add Page Add News The Metrics project was developed in order to assess the current metrics reporting processes within each unit of Information Technology Services (ITS). In preparation for Loyola University Chicago's strategic planning, which begins this July, ITS will be preparing an action plan for public and private reporting of client-related statistics. Listed below are the main categories for this Wiki that you can explore to learn more information: z Agendas z Analysis & Findings z Metrics Work Group z Minutes z Presentations z Project Management Children Hide Children | View in Hierarchy | Add Child Page Agendas Analysis & Findings Metrics Work Group Documentation Minutes Presentations Project Management 0 Comments | Add Comment Added by admin , last edited by Adam Smeets on Aug 18, 2008 (view change) Labels: (None) EDIT Page 1 of 1 Welcome to the Metrics Project - ITS Metrics Project - Confluence
  12. Work Group Review and Findings • The Dreaded 7’s •

    Concerns With Current Reporting • Institutional Research • Recommendations for Growth and Improvement
  13. The 7 Dreaded W’s... • Who is collecting metric data?

    • Where is metric data reported? • What is the current procedure for reporting public metrics in ITS? • Where is metric data stored? • When is data collected? • What format is utilized by managers to capture data at each interval? • What access levels are appropriate for metric data? •
  14. The 7 Dreaded W’s... • Who is collecting metric data?

    • 12 Respondents from assessment (Filtered data) • 48 Metrics Collected (N=48) • Individual designations for collection • Where is metric data reported? • Historical data scattered across Division • Email, raw data, weekly status reports and bears, oh my…
  15. The 7 Dreaded W’s... • What is the current procedure

    for reporting public metrics in ITS? • Some metric data in PDF format, yearly • Where is metric data stored? • Wide disparity of locations • 16 different locations for data • 15% require manual tracking
  16. The 7 Dreaded W’s... • When is data collected? •

    33% of metrics are weekly • What format is utilized by managers to capture data? • All surveyed metrics are reported manually, sometimes generated reports • What access levels are appropriate for metric data? • 57% are self-determined public
  17. Potential Road Blocks Identified • Distribution List Utilization • Historical

    Analysis a Difficult Process • Validity and Reliability of Data • Specificity of Data • Variety of Reporting Methods • Division Data Accessibility
  18. AJCU Research and Findings • Does the institution’s IT/IS/ITS department

    publish metrics for review? • If yes, are the metrics available to visitors without a password or authentication? • If yes, are the metrics up-to-date with current data? • If yes, does the institution use charts to display content? • If yes, does the institution provide a summary for their metric(s)? • If yes, does the institution provide a target goal for individual metrics?
  19. AJCU Research and Findings uit University " N/A N/A N/A

    sity " N/A N/A N/A art was collected on the premise that the information should be collected from a publicly accessible format. As equired a login name and/or password to view statistics will have a pencil icon (#) in the !rst question column " Not Available # Available # Login required to access Web Evaluation of AJCU Institutions for Metric Availability (As of July 14, 2008) 1 24 3 Metrics Available - Not Updated Recently Metrics Unavailable Metrics Available - Password Required to View - Executive Summary
  20. Chicago-Based Institution Research and Findings sity of Illinois - Chicago

    " N/A N/A N/A N/A r this chart was collected on the premise that the information should be collected from a publicly accessible format. As such, sites that required a login name and/or password to view statistics will have a pencil icon (#) in the !rst question column. " Not Available # Available # Login required to access e again anticipated higher percentages of institutions reporting metric-based statistics, we were surprised to !nd that the ere similar to that of the AJCU’s. In our AJCU study, 11% of institutions reported a form of metrics and similarly in the area approximately 18% of the surveyed institutions are reporting comparable data. Web Evaluation of Chicago-Area Institutions for Metric Availability (As of July 14, 2008) 9 1 1 Metrics Unavailable Metrics Available - Password Required to View Metrics Available - Updated Project - Executive Summary Page
  21. Work Group Recommendations • Committee Development • Evaluation of Metrics

    • Connections to best practices in their respective areas; • Criterion-based approach; • Connections to our ITS rings and services provided; and • Equal balance of internal and external data sets. • Procedures for Metrics & Automated Metrics Management • Utilization of ITS Resources
  22. The Move From Recommendation to Action: Taking Flight with IT

    Metrics Your reservation is complete. Con!rmation # MO4V5SQ Information Tech Services, ITS ELT Member - 84,203 Available Member Points Information Technology Services Information Technology Services STAFF/INFORMATION TECH ITS 240 15 DEC 08 GRANADA GC SEAT 18A GATE CLOSES 1325 GATE D64 ITS ELT MEMBER – 2832840923884 POINTS HAVE BEEN AWARDED TO YOUR ACCOUNT FOR THIS LEG OF YOUR JOURNEY. FOR MORE INFORMATION REGARDING ITS METRICS, PLEASE EMAIL [email protected]. BOARDING PASS FOR ASSISTANCE AT THE TIME OF BOARDING, PLEASE CONTACT ANY MEMBER OF OUR FLIGHT CREW: KATY HOLIDAY, BRUCE MONTES, CHRIS OH, MATT RIOLO, ADAM SMEETS, PAT TRINCO, FLORENCE YUN SUBJECT TO CONDITIONS OF INFORMATION TECHNOLOGY SERVICES STAFF, COPIES OF CONDITIONS AVAILABLE UPON REQUEST. SEE IMPORTANT NOTICES ON THE ITS METRICS WIKI: HTTPS://WIKI.LUC.EDU:8443/DISPLAY/ITMP NAME OF PASSENGER STAFF / INFORMATION TECH FROM EXCEL SPREADSHEETS TO DASHBOARD REPORTING FLIGHT NO. ITS 240 CLASS/DATE TIME X 12DEC08 1330 GATE GATE CLOSES SEAT SMOKE D64 1325 18A ! PCS. CK WT. UNCK SEQ NO 2 34 1 190 = = ETKT ! ! Trim Here Prior to Travel ! ! Trim Here Prior to Travel ! 5
  23. Overview of Stages • Making Reservations • Often the first

    step in making any travel plans, during this stage you will learn about the Metrics Committee as well as providing metric information from your area and evaluating your current reporting procedures. • Check-In & Security • Boarding • In-Flight • Baggage Claim
  24. Overview of Stages • Making Reservations • Check-In & Security

    • While we may not ask you to take off your shoes, we will ask a variety of questions regarding security of your metrics and data access. With boarding pass in hand, we will look into a variety of "best practices" questions. • Boarding • In-Flight • Baggage Claim
  25. Overview of Stages • Making Reservations • Check-In & Security

    • Boarding • During the boarding process, passengers are asked to queue for an upcoming flight. In this step, you will look at your data and identify trends. Additionally, you will have the opportunity to review the display of your data. • In-Flight • Baggage Claim
  26. Overview of Stages • Making Reservations • Check-In & Security

    • Boarding • In-Flight • In coordination with the Flight Crew, permissions will be established and a variety of database requests and connections will be made. While no meal will be served, an in-flight movie will be shown during this trip. • Baggage Claim
  27. Overview of Stages • Making Reservations • Check-In & Security

    • Boarding • In-Flight • Baggage Claim • You've arrived at baggage claim A4, but there's one last step to go before you're in metric paradise. You will review the final draft display of your metrics, establish a metric steward and sign-off on the final presentation.
  28. Flight Crew • Your flight crew are here to support

    you through your metric travels. With a variety of resources and information available, this is surely a place you will want to check out.
  29. Making Reservations • In consultation with their supervisor(s), Managers asked

    to select up to five (5) key metrics that are utilized in their respective areas • Managers asked to complete up to five (5) submissions, responding to the following: • What functional area is your metric from? • What service area is your metric from? • Who will have sign-off authority for this metric? • What question are you trying to answer? • Work group reviewed submissions and established criterion for KPI’s and additional database design needs Making' Reserva-ons' Check2In'&' Security' Boarding' In2Flight' Baggage' Claim'
  30. Oversold Flights and Concerns... • Direct comparisons between other functional

    areas… • Attention may be drawn to issues that were unknown previously… • Systems may already be in place for addressing your metric needs… • It appears that this will be a lot of work… • I have busy and slow times of year… • What happens if my data is no longer accurate… • Is there value in doing something like this… • Who determines what is satisfactory… • With public access, I may limit what I share… • I may need to adjust my information later… 33
  31. Making Reservations Findings 34 METRIC OVERVIEW Qualitative Quantitative More Information

    Necessary (MIN) Academic Technology Services Enterprise Architecture & PMO Infrastructure Services Office of the VP/CIO Systems Implementation & Consulting Metrics Completed in Stage 1 Metrics Completed in Stage 1 and 2 STAGE READINESS BETWEEN SECTIONS QUALITATIVE VERSUS QUANTITATIVE FUNCTIONAL AREA SUBMISSIONS REGARDLESS OF STAGE
  32. Check-In & Security • Managers asked to revisit their previously

    submitted metrics (up to five [5]), in consultation with their supervisor(s). • Managers asked to complete up to five (5) submissions, responding to the following: • Are you already collecting information/data for this metric? • If yes, how much historical data do you have access to? • How frequently should data supporting this metric be collected from your data source? • How frequently should this metric be updated and displayed on the web? • Describe the expected life-span of this metric. • What data will be collected and used to develop this metric? • Where is the data for your metric located? • What staff member is responsible for this data source? • What is a set of example values that you would consider in “target?” Making' Reserva-ons' Check2In'&' Security' Boarding' In2Flight' Baggage' Claim'
  33. Check-In & Security Findings 36 The subm again Pr M

    K Base addit mod STAGE 2 - PROCE
  34. Check-In & Security Findings 37 Less than 1 Year 1

    to 2 Years Greater than 2 Years Unknown / MIN DATA COLLECTION ANALYSIS HISTORICAL DATA AVAILABLE FOR COLLECTION? COLLECTION FREQUENCY? REPORTING FREQUENCY? Hourly Daily Weekly Monthly Quarterly Semi-Annually Yearly Unknown / MIN Hourly Daily Weekly Monthly Quarterly Semi-Annually Yearly Unknown / MIN
  35. Check-In & Security Findings 38 PRELIMINARY KPI EVALUATION Yes No

    MIN Yes No MIN Yes No MIN DOES THE METRIC TRACK INPUT OR OUTPUT VALUES? DOES THE METRIC DESCRIBE AN ITS DIVISION GOAL? DOES THE METRIC CONNECT WITH THE ITS RINGS OF EXCELLENCE? OUTCOME ORIENTATION
  36. Boarding • Managers asked to revisit their previously submitted metrics

    (up to five [5]), in consultation with their supervisor(s). • Managers asked to complete up to five (5) submissions, responding to the following questions: • Please provide a short and long description of your metric for use on the LDAP- authentication-based web application. • Please document any formulas or calculations that should be made against your data. • What assumptions are currently made about this metric and/or about the data? • What constraints are currently made about this metric and/or about the data? • Detail any flaws with the current metric data that may impede calculation or display. • Identify the low and high expected values for the metric. • At this time managers will also identify whether a high value is a positive or a negative. • If you currently request information from a database, please have this information available during your one-on-one meeting with the metrics work group. Making' Reserva-ons' Check2In'&' Security' Boarding' In2Flight' Baggage' Claim'
  37. In-Flight • Managers asked to revisit their previously submitted metrics

    (up to five [5]), in consultation with their supervisor(s). • Managers will meet one-on-one with a member of the metrics work group to identify and establish the data source(s) for each metric. • Managers will identify how their data is used to calculate and interpret their metric. • Ongoing development will occur behind the scenes and no fur ther Wiki- based questions will be requested before a review of the requested metric(s) are provided. • Goals for this stage include working with data sources that are available and connected. • The metrics work group will begin using the [email protected] email account as a single point of contact for questions and correspondence. Making' Reserva-ons' Check2In'&' Security' Boarding' In2Flight' Baggage' Claim'
  38. Baggage Claim • Managers will identify a metric steward that

    will review the web charts and graphs for accuracy on a term identified by the metrics work group. • Managers will review, along with Metric Stewards,“completed” metric charts and descriptions on the test web environment and provide sign- off when ready for Director review. • Directors will provide final sign-off with VP/CIO of Information Technology Services to provide web-ready authorization. • Metric information will be released and available for LDAP authentication after documentation stored regarding approval. • Follow-up documentation and meetings scheduled with metric stewards. Making' Reserva-ons' Check2In'&' Security' Boarding' In2Flight' Baggage' Claim'
  39. Where are we now? • Started discussions and provided one-on-one

    guidance regarding metrics; • Healthy documentation on the project for future implementation; and • Currently “In-Flight” with our database programmer on the flight deck.
  40. Scorecard and Report Carding For more information visit: http://www.luc.edu/its/gov_home.shtml •

    An annual technology assessment based on the Rings of Excellence categories is conducted each November. • Subjective health ratings are assigned against a pre-defined healthy state. A net improvement of 9% was achieved in FY09 across all scorecards. is conducted each November. Subjective health ratings are assigned against a pre-defined healthy state. A net improvement of 9% was achieved in FY09 across all scorecards. Student Technology Support yields the healthiest rating, scoring 4.0 on a 5.0 scale. ▶ F ▶ S ▶ P ▶ S
  41. Recommendations and Lessons Learned • Persistence is vital! • Utilize

    a project management structure to coordinate the approvals and timeline; • Document... document... and document again, for sustainability and growth • Educate and Advocate Staff on Reasons Why -- Honestly • Ask why? why? why? why? • Listen closely and be prepared to address staff fears • Flexibility is key!
  42. Introduction to CEITPS Consortium for the Establishment of Information Technology

    Performance Standards • The Consortium for the Establishment of Information Technology Performance Standards (CEITPS) was founded to develop standards for measuring the performance of Information Technology (IT) organizations and the value/quality of the IT services and products within Higher Education. http://www.ceitps.org
  43. • What did you think about this session? • Your

    input is important to us! • Click on “Evaluate This Session” on the conference program page. IT Metrics Martin Klubeck, University of Notre Dame Adam Smeets, Loyola University Chicago November 4, 2009