$30 off During Our Annual Pro Sale. View Details »

An Investigation into the Correlation between a Country's Total Olympic Medal Count, GDP, and Freedom Index through History

An Investigation into the Correlation between a Country's Total Olympic Medal Count, GDP, and Freedom Index through History

https://aaron.kr/content/portfolio/does-a-countrys-freedom-index-affect-its-olympic-medal-count/

Poster presentation at The 50th Fall Comprehensive Conference of the Korea Information and Communication Society (KIICE) (제50회 한국정보통신학회 추계종합학술대회).

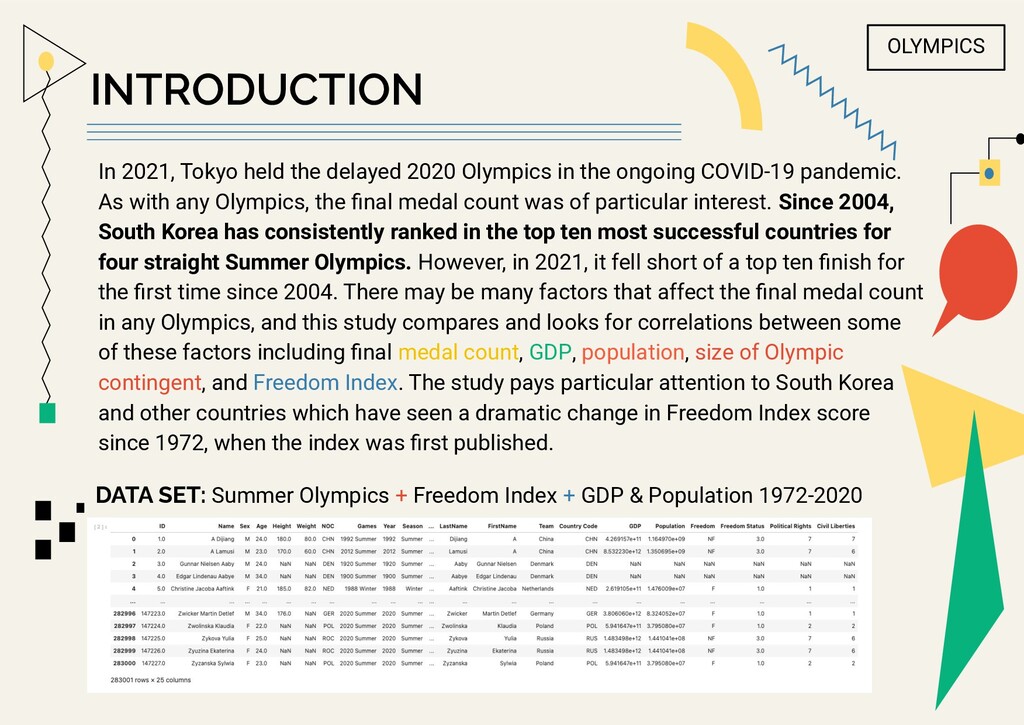
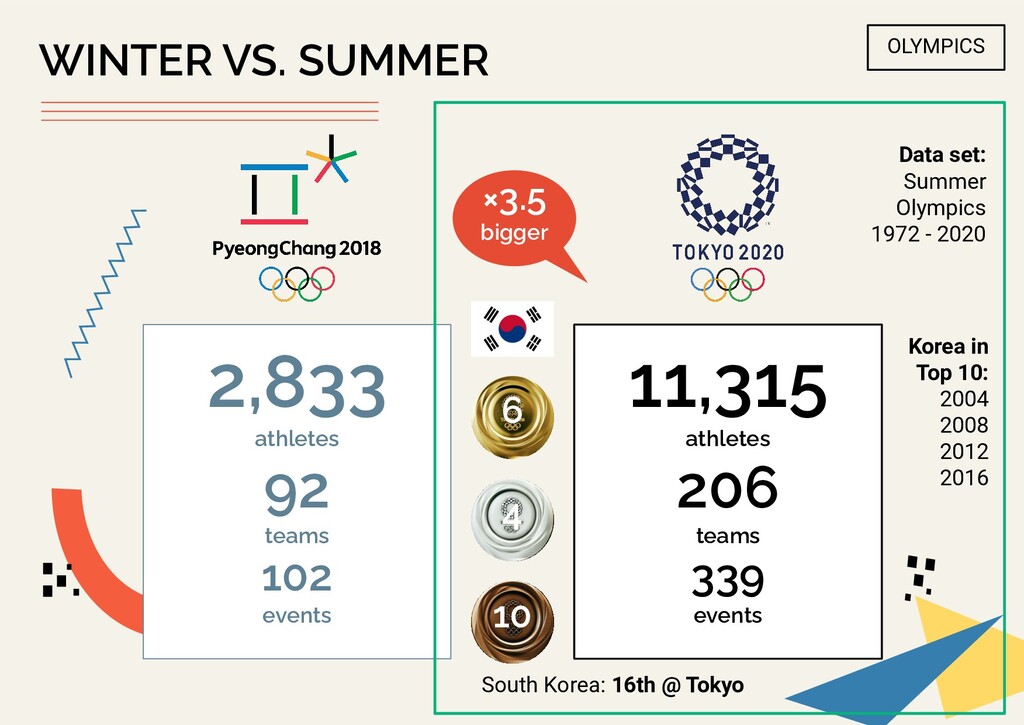
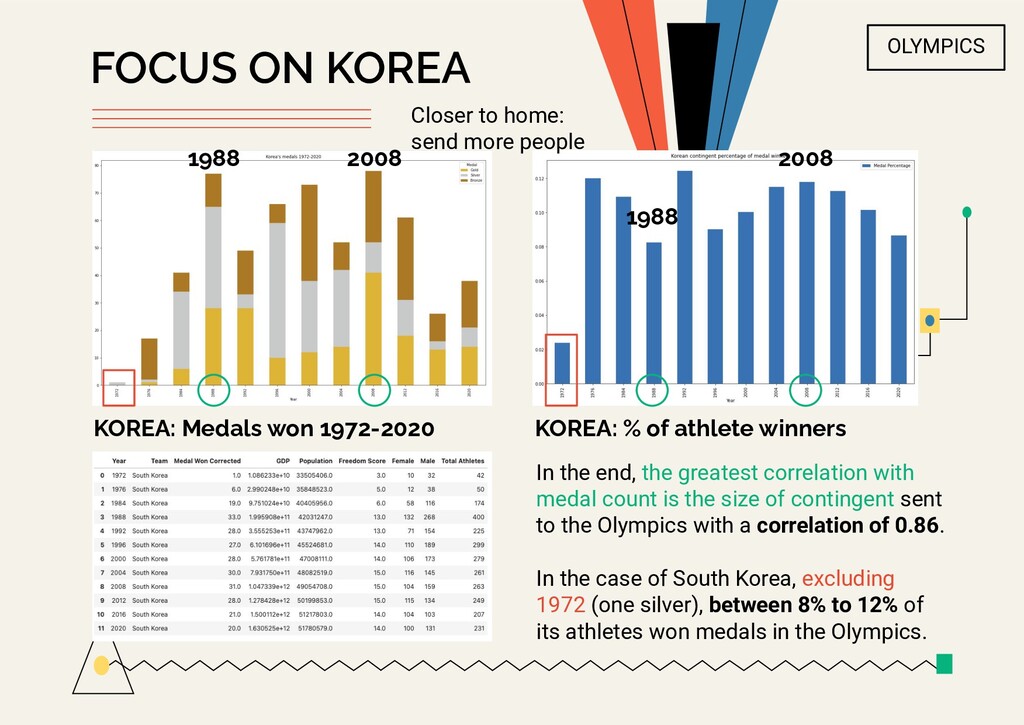
In the 2020 Olympics, South Korea fell short of a top ten finish in the medal count for the first time since 2004 (at 16th place). Although there are no "official" medal tables, and gold medal count is prioritized over other medal wins, I was curious if a country's Freedom Index (particularly Civil Liberties and Political Rights) played any role in the number of medals a country could be expected to win.

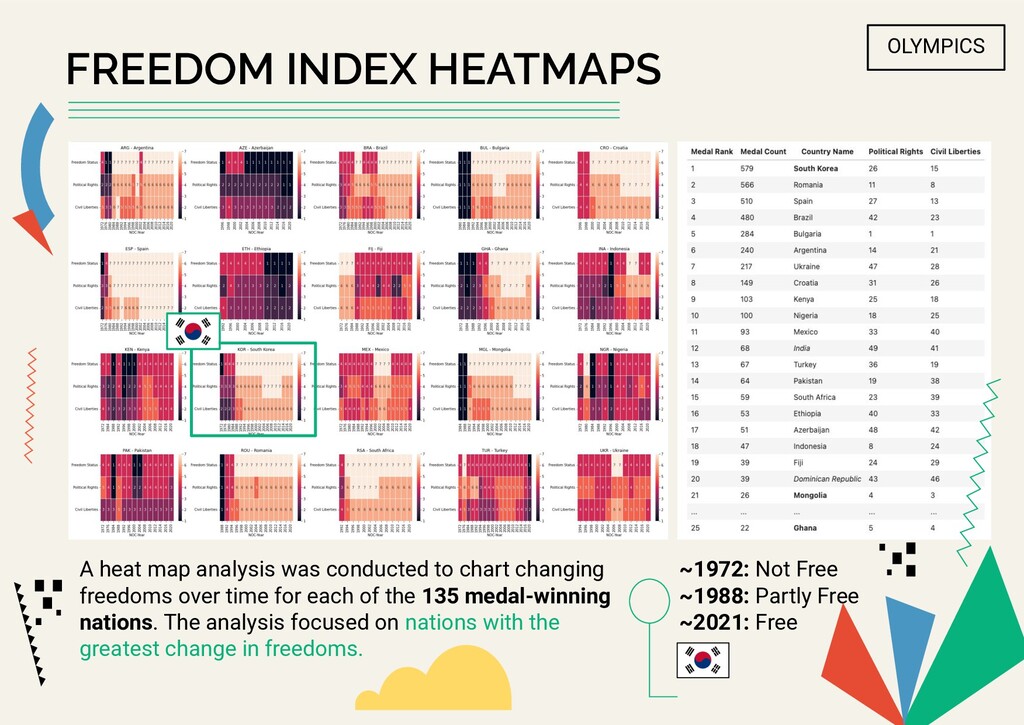
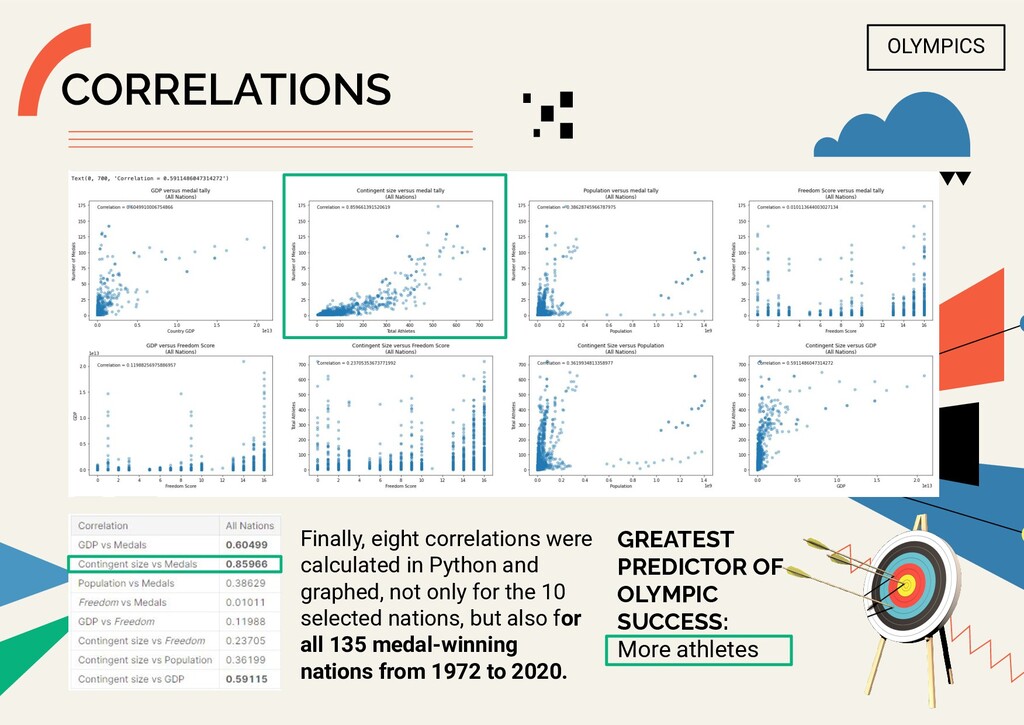
Therefore, this study investigates the change in Freedom Index among 135 medal-winning countries, and the correlation between medal wins, freedom, contingent size, GDP, and population from 1972 (when the Freedom Index data was first published) to the most recent 2020 Tokyo Olympics (held in 2021).

Aaron Snowberger

October 28, 2021
Tweet

More Decks by Aaron Snowberger

Other Decks in Science

Transcript

  1. Aaron Daniel Snowberger,
    Choong Ho Lee
    An Investigation into the Correlation
    between a Country's Total Olympic
    Medal Count, GDP, and Freedom Index
    through History
    OLYMPICS
    Bolt~

    View Slide

  2. OLYMPICS
    INTRODUCTION
    In 2021, Tokyo held the delayed 2020 Olympics in the ongoing COVID-19 pandemic.
    As with any Olympics, the final medal count was of particular interest. Since 2004,
    South Korea has consistently ranked in the top ten most successful countries for
    four straight Summer Olympics. However, in 2021, it fell short of a top ten finish for
    the first time since 2004. There may be many factors that affect the final medal count
    in any Olympics, and this study compares and looks for correlations between some
    of these factors including final medal count, GDP, population, size of Olympic
    contingent, and Freedom Index. The study pays particular attention to South Korea
    and other countries which have seen a dramatic change in Freedom Index score
    since 1972, when the index was first published.
    DATA SET: Summer Olympics + Freedom Index + GDP & Population 1972-2020

    View Slide

  3. 2,833
    athletes
    92
    teams
    102
    events
    OLYMPICS
    WINTER VS. SUMMER
    Data set:
    Summer
    Olympics
    1972 - 2020
    11,315
    athletes
    206
    teams
    339
    events
    ×3.5
    bigger
    6
    4
    10
    South Korea: 16th @ Tokyo
    Korea in
    Top 10:
    2004
    2008
    2012
    2016

    View Slide

  4. OLYMPICS
    FREEDOM INDEX HEATMAPS
    A heat map analysis was conducted to chart changing
    freedoms over time for each of the 135 medal-winning
    nations. The analysis focused on nations with the
    greatest change in freedoms.
    ~1972: Not Free
    ~1988: Partly Free
    ~2021: Free

    View Slide

  5. OLYMPICS
    TOP FREEDOM-CHANGING
    MEDAL-WINNING COUNTRIES
    Of these, the top ten were more closely
    analyzed in terms of medal tally, freedoms,
    GDP growth, population, and contingent size.
    Varying scales were used in order to aid
    visualization and check for trends.

    View Slide

  6. OLYMPICS
    CORRELATIONS
    GREATEST
    PREDICTOR OF
    OLYMPIC
    SUCCESS:
    More athletes
    Finally, eight correlations were
    calculated in Python and
    graphed, not only for the 10
    selected nations, but also for
    all 135 medal-winning
    nations from 1972 to 2020.

    View Slide

  7. OLYMPICS
    FOCUS ON KOREA
    In the end, the greatest correlation with
    medal count is the size of contingent sent
    to the Olympics with a correlation of 0.86.
    In the case of South Korea, excluding
    1972 (one silver), between 8% to 12% of
    its athletes won medals in the Olympics.
    KOREA: Medals won 1972-2020 KOREA: % of athlete winners
    1988 2008
    1988
    2008
    Closer to home:
    send more people

    View Slide

  8. OLYMPICS
    CONCLUSION
    This study focused on a variety of correlations that may influence a nation’s total
    Summer Olympic medal count, including Freedom Index, GDP, population, and
    contingent size. But it did not account for additional influencing factors such as
    “home team advantage” for the hosting country, nor what effect a country’s previous
    Olympic performance may have on future results. This study also does not consider
    medal wins at the Winter Olympics. Additionally, while a special focus was placed on
    South Korea, and it was found that between 8% to 12% of its athletes have won
    medals at each Summer Olympics since 1976, the same will not be true for every
    country, particularly those that have never won a single medal.
    Therefore, further research with different methods, such as Data Envelopment
    Analysis (DEA) which has often been used for Olympics research may provide
    additional insights.
    Credits: This presentation template was
    created by Slidesgo, including icons by Flaticon,
    and infographics & images by Freepik.

    View Slide

  9. [1] International Olympic Committee. Olympic Games: Tokyo 2020. [Internet]. Available:
    https://olympics.com/en/olympic-games/tokyo-2020
    [2] International Olympic Committee. Olympic Games: Pyeongchang 2018. [Internet]. Available:
    https://olympics.com/en/olympic-games/pyeongchang-2018
    [3] L. Churilov, A. Flitman. Towards fair ranking of Olympics achievements: the case of Sydney 2000.
    Computers and Operations Research, Vol. 33 pp. 2057-2082. Nov 6, 2004.
    [4] Xiyang Lei, Yongjun Li, Qiwei Xie, Liang Liang. Measuring Olympics achievements based on parallel
    DEA approach. Annals of Operations Research, Vol. 226 pp. 379-396. Sept 21, 2014.
    [5] S. Lozano, G. Villa, F. Guerrero, and P. Cortes. Measuring the performance of nations at the
    Summer Olympics using data envelopment analysis. Journal of the Operational Research Society, Vol.
    53 pp. 501-511. 2002.
    [6] Randi H Griffin. 120 Years of Olympic History: Athletes and Results. Kaggle Dataset. June 15, 2018.
    [Internet]. Available:
    https://www.kaggle.com/heesoo37/120-years-of-olympic-history-athletes-and-results/activity
    [7] Petro Ivaniuk. Tokyo 2020 Olympics. Kaggle Dataset. Aug 31, 2021. [Internet]. Available:
    https://www.kaggle.com/piterfm/tokyo-2020-olympics
    [8] The World Bank. GDP (current $US) | Data. The World Bank 2020. [Internet]. Available:
    https://data.worldbank.org/indicator/NY.GDP.MKTP.CD
    [9] The World Bank. Population, total | Data. The World Bank 2020. [Internet]. Available:
    https://data.worldbank.org/indicator/SP.POP.TOTL
    [10] Freedom House. Freedom in the World. Freedom House 2020. [Internet]. Available:
    https://freedomhouse.org/report/freedom-world
    OLYMPICS
    REFERENCES

    View Slide