Upgrade to Pro — share decks privately, control downloads, hide ads and more …

ABCS26: DevOps in Azure: Why Alert Emails are n...

Sponsored · Your Podcast. Everywhere. Effortlessly. Share. Educate. Inspire. Entertain. You do you. We'll handle the rest.

ABCS26: DevOps in Azure: Why Alert Emails are not a Monitoring Strategy by Alexander Sameli & Daniel Steinmann

⭐️ DevOps in Azure: Why Alert Emails are not a Monitoring Strategy#
With 24/7 enterprise cloud applications, the Ops part of DevOps is our top priority. We will walk you through our transformation from inbox-driven incident management to a scalable monitoring and alerting solution. We share the failures and pitfalls we encountered, and how we now leverage Azure’s monitoring capabilities to detect issues earlier, respond faster, and operate with minimal noise.
🙂 ALEXANDER SAMELI ⚡️ Cloud Platform Engineer @ Maison du Software
🙂 DANIEL STEINMANN ⚡️ Cloud Platform Engineer @ Maison du Software

More Decks by Azure Zurich User Group

Other Decks in Technology

Transcript

  1. 1 Why alert emails are not a monitoring strategy Daniel

    Steinmann & Alex Sameli 21.05.2026
  2. 2 Managed Service Provider in the logistics industry Our technology

    stack: − C# / .NET / Angular − Microsoft SQL Server − Microsoft Azure − Terraform / Terragrunt
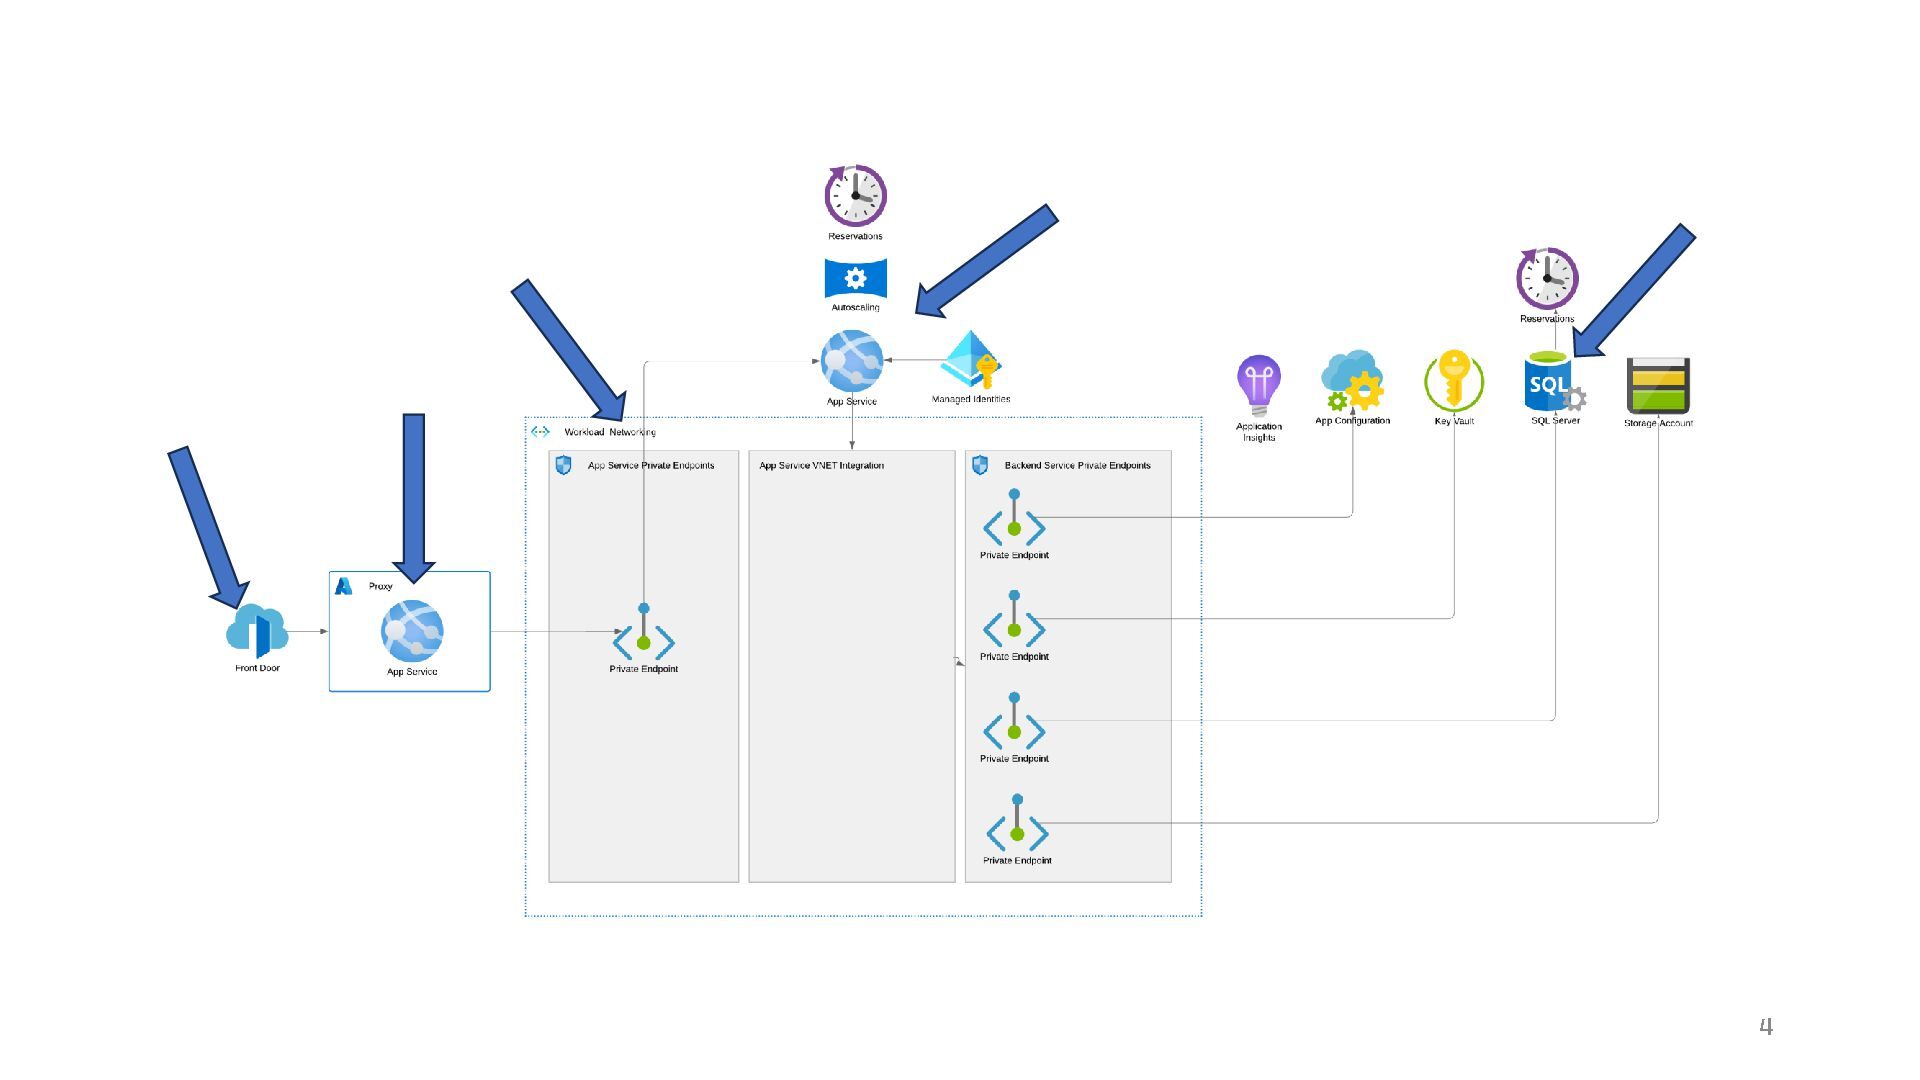
  3. 3 Our Azure infrastructure - PaaS only - 4 environments

    (DEV, AT, UAT, PROD) - Geo- redundant, globally load - balanced workloads
  4. 4

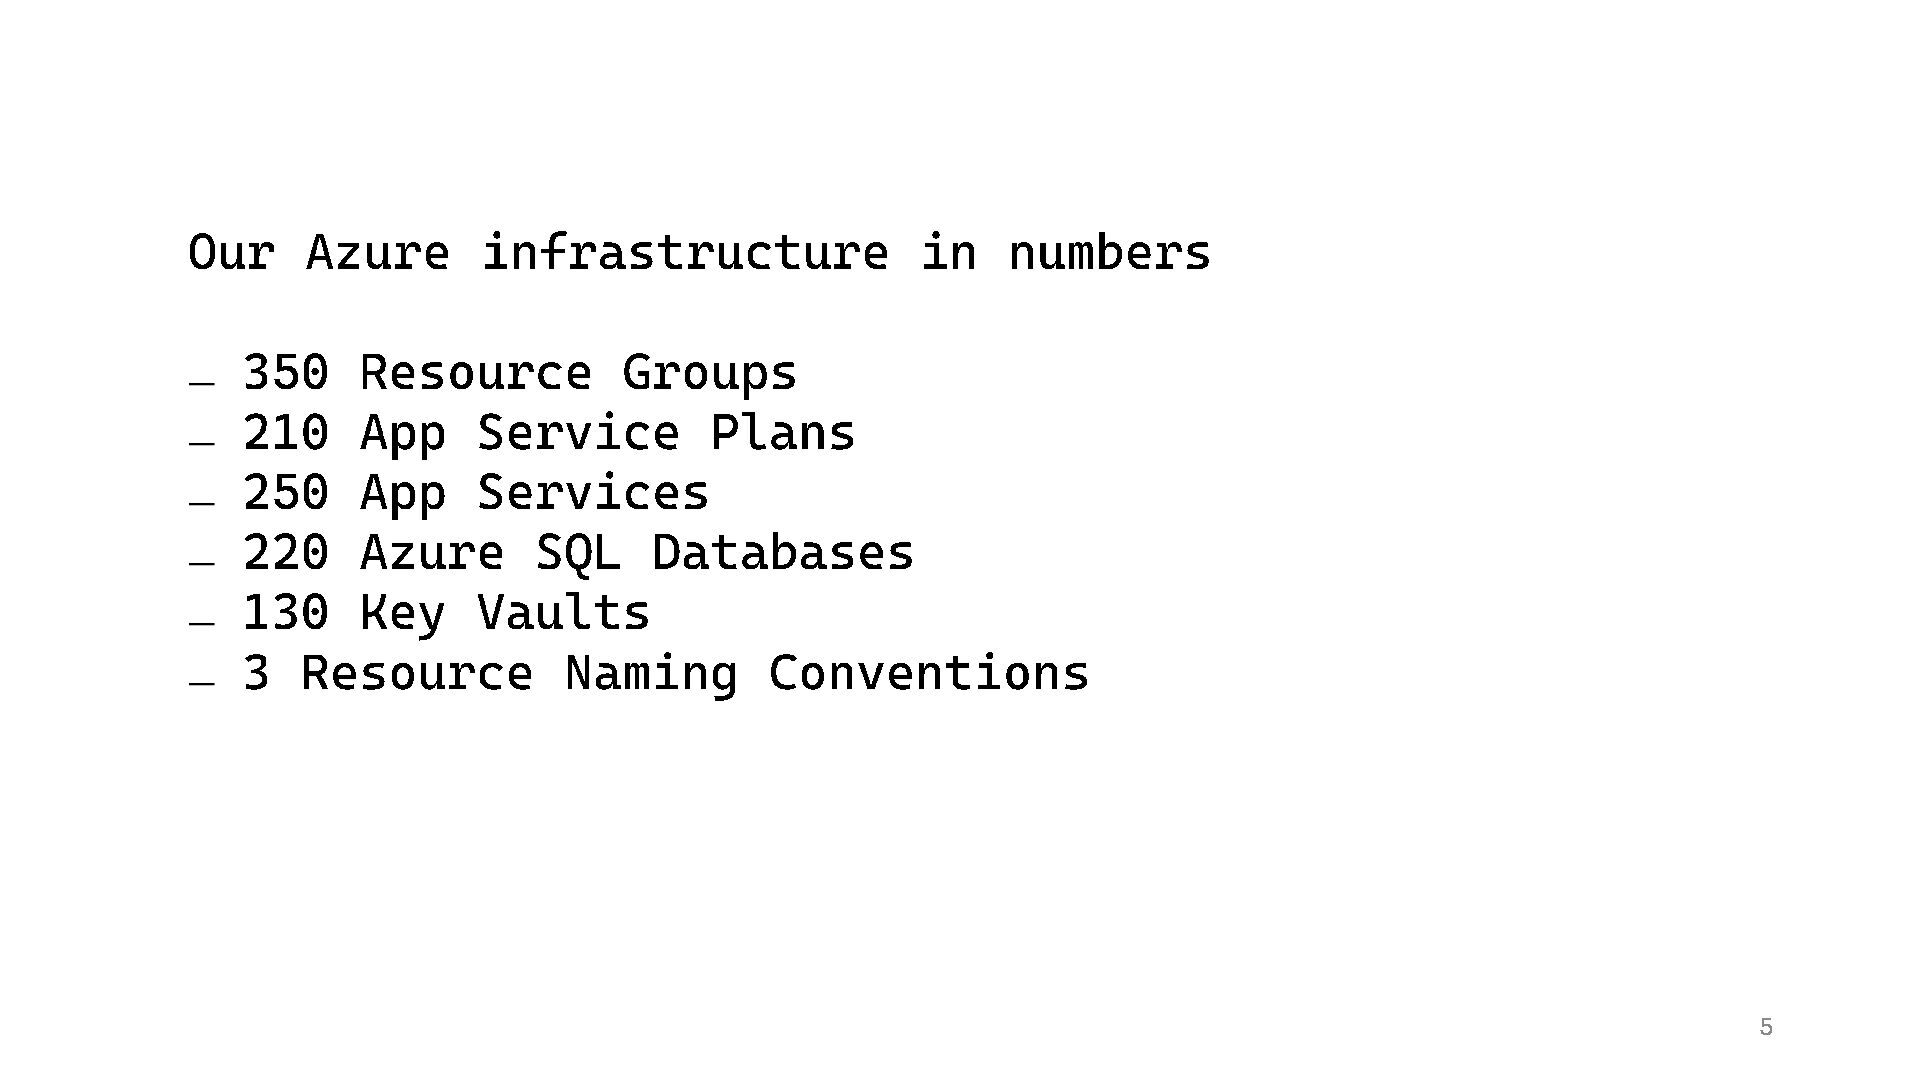
  5. 5 Our Azure infrastructure in numbers − 350 Resource Groups

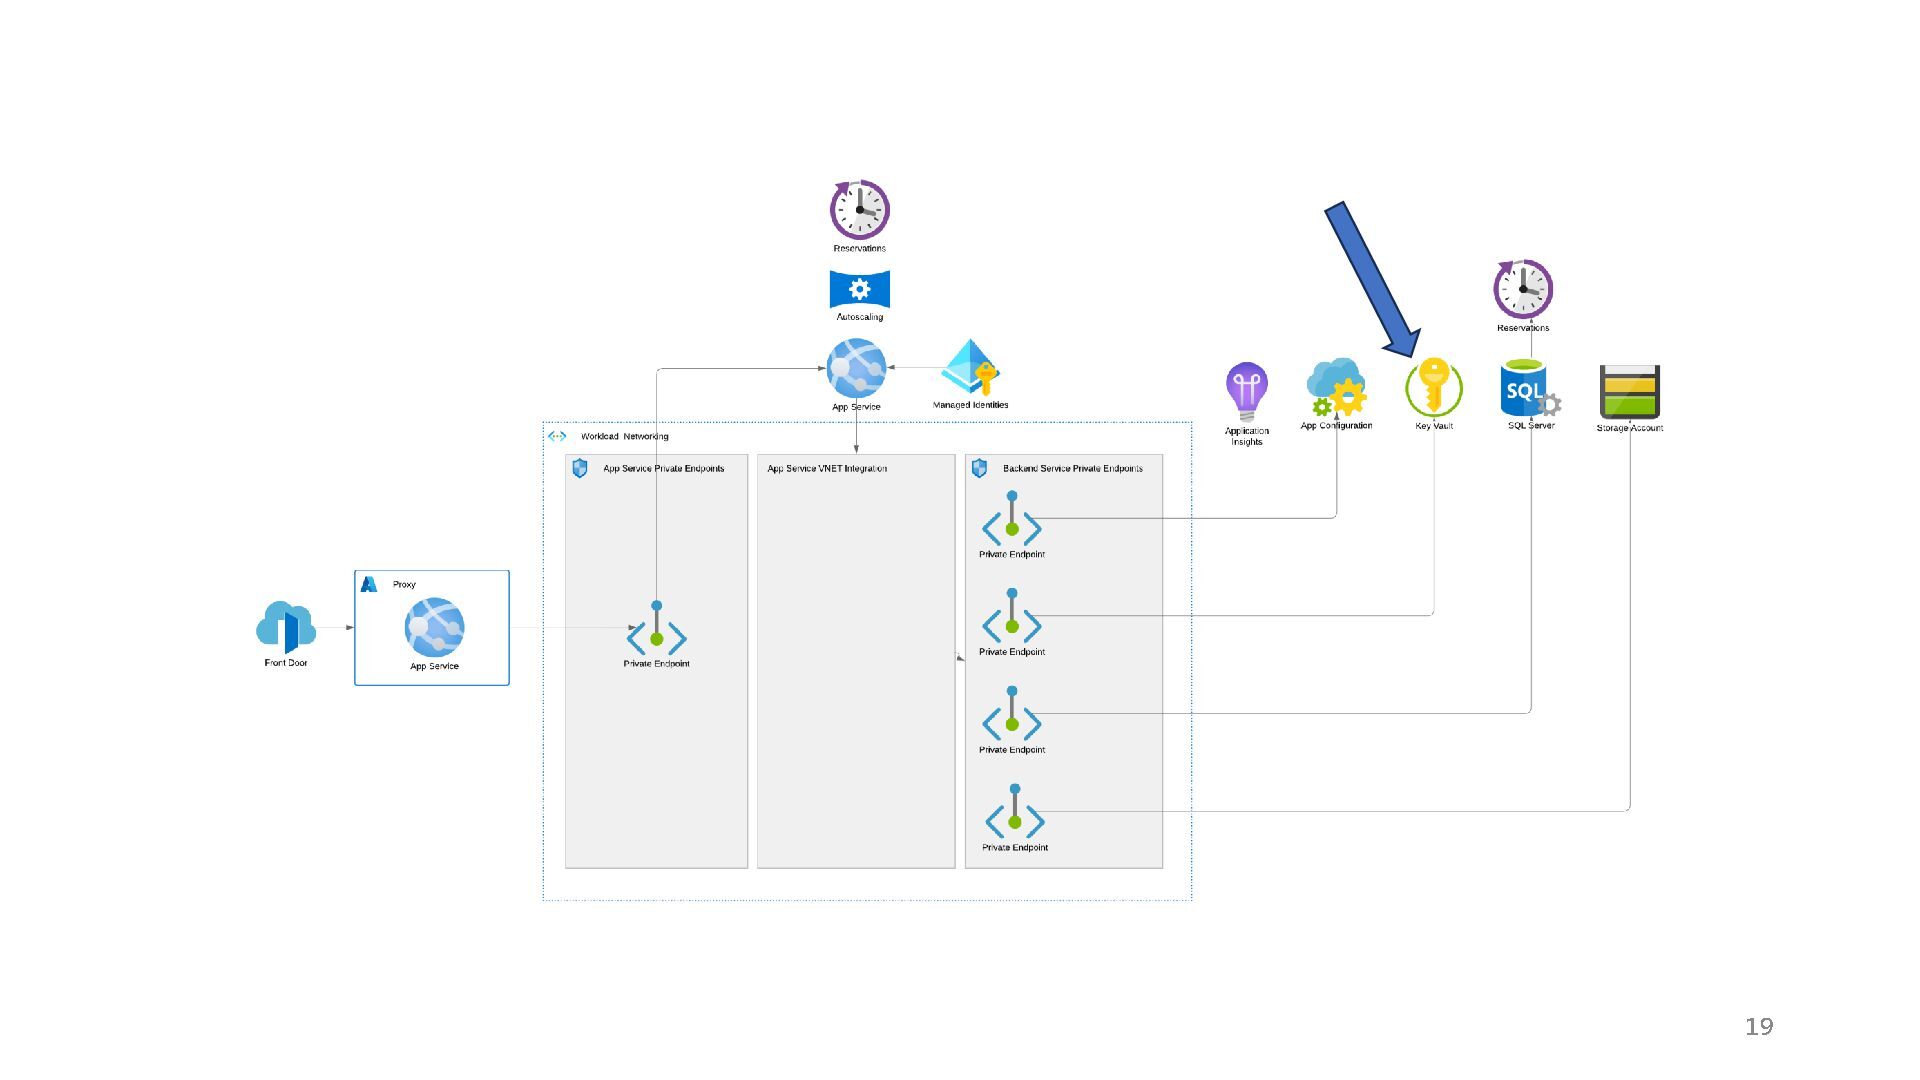
    − 210 App Service Plans − 250 App Services − 220 Azure SQL Databases − 130 Key Vaults − 3 Resource Naming Conventions
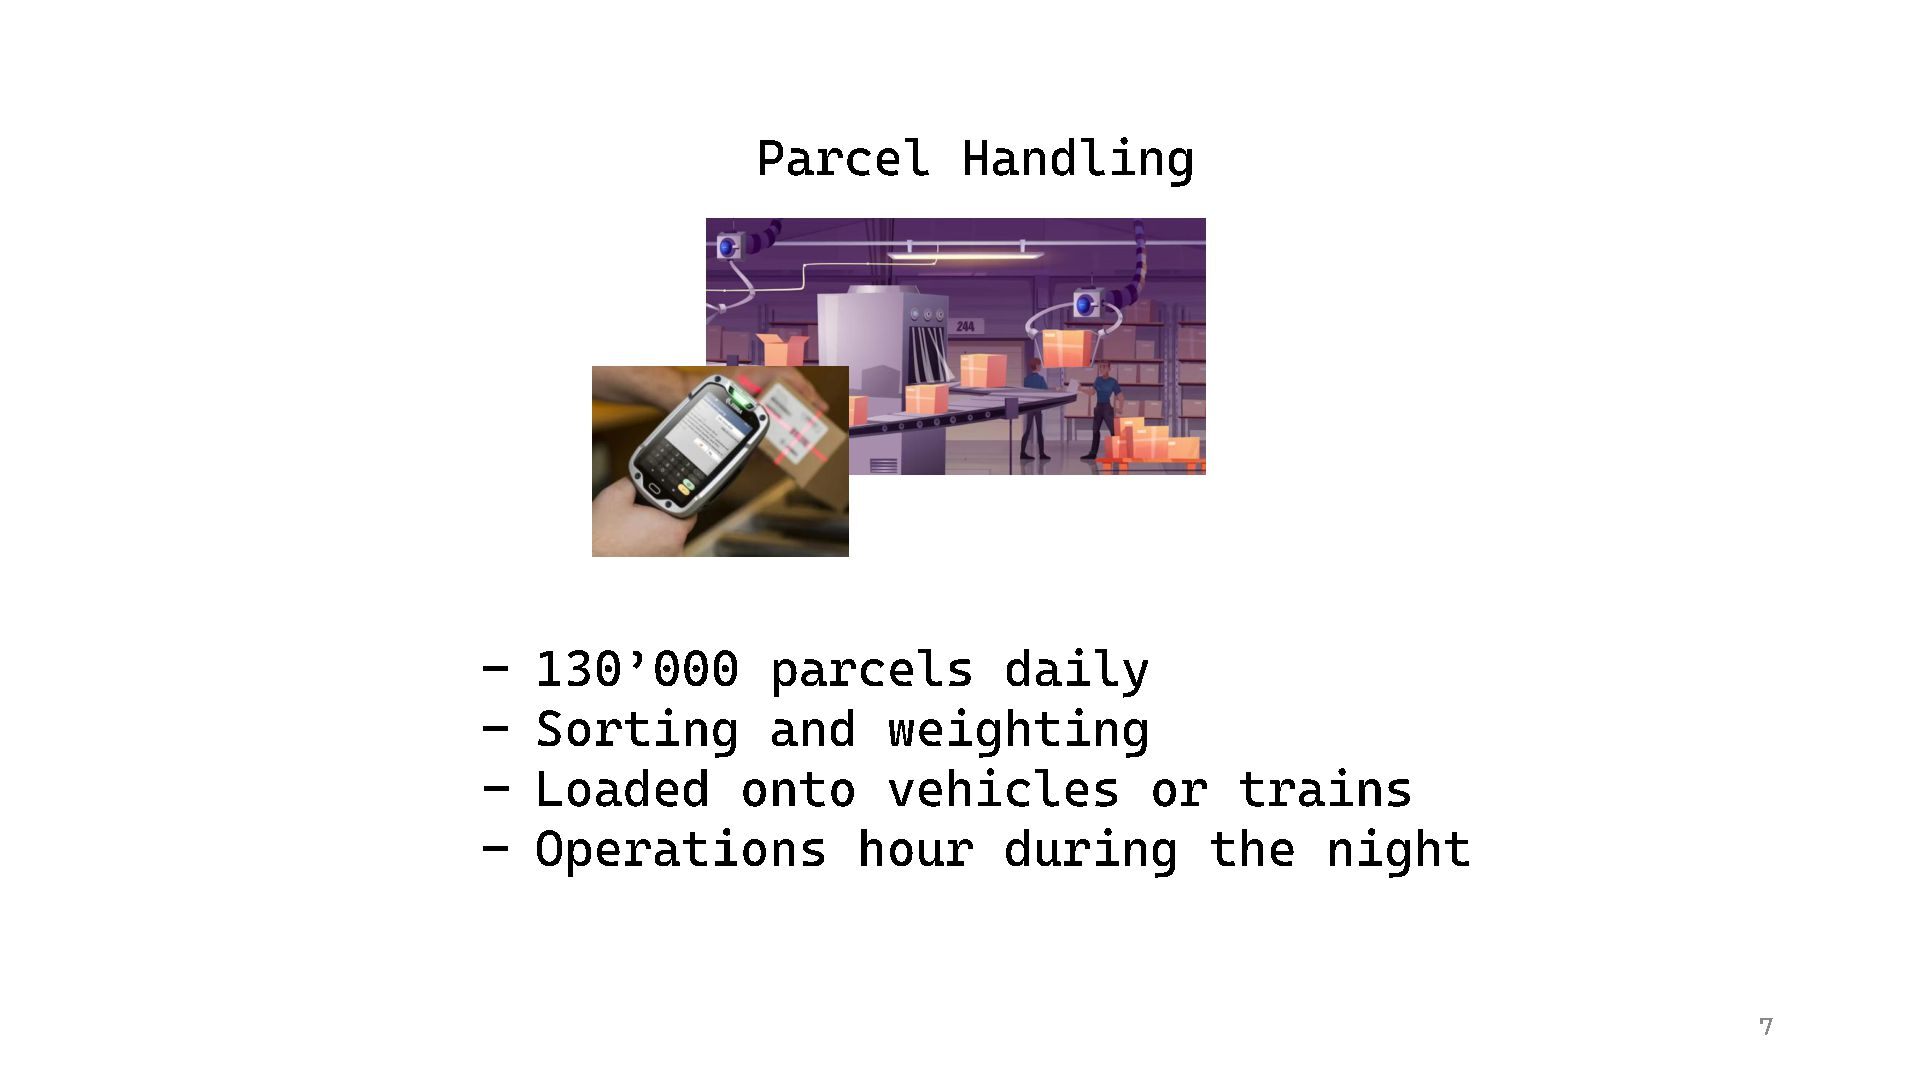
  6. 7 Parcel Handling - 130’000 parcels daily - Sorting and

    weighting - Loaded onto vehicles or trains - Operations hour during the night
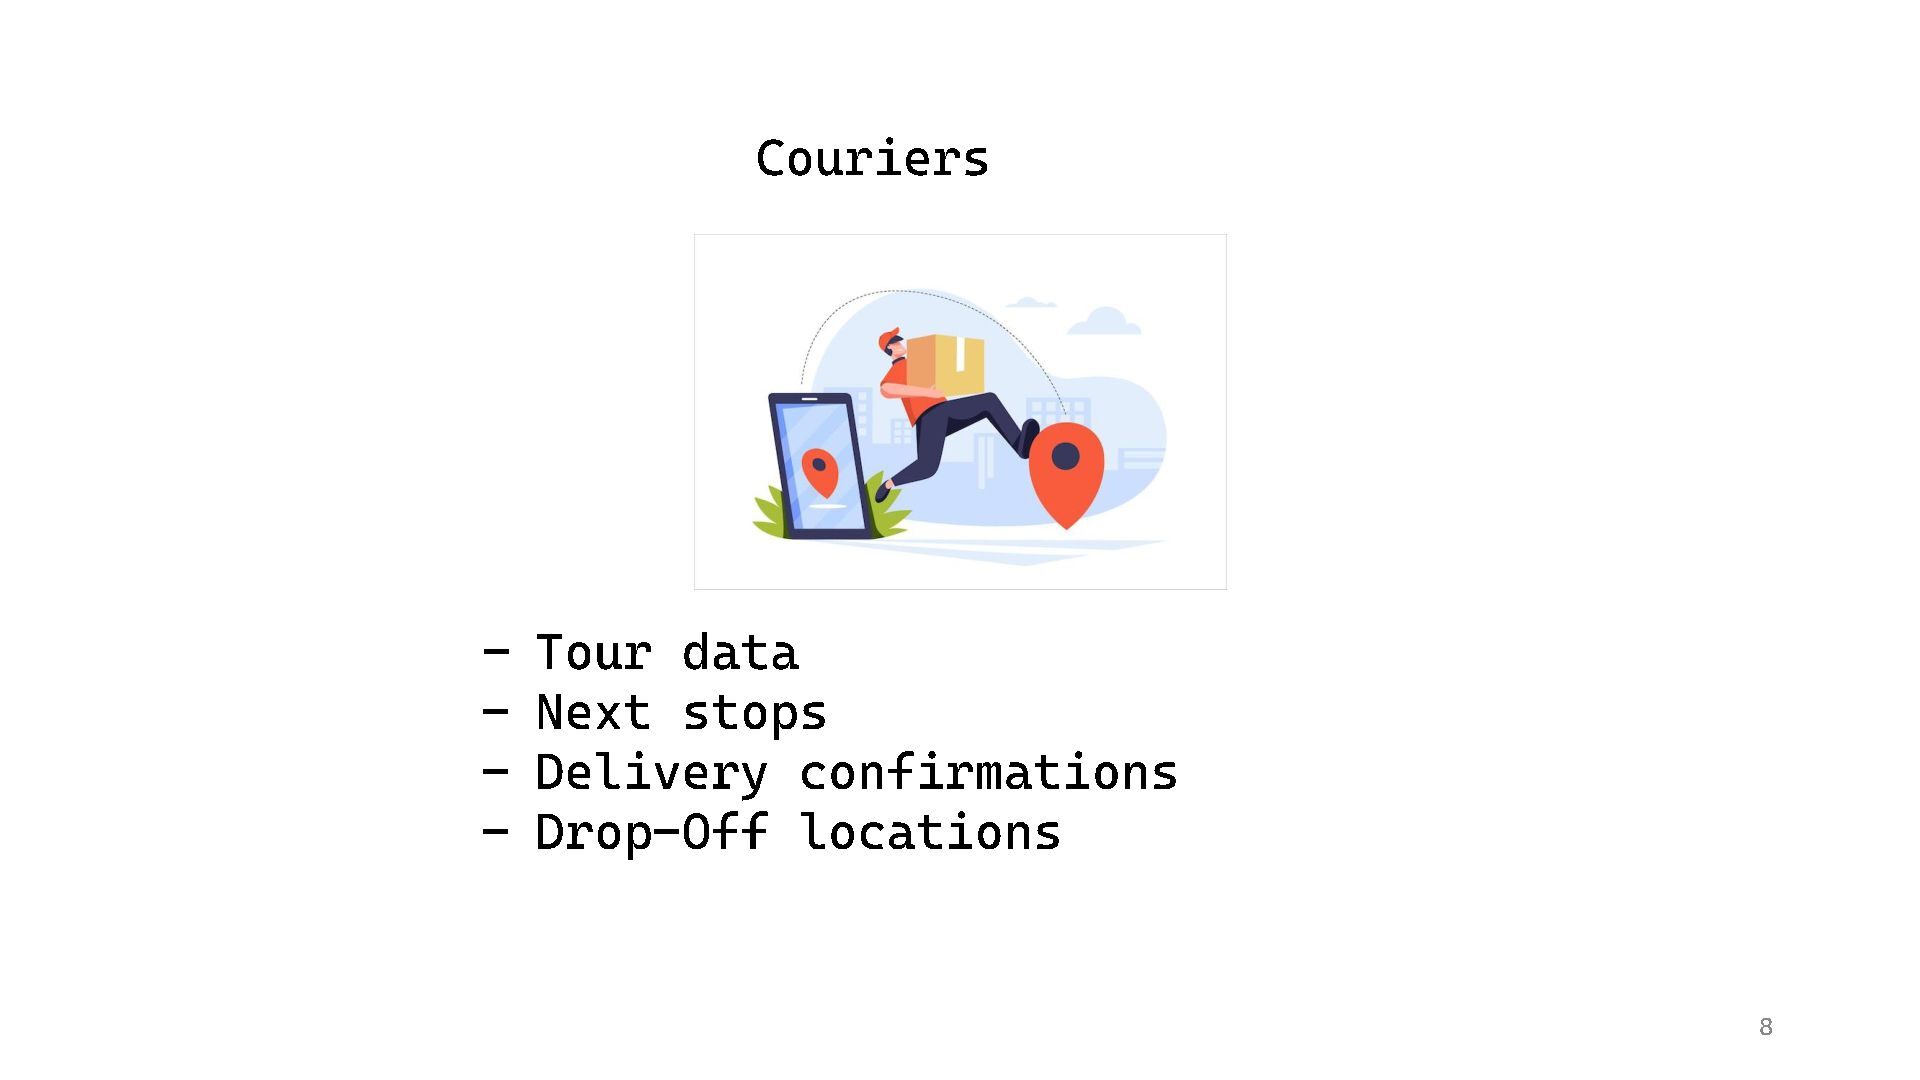
  7. 8 Couriers - Tour data - Next stops - Delivery

    confirmations - Drop - Off locations
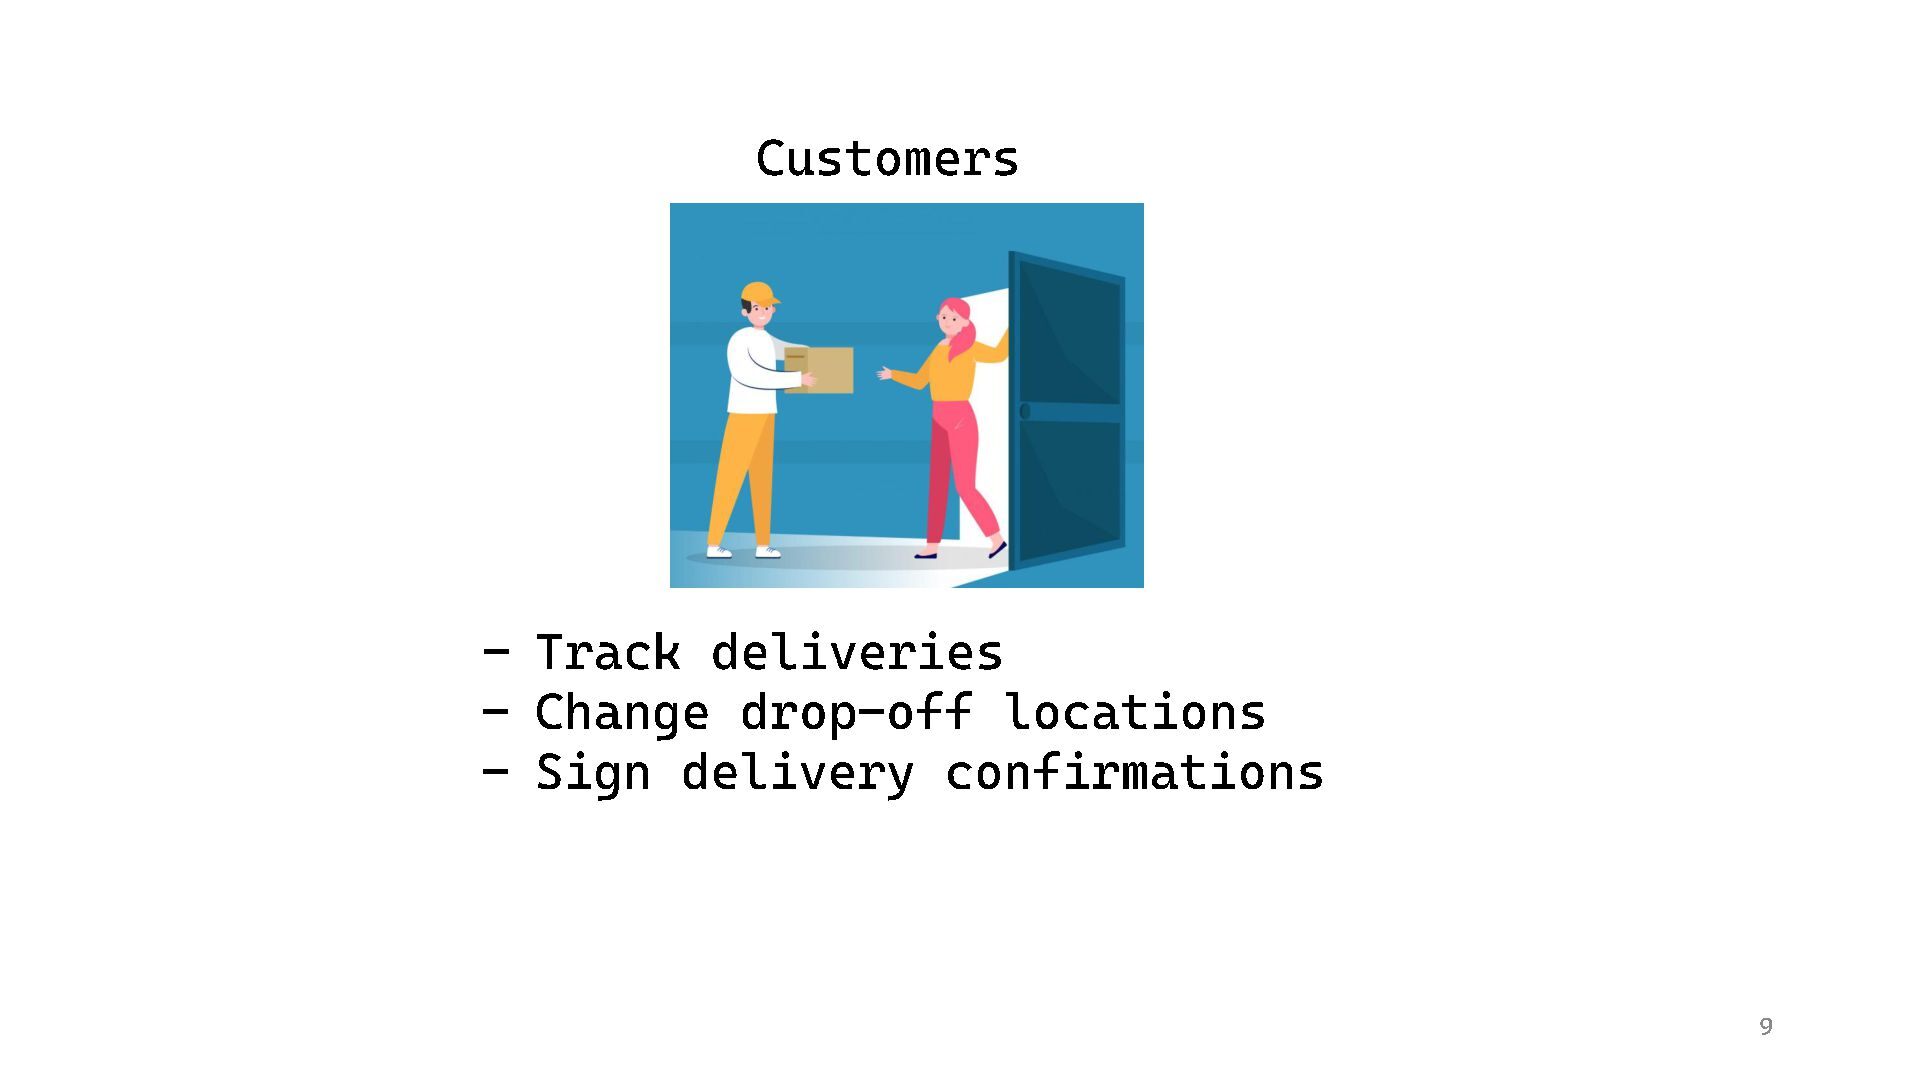
  8. 9 Customers - Track deliveries - Change drop - off

    locations - Sign delivery confirmations
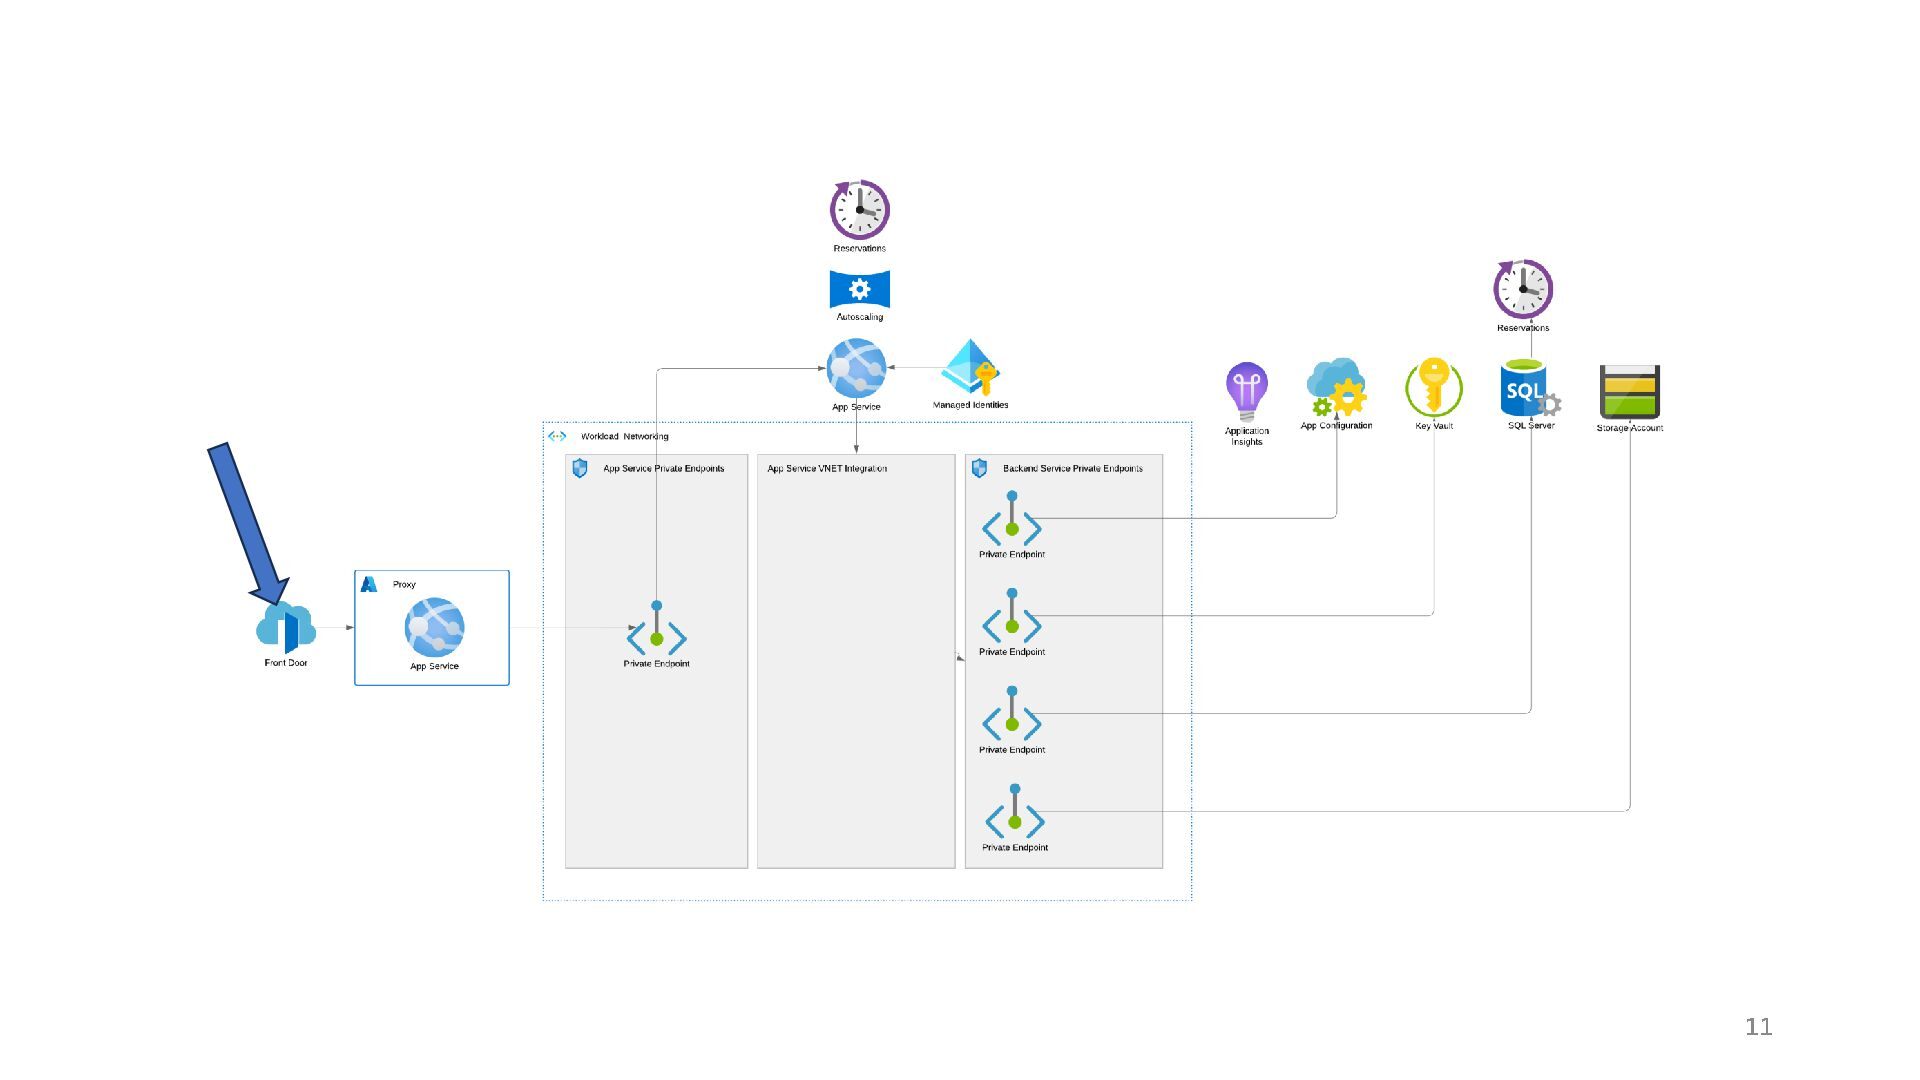
  9. 11

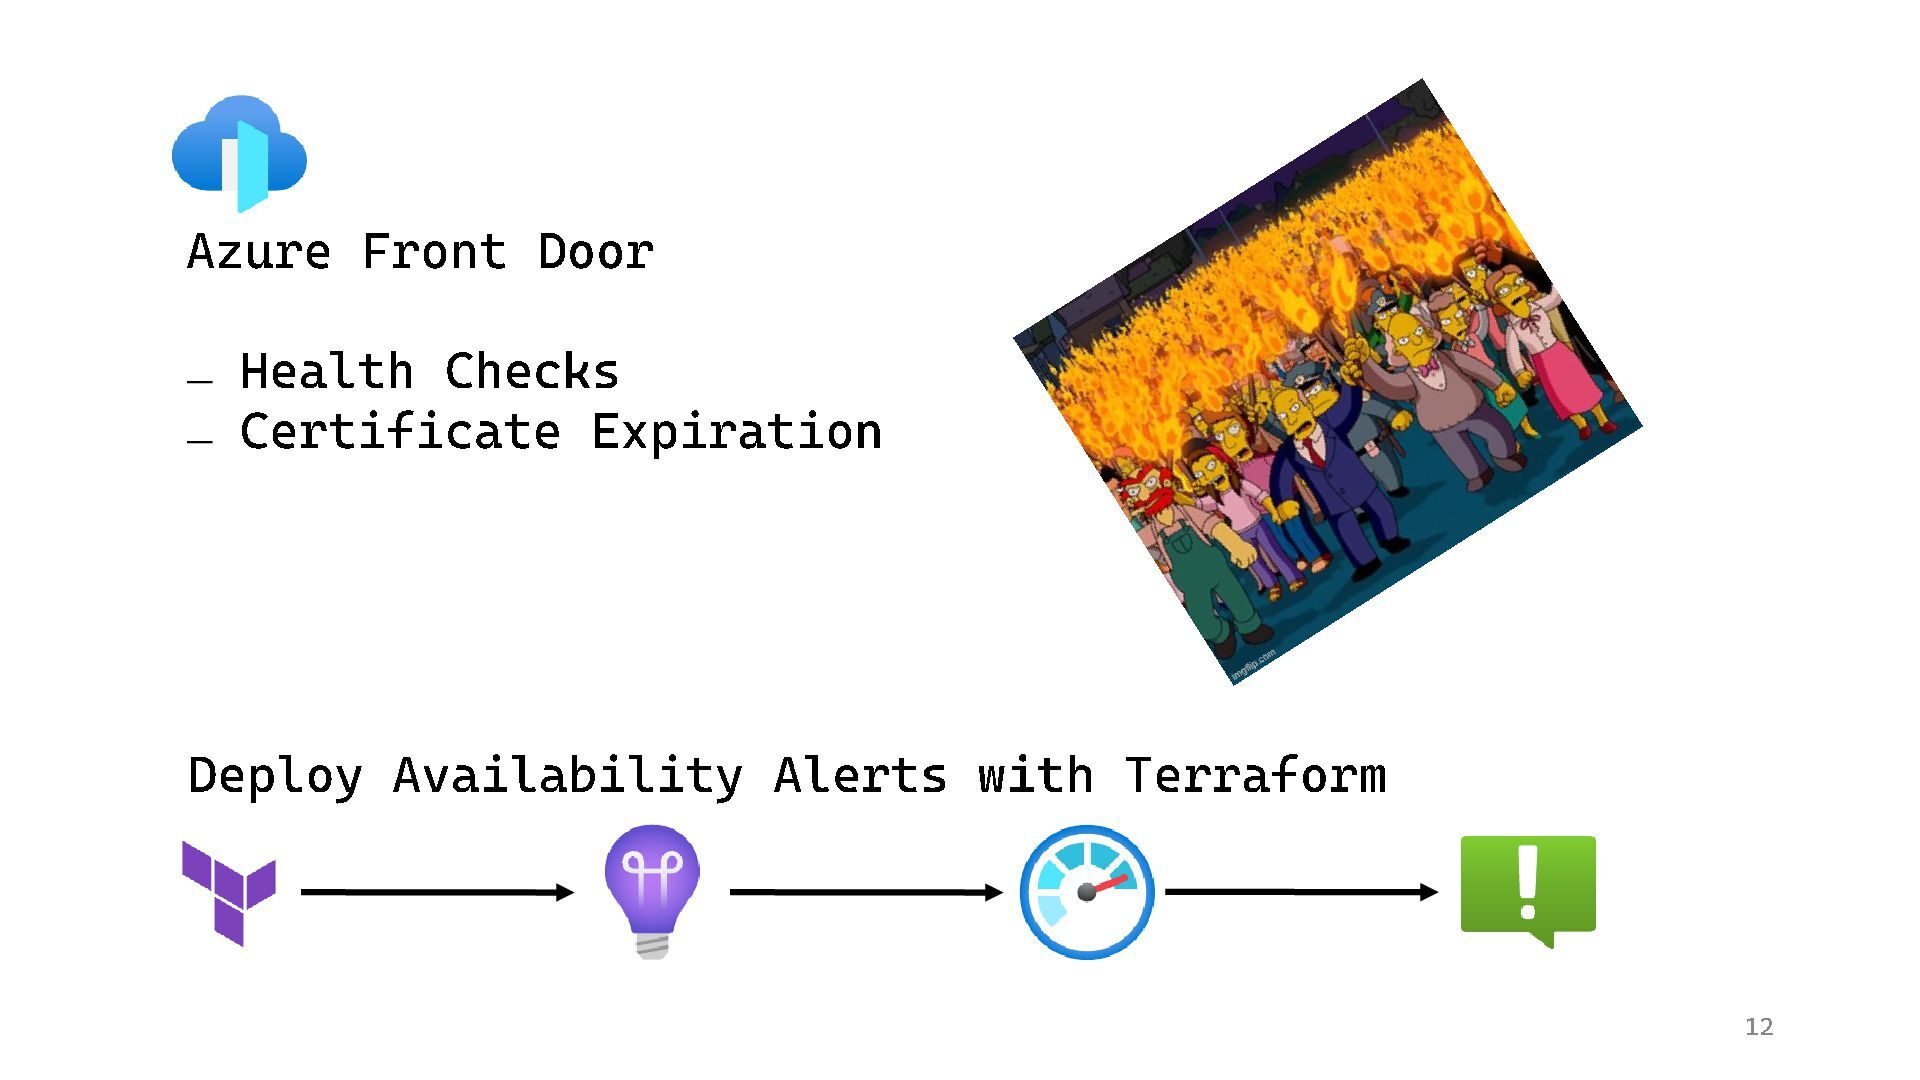
  10. Azure Front Door − Health Checks − Certificate Expiration 12

    Deploy Availability Alerts with Terraform
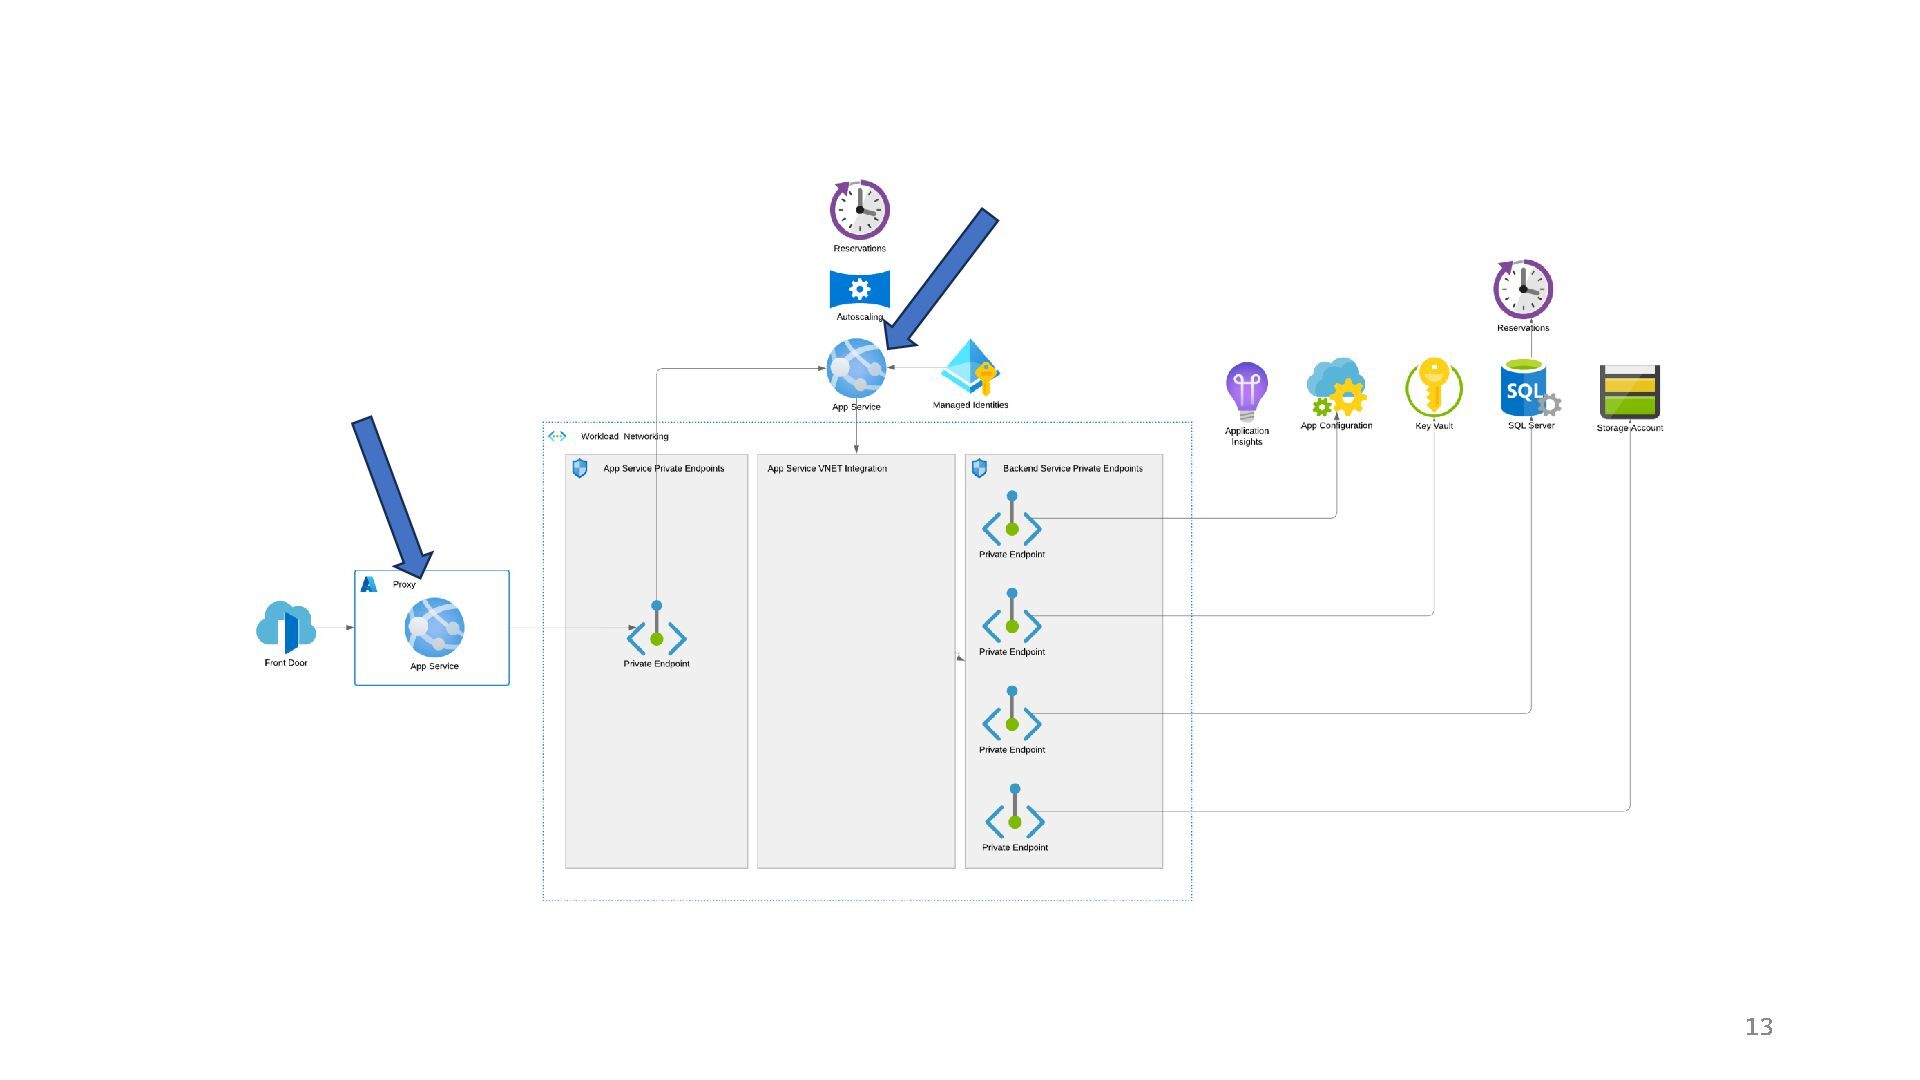
  11. 13

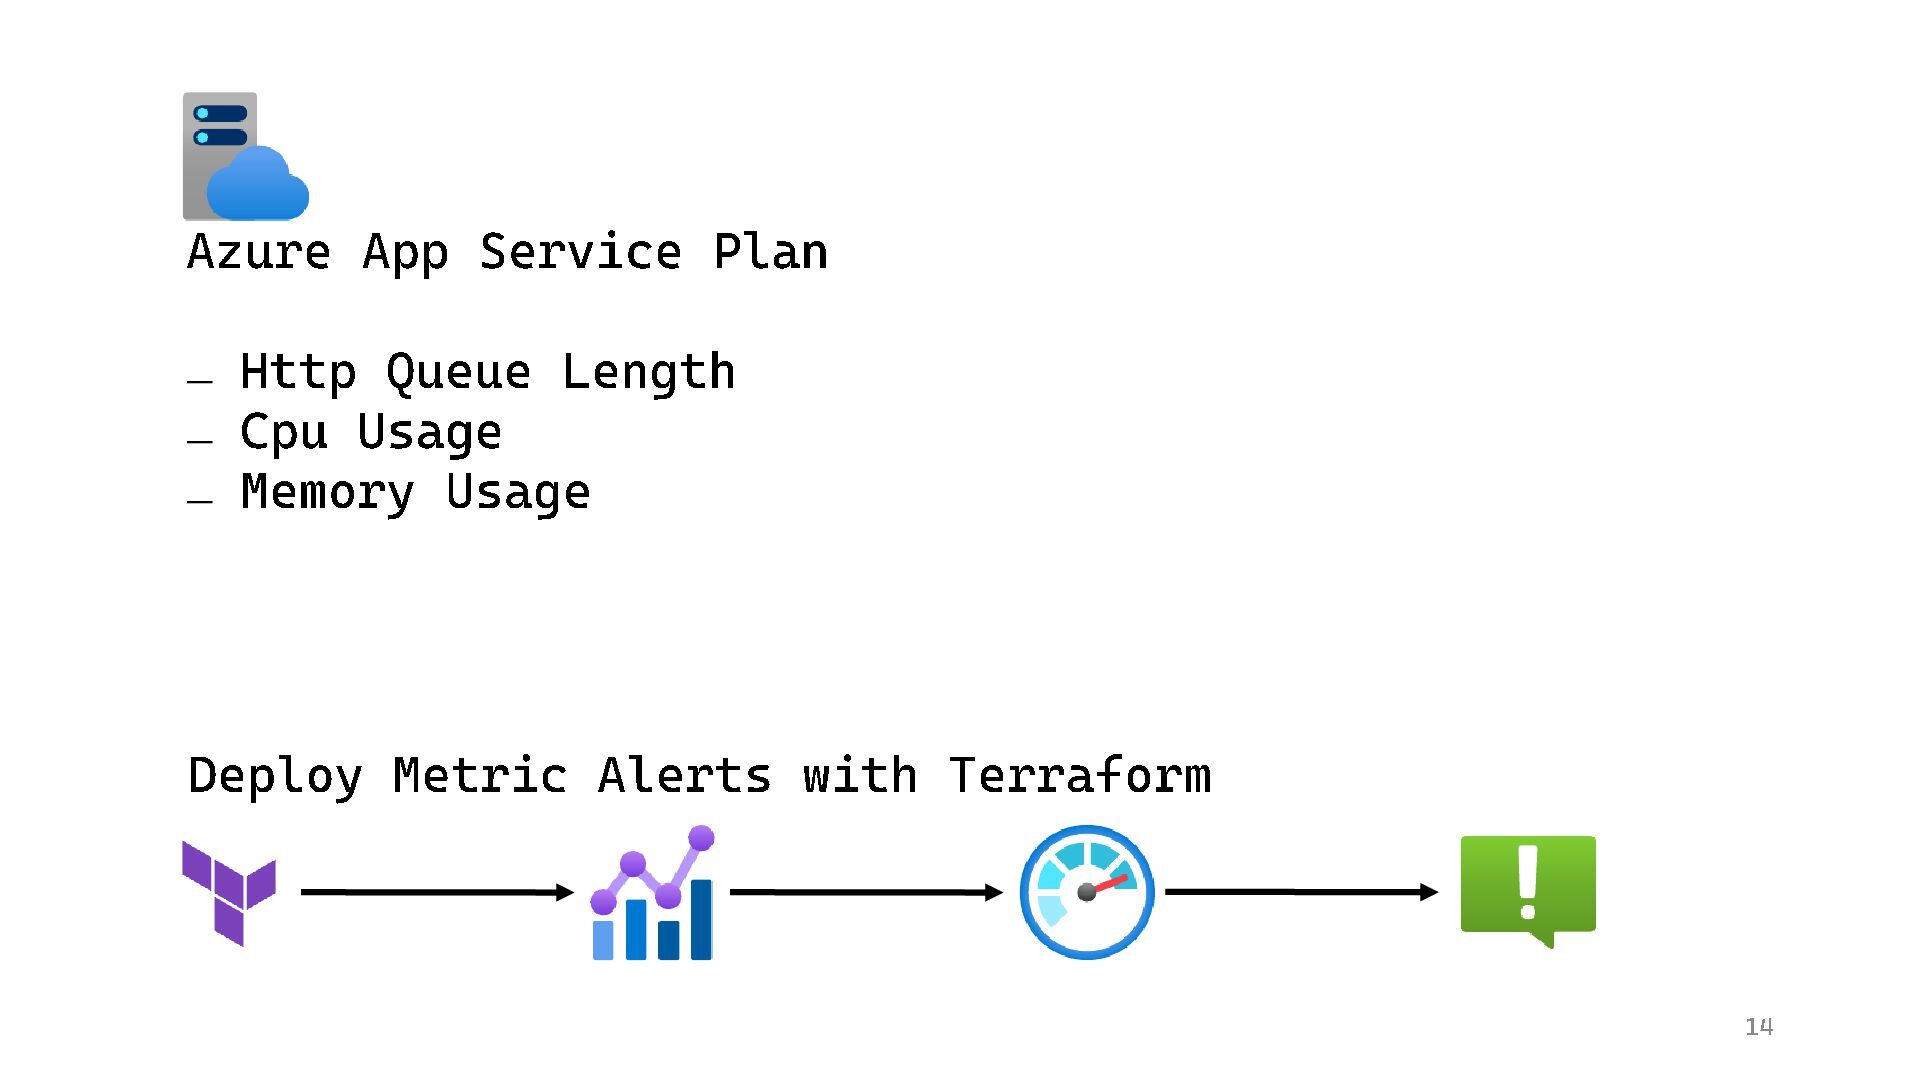
  12. Azure App Service Plan − Http Queue Length − Cpu

    Usage − Memory Usage 14 Deploy Metric Alerts with Terraform
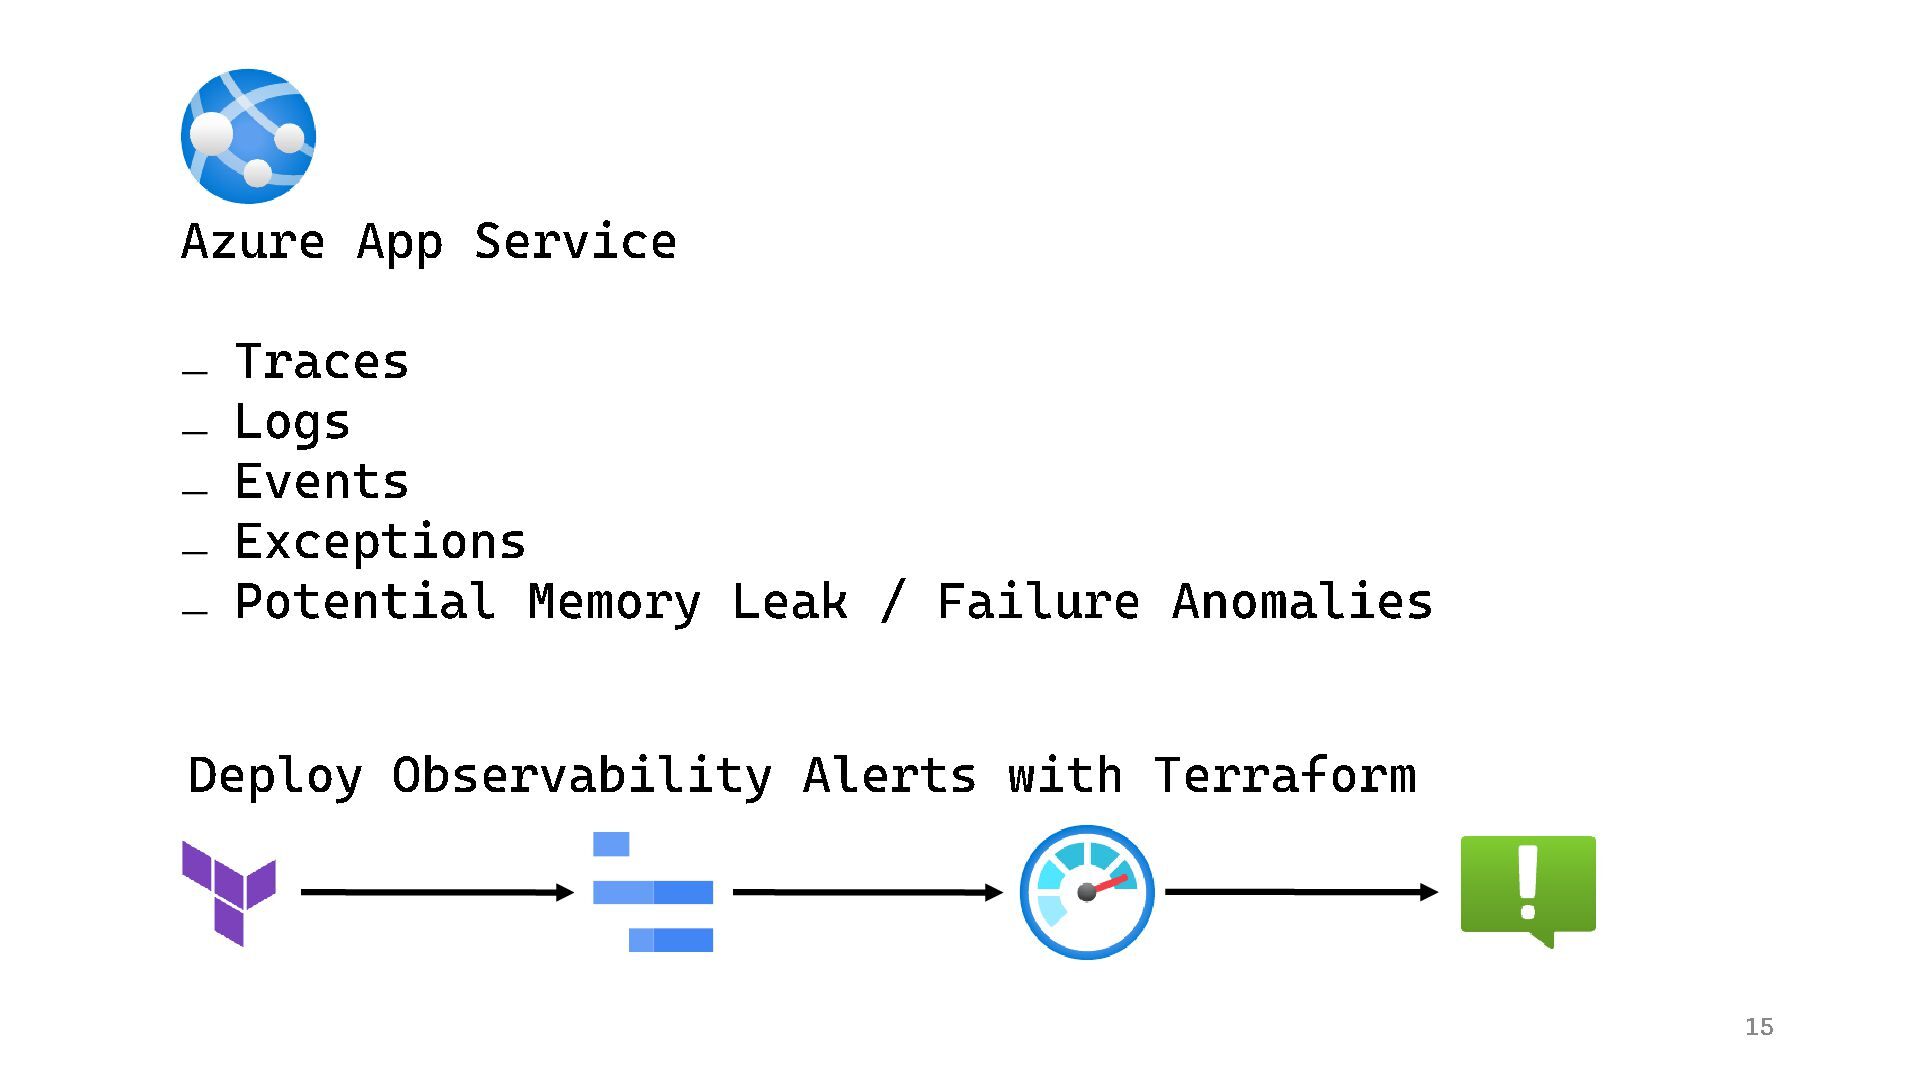
  13. Azure App Service − Traces − Logs − Events −

    Exceptions − Potential Memory Leak / Failure Anomalies 15 Deploy Observability Alerts with Terraform
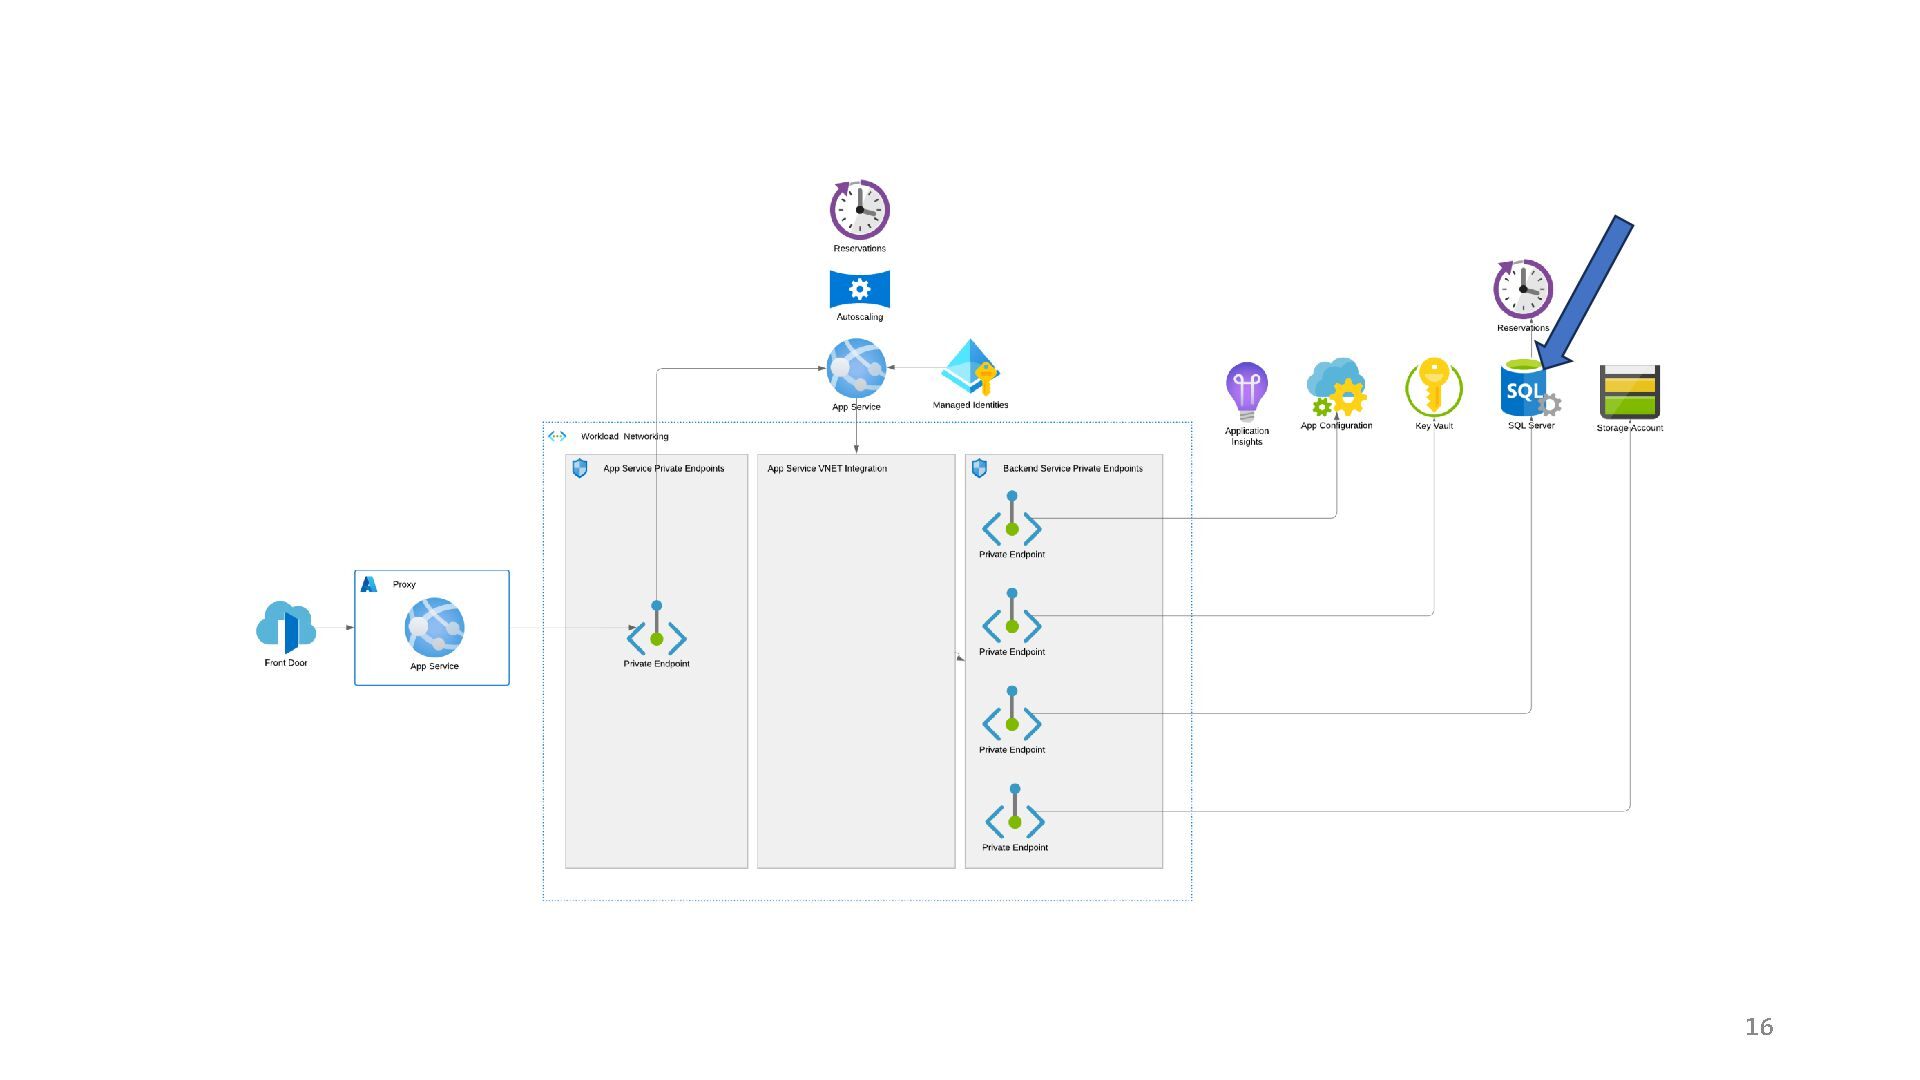
  14. 16

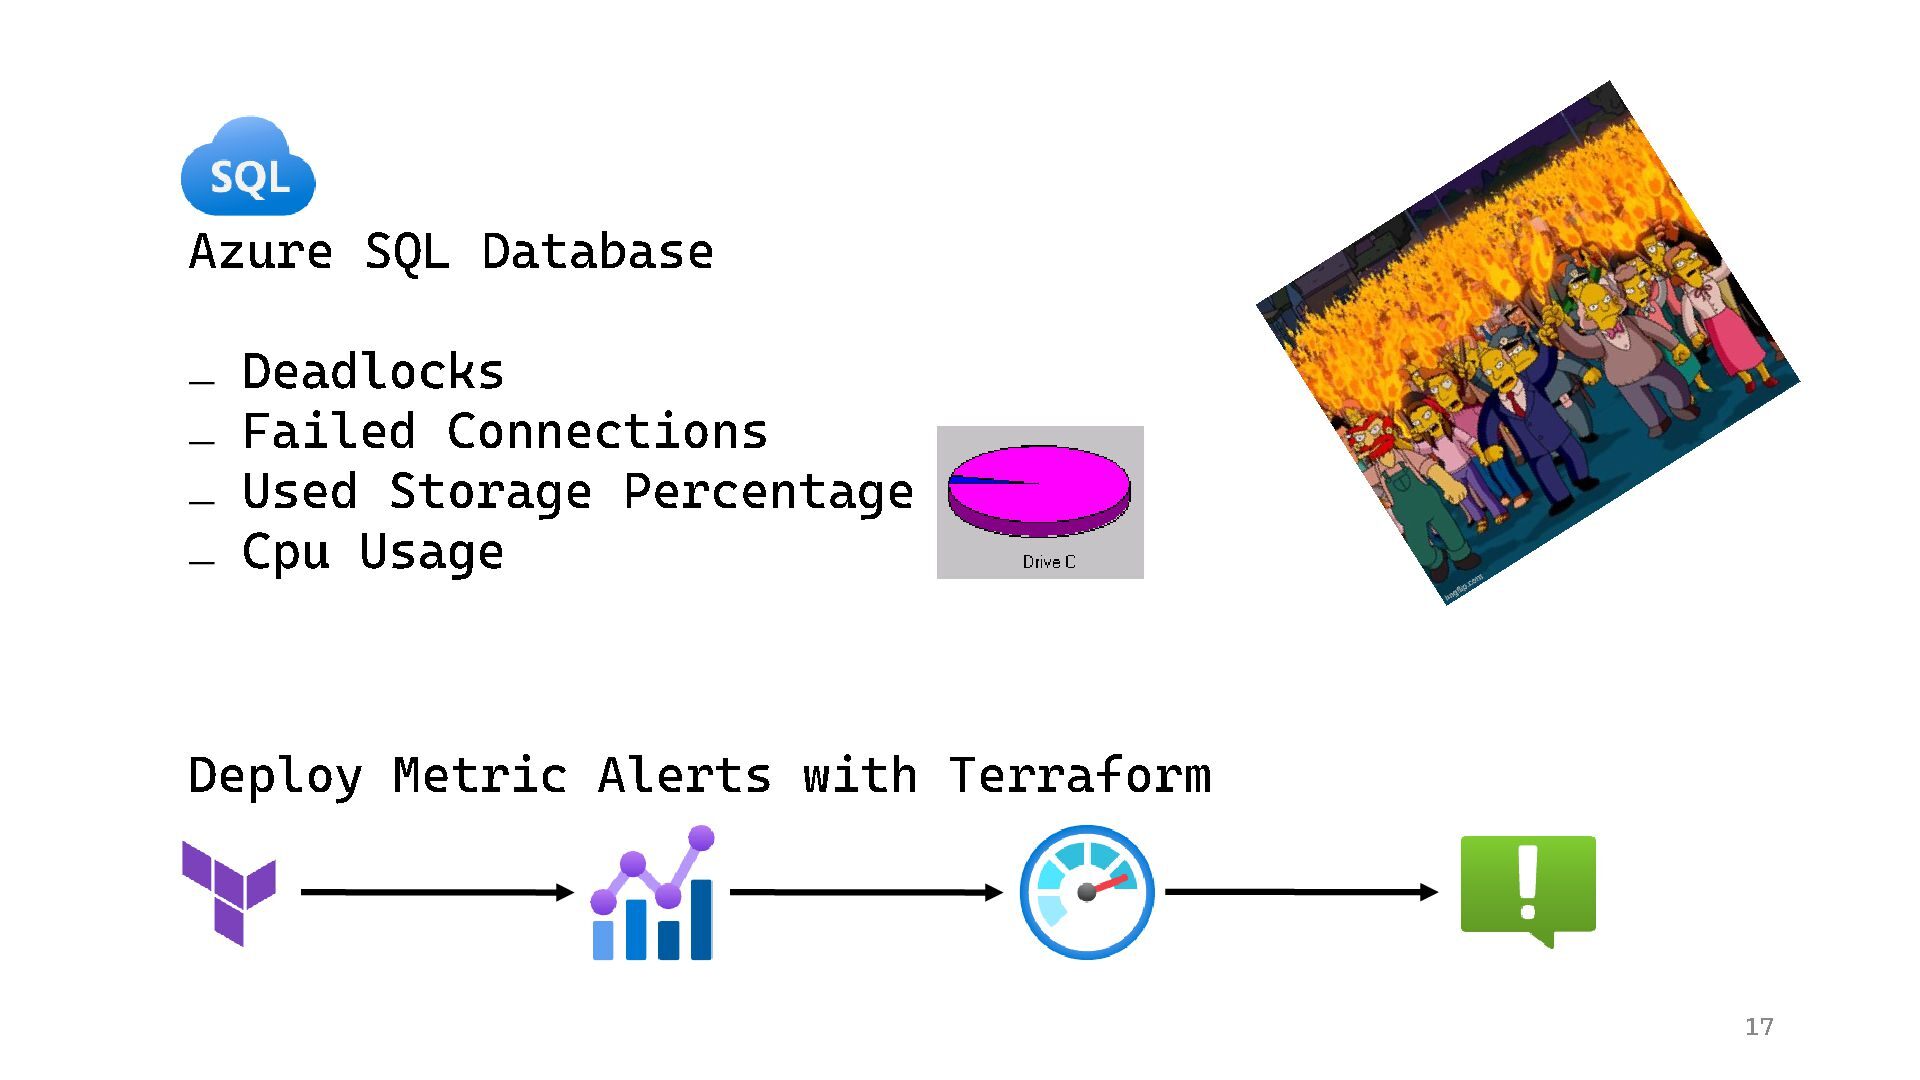
  15. Azure SQL Database − Deadlocks − Failed Connections − Used

    Storage Percentage − Cpu Usage 17 Deploy Metric Alerts with Terraform
  16. 19

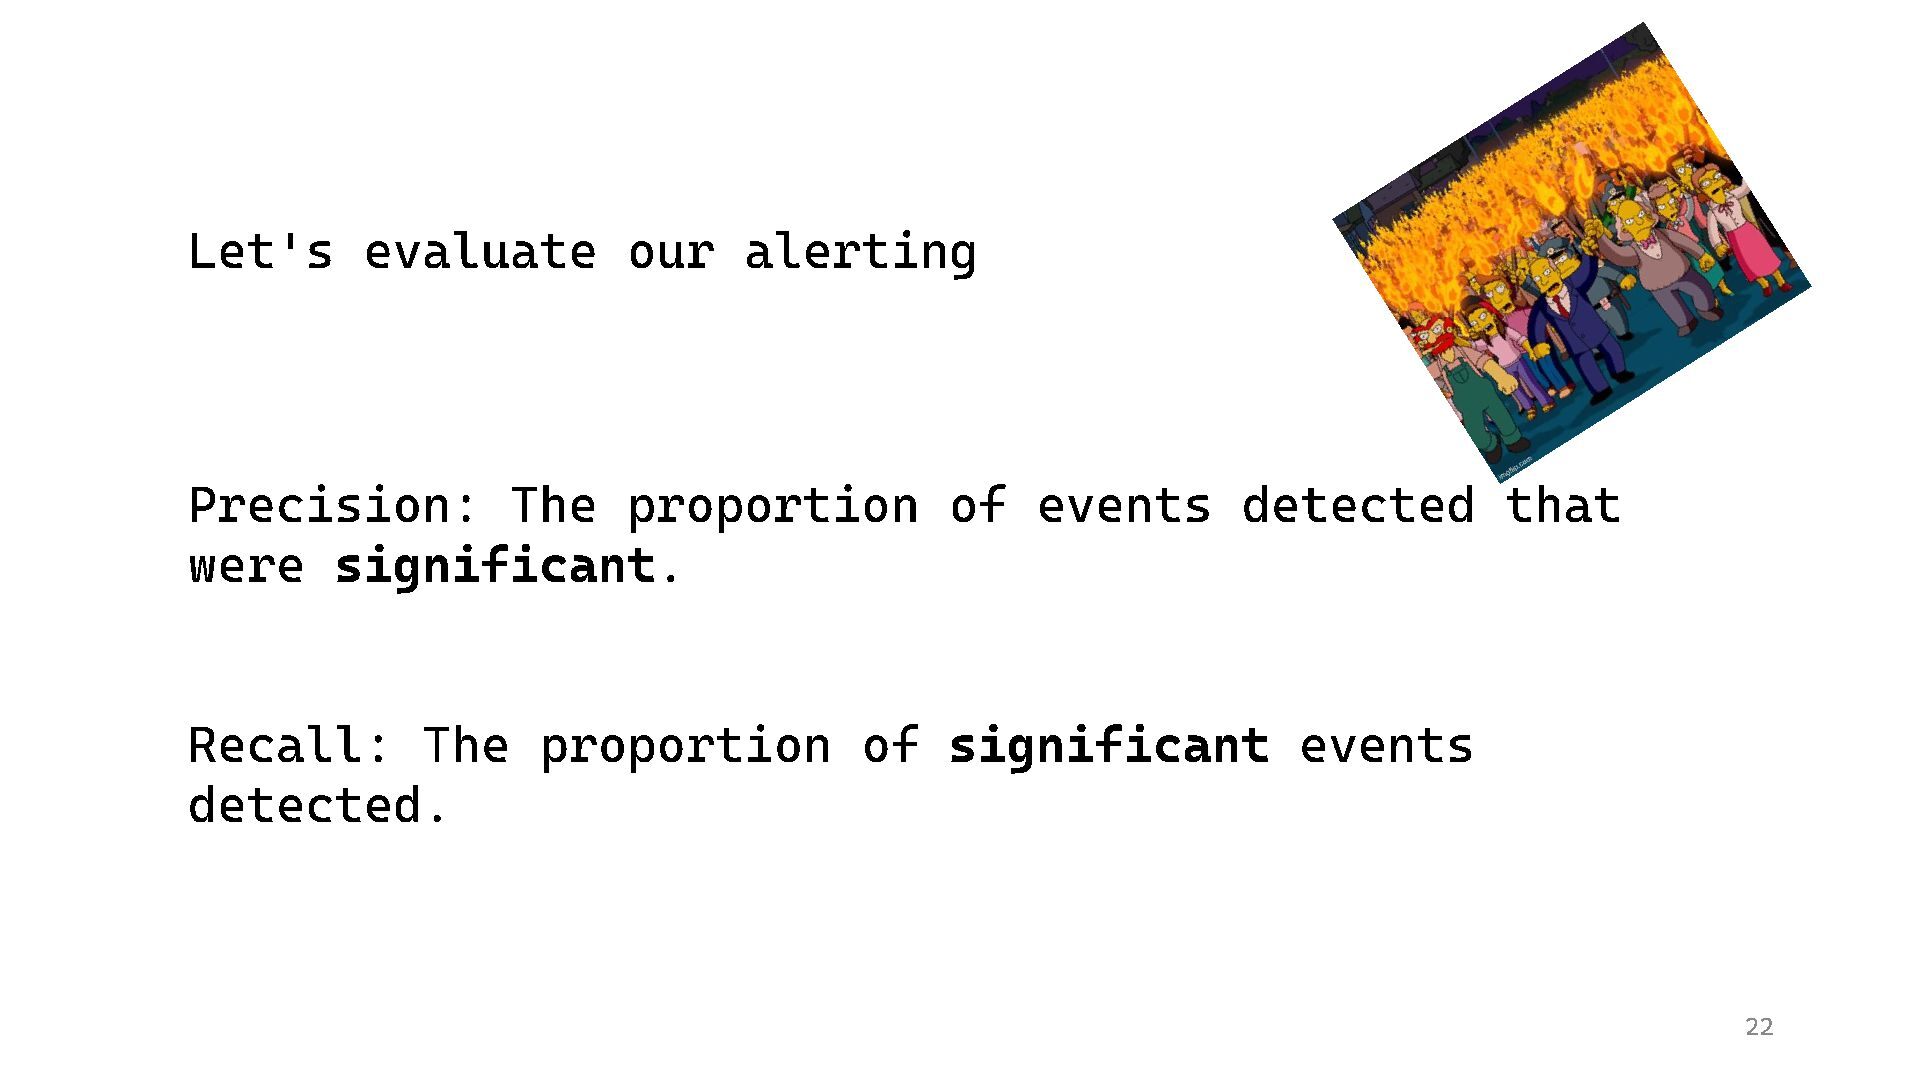
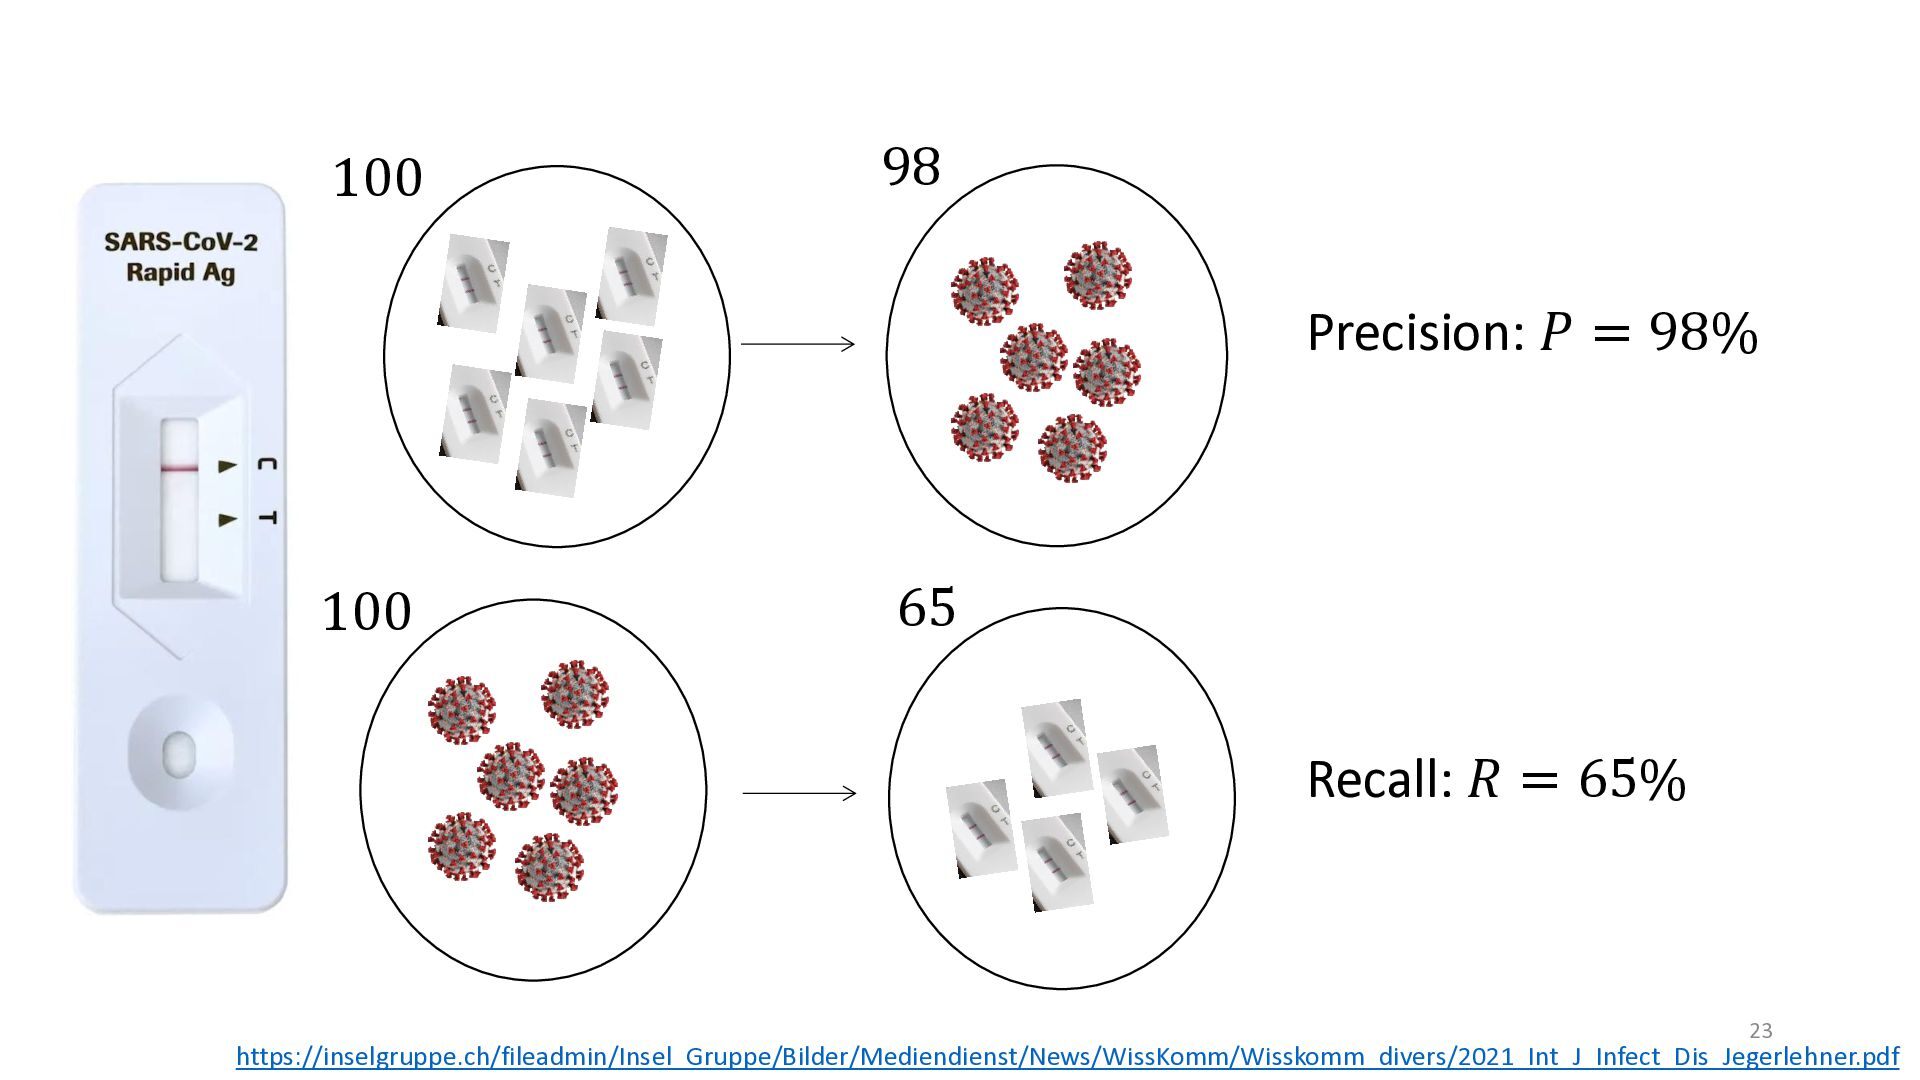
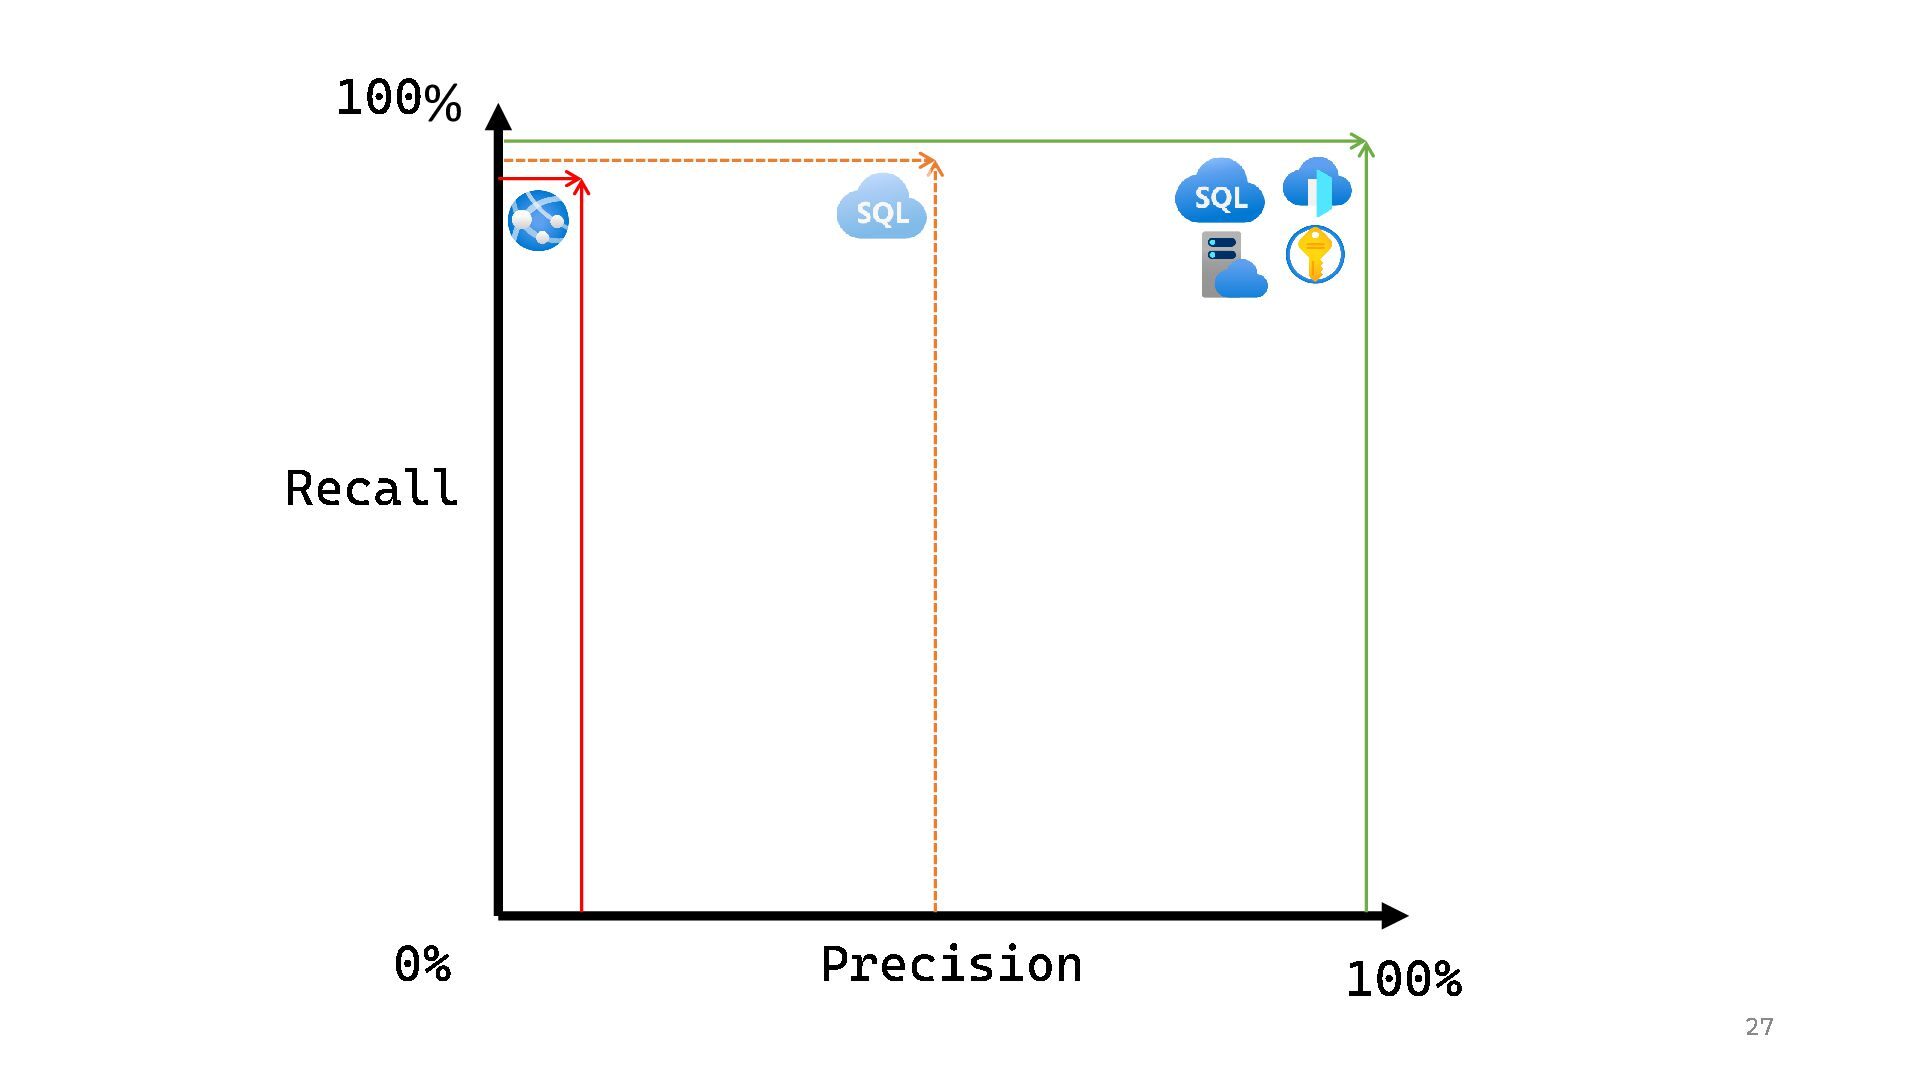
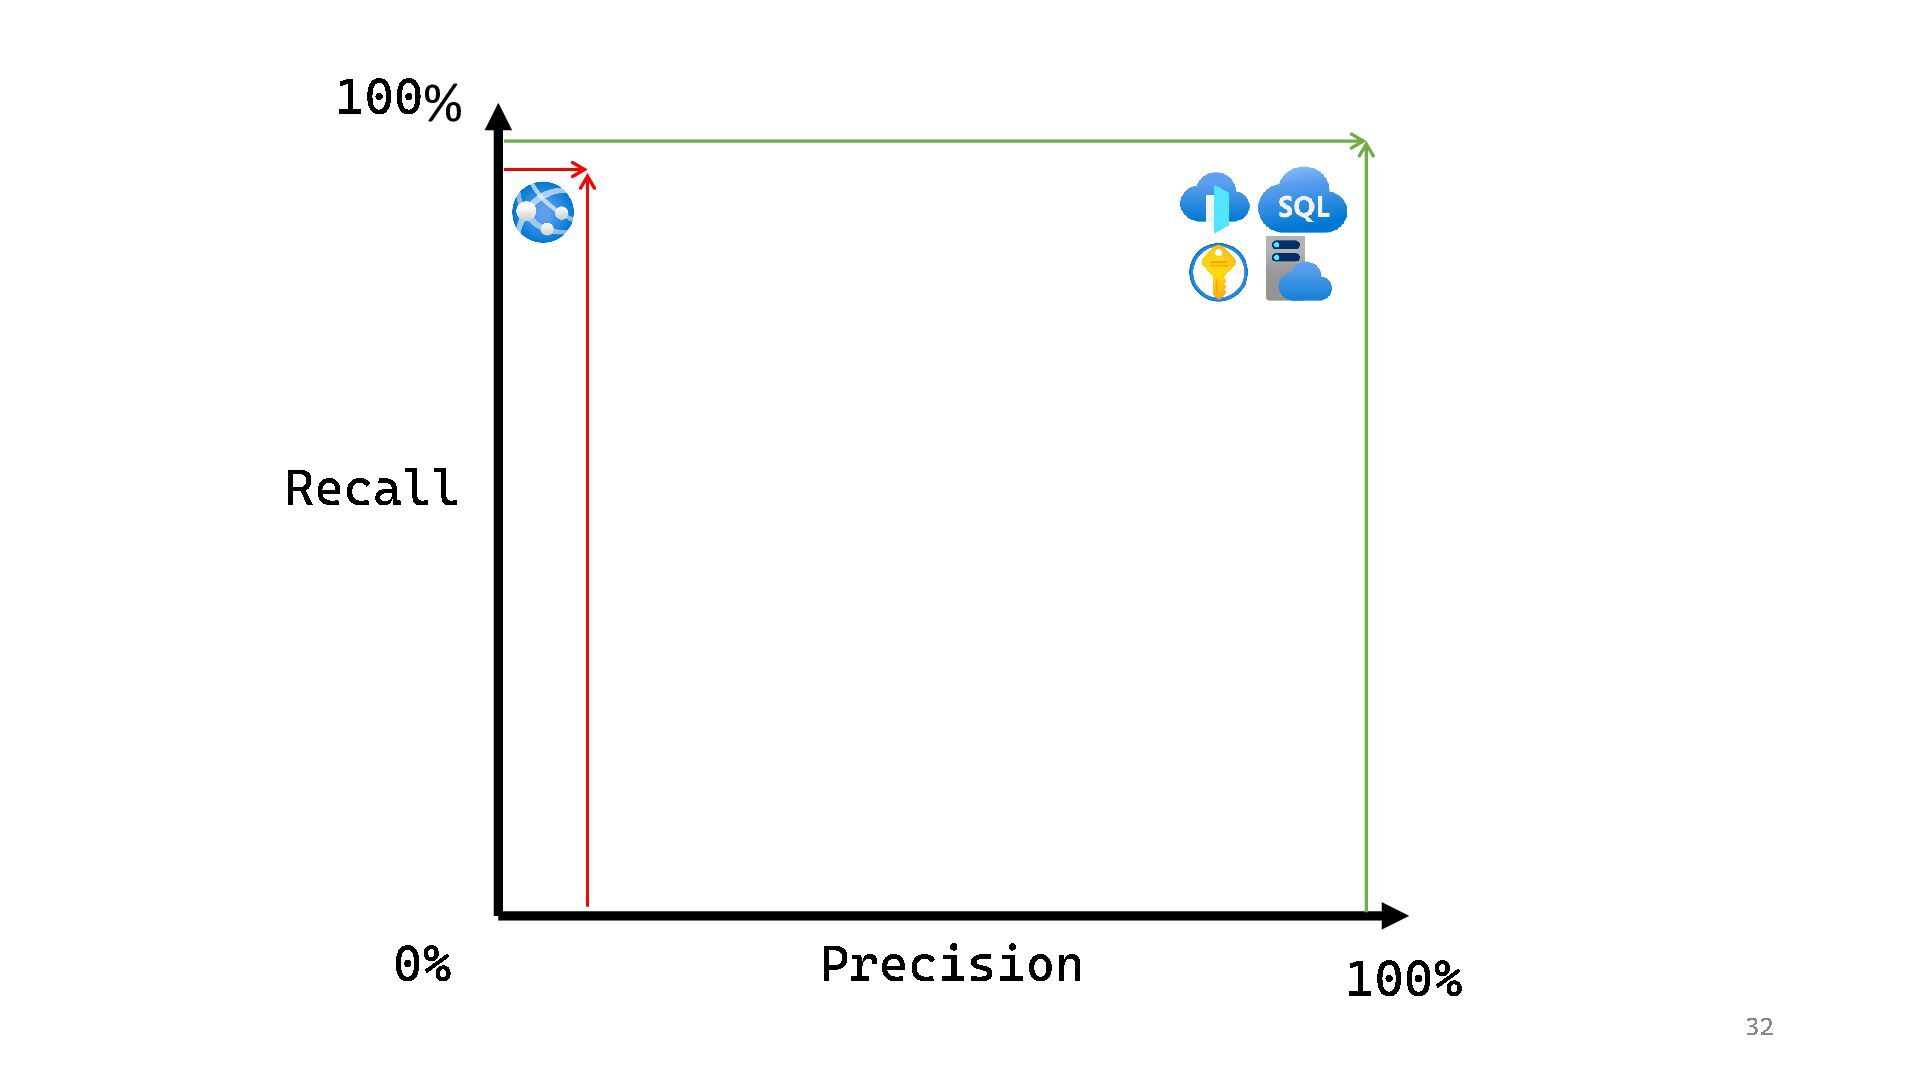
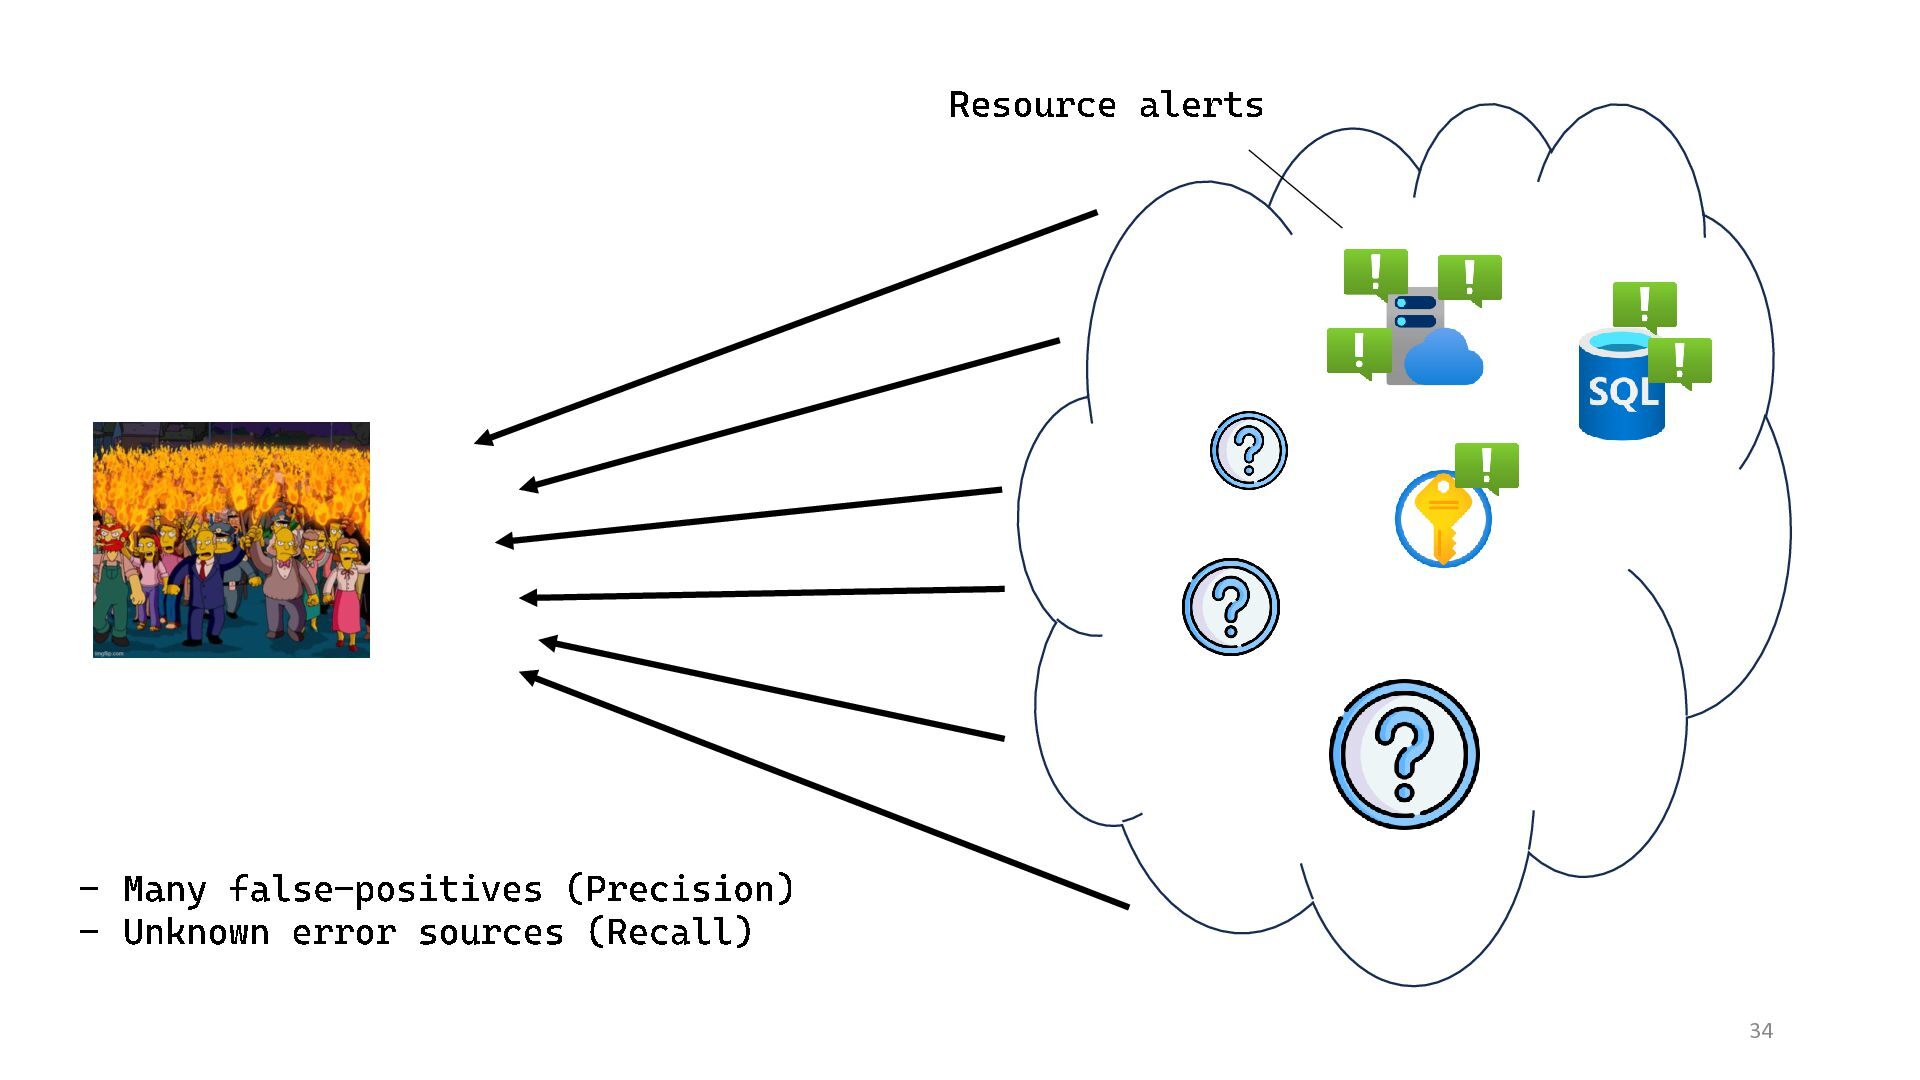
  17. Precision: The proportion of events detected that were significant .

    Recall: The proportion of significant events detected. 22 Let's evaluate our alerting
  18. 24

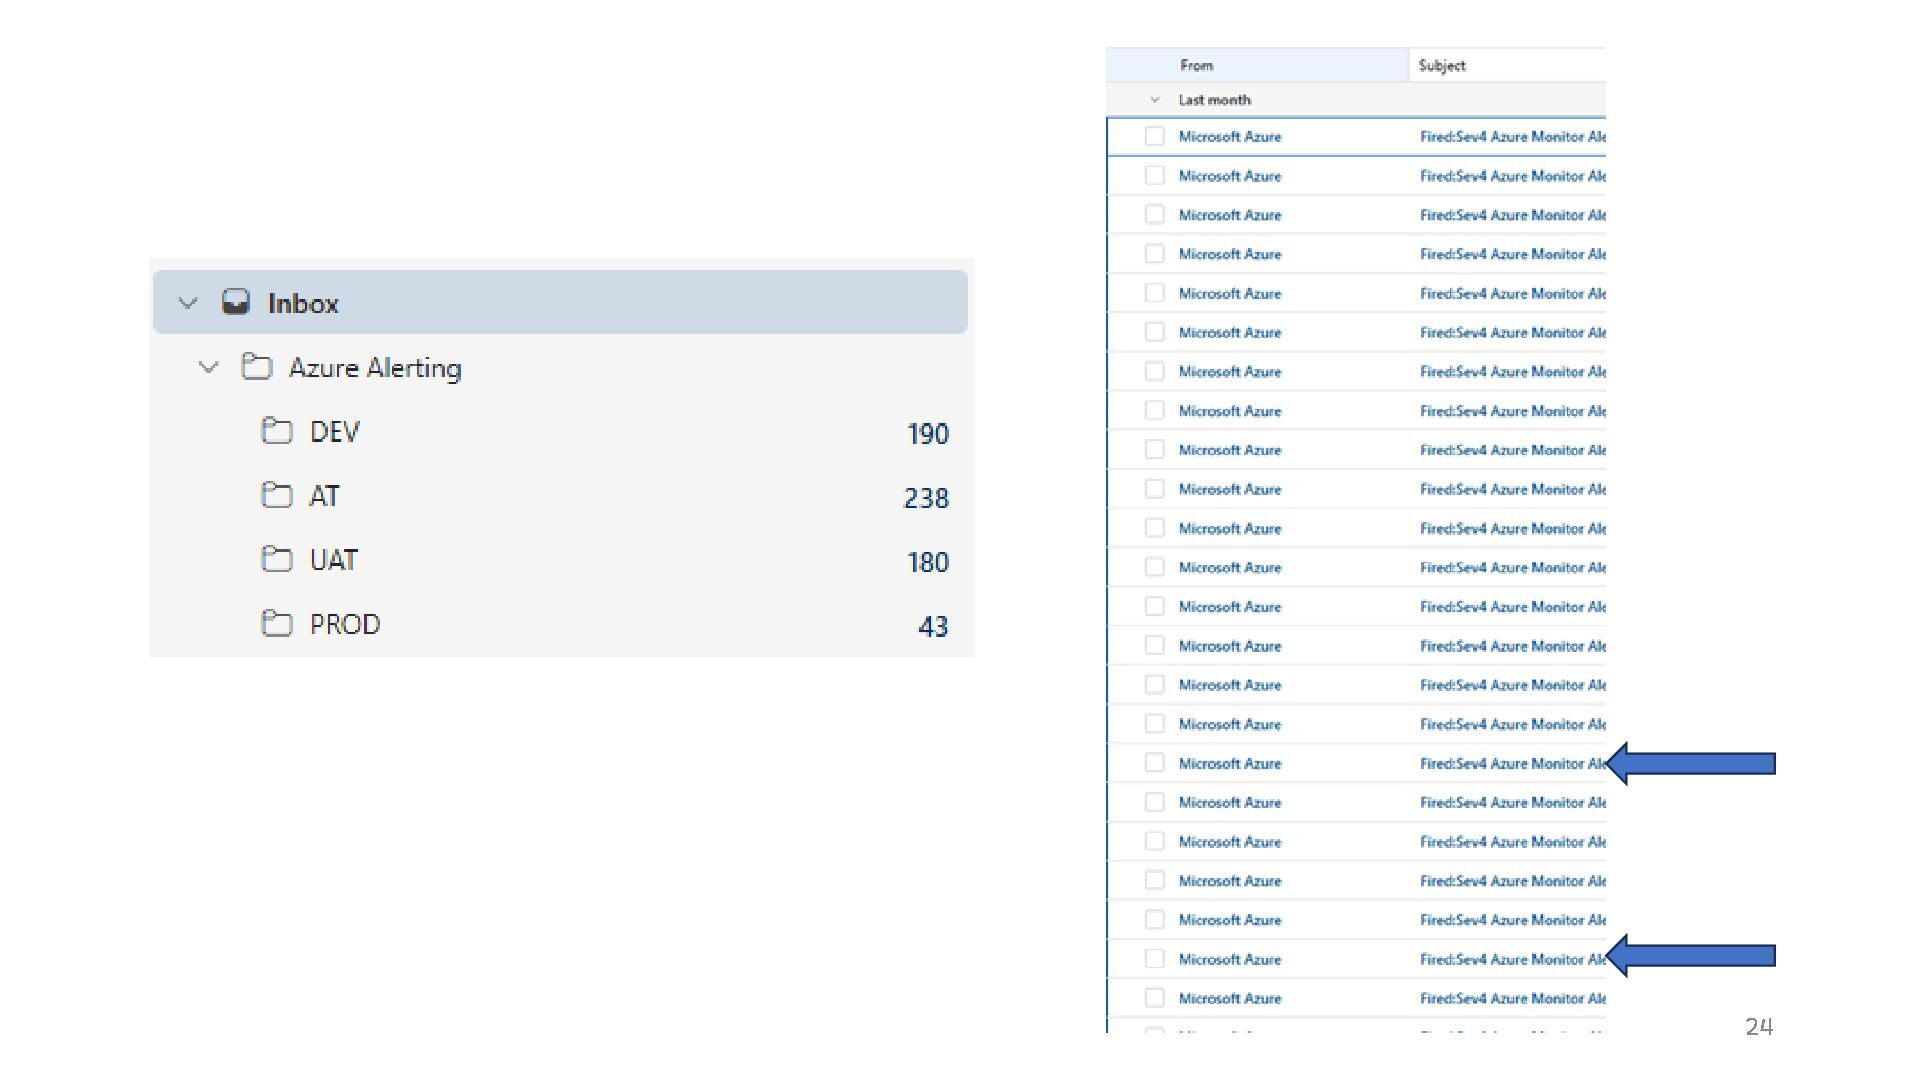
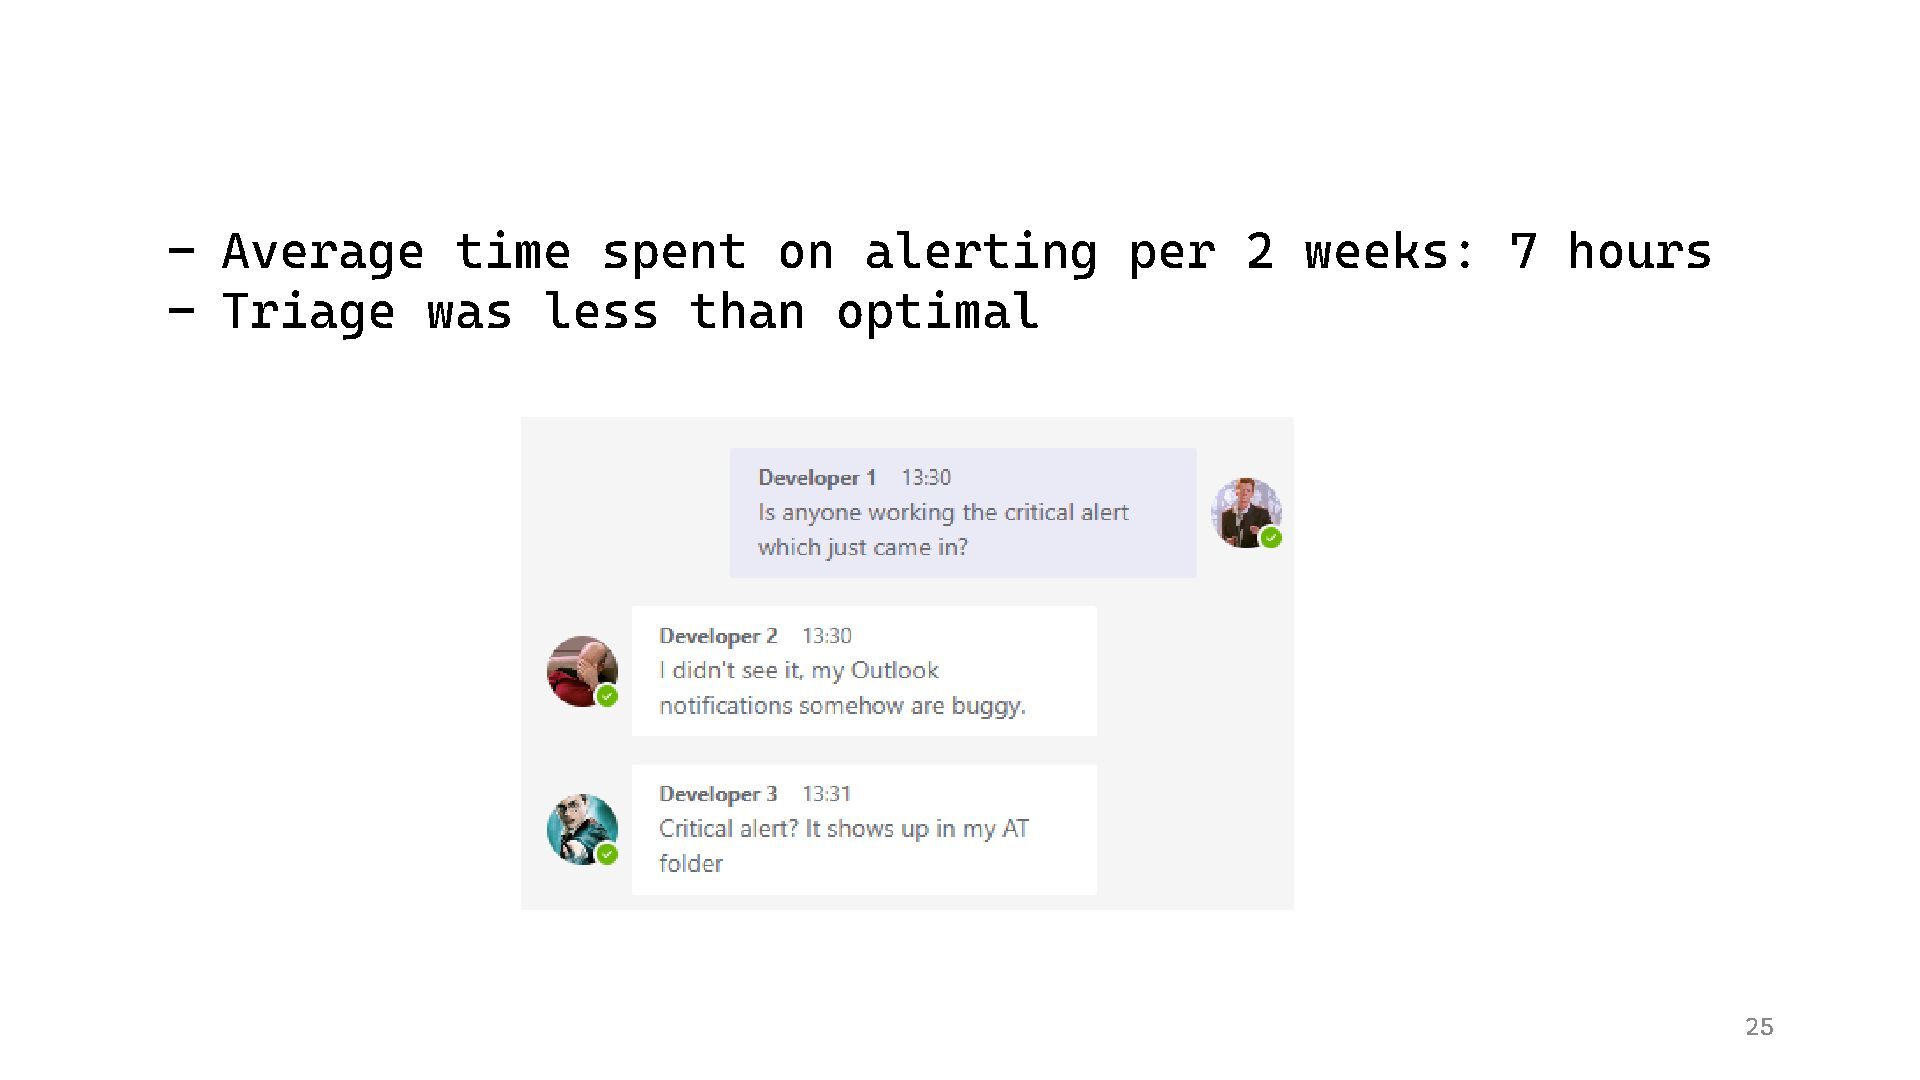
  19. 25 - Average time spent on alerting per 2 weeks:

    7 hours - Triage was less than optimal
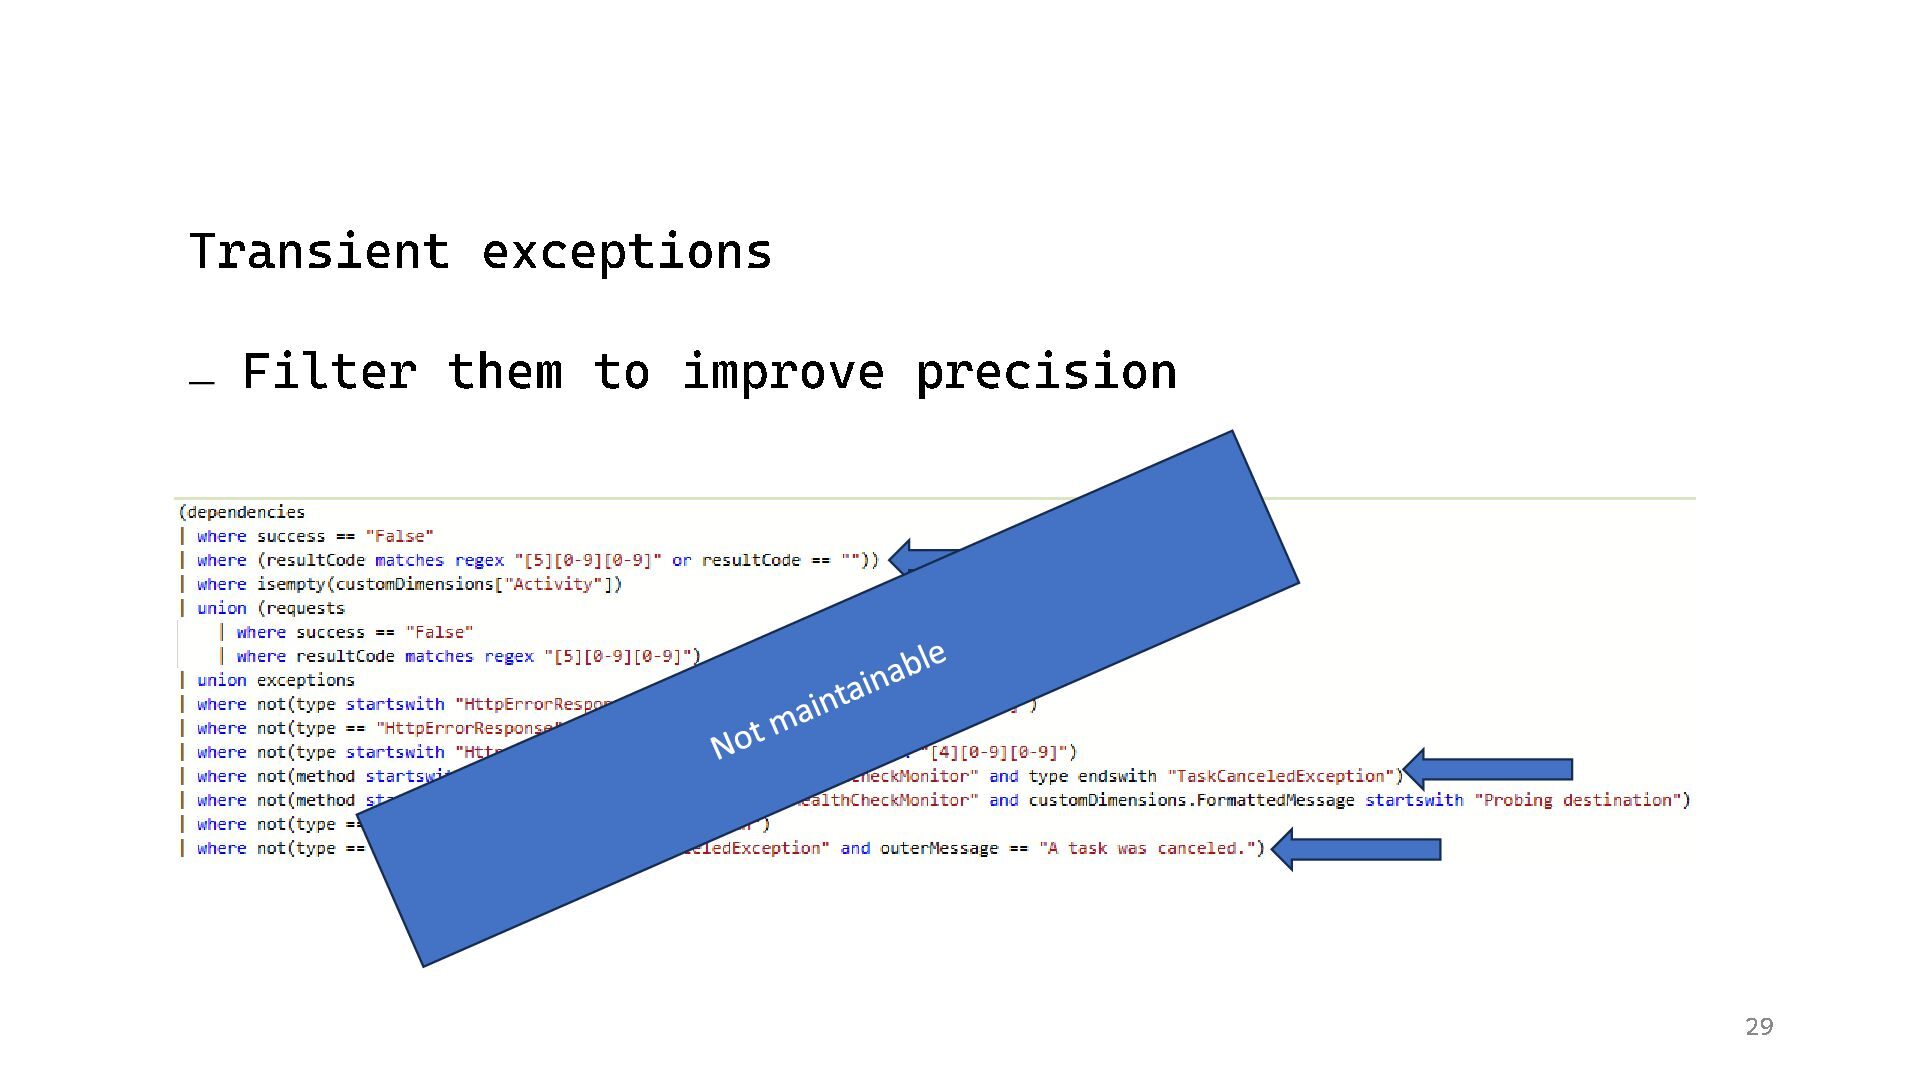
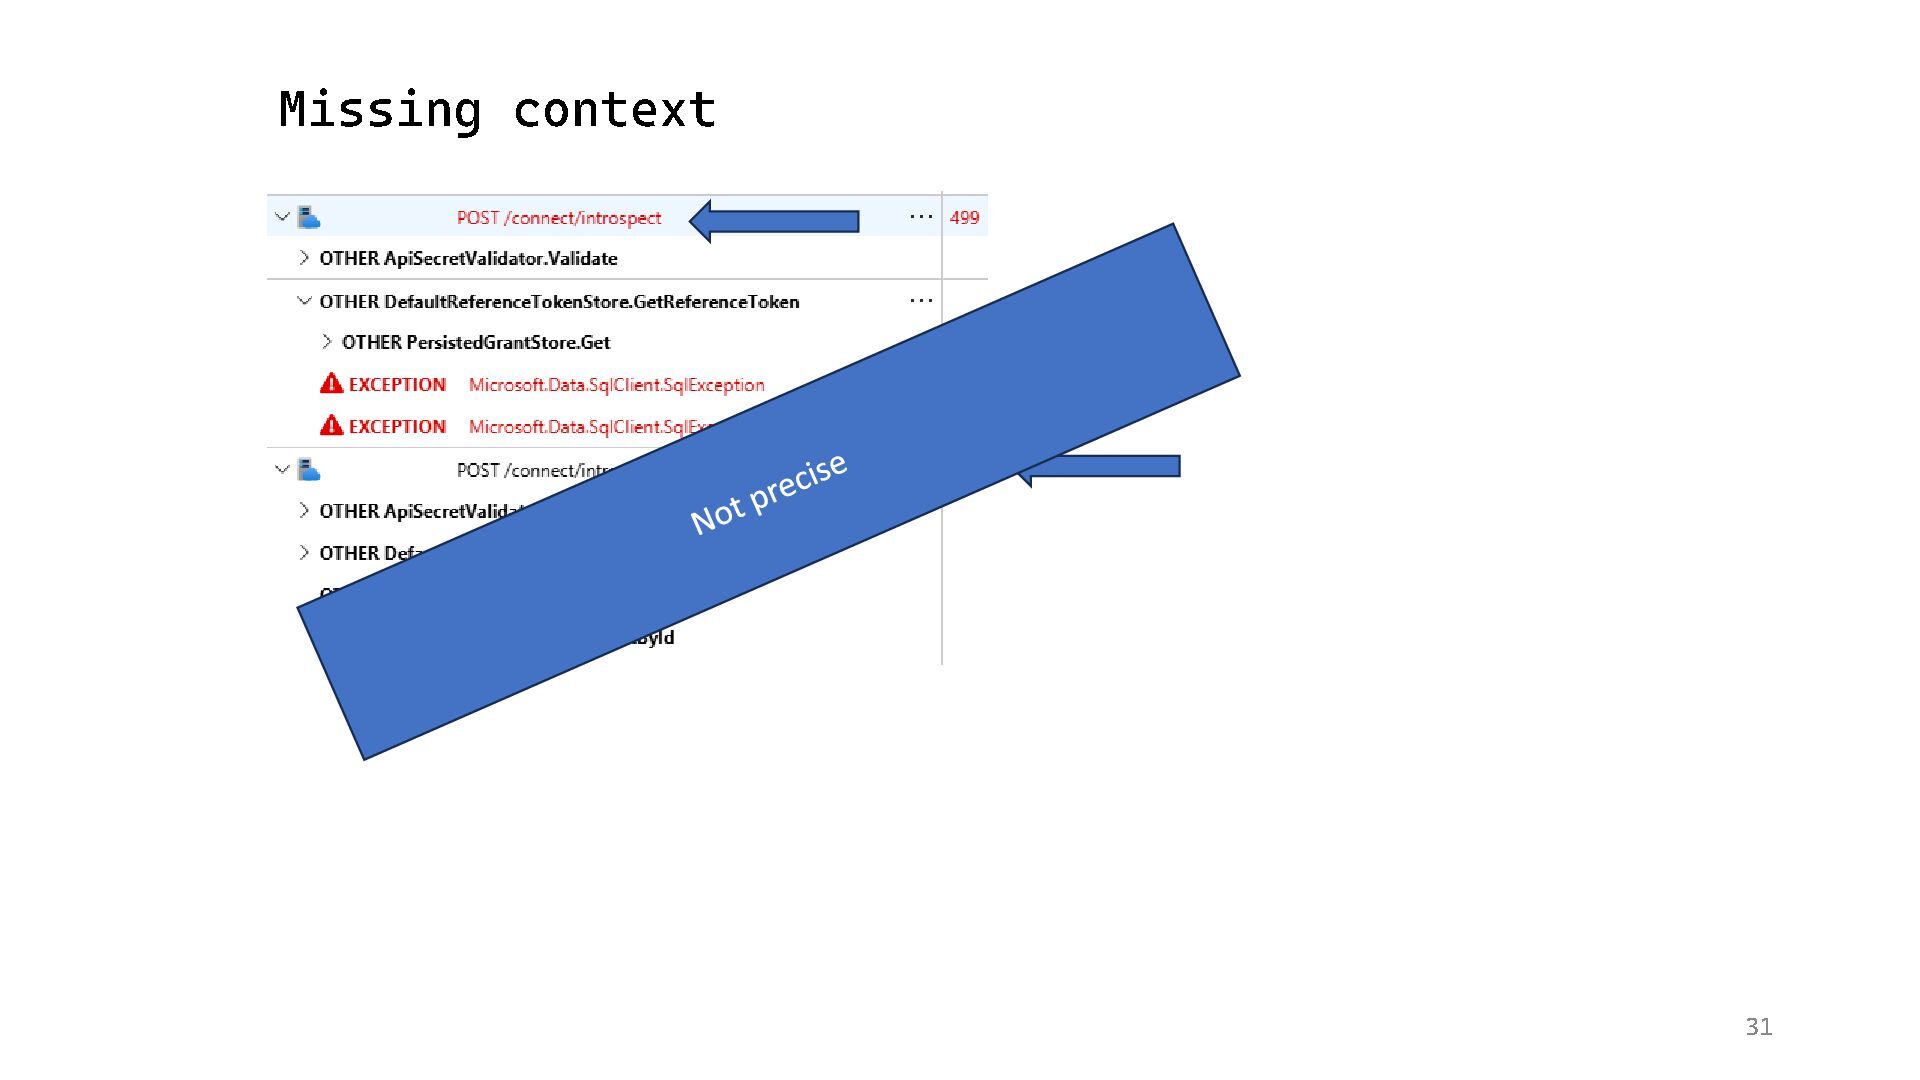
  20. 28 Why are exceptions not ideal for alerting? − Transient

    − Abstraction over different root causes − Missing context
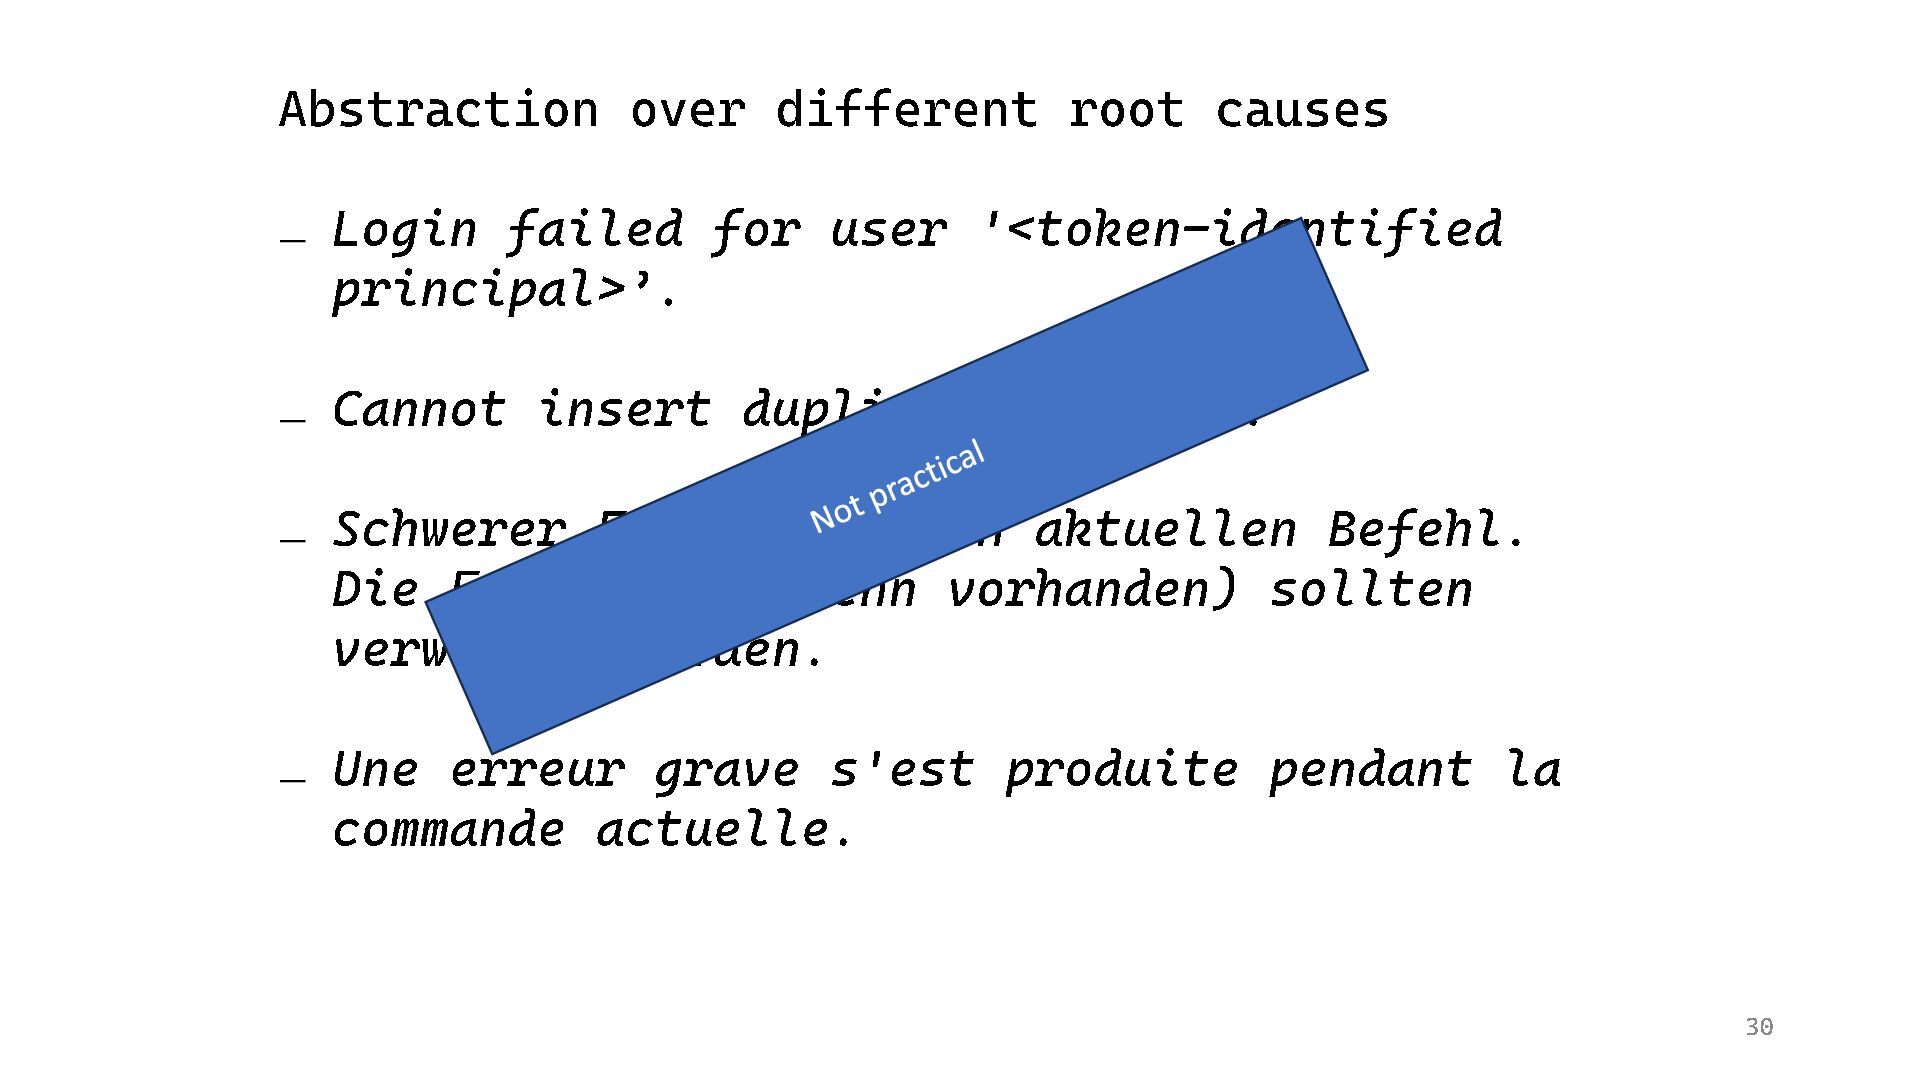
  21. 30 Abstraction over different root causes − Login failed for

    user '<token - identified principal>’. − Cannot insert duplicate key row. − Schwerer Fehler für den aktuellen Befehl. Die Ergebnisse (wenn vorhanden) sollten verworfen werden. − Une erreur grave s'est produite pendant la commande actuelle.
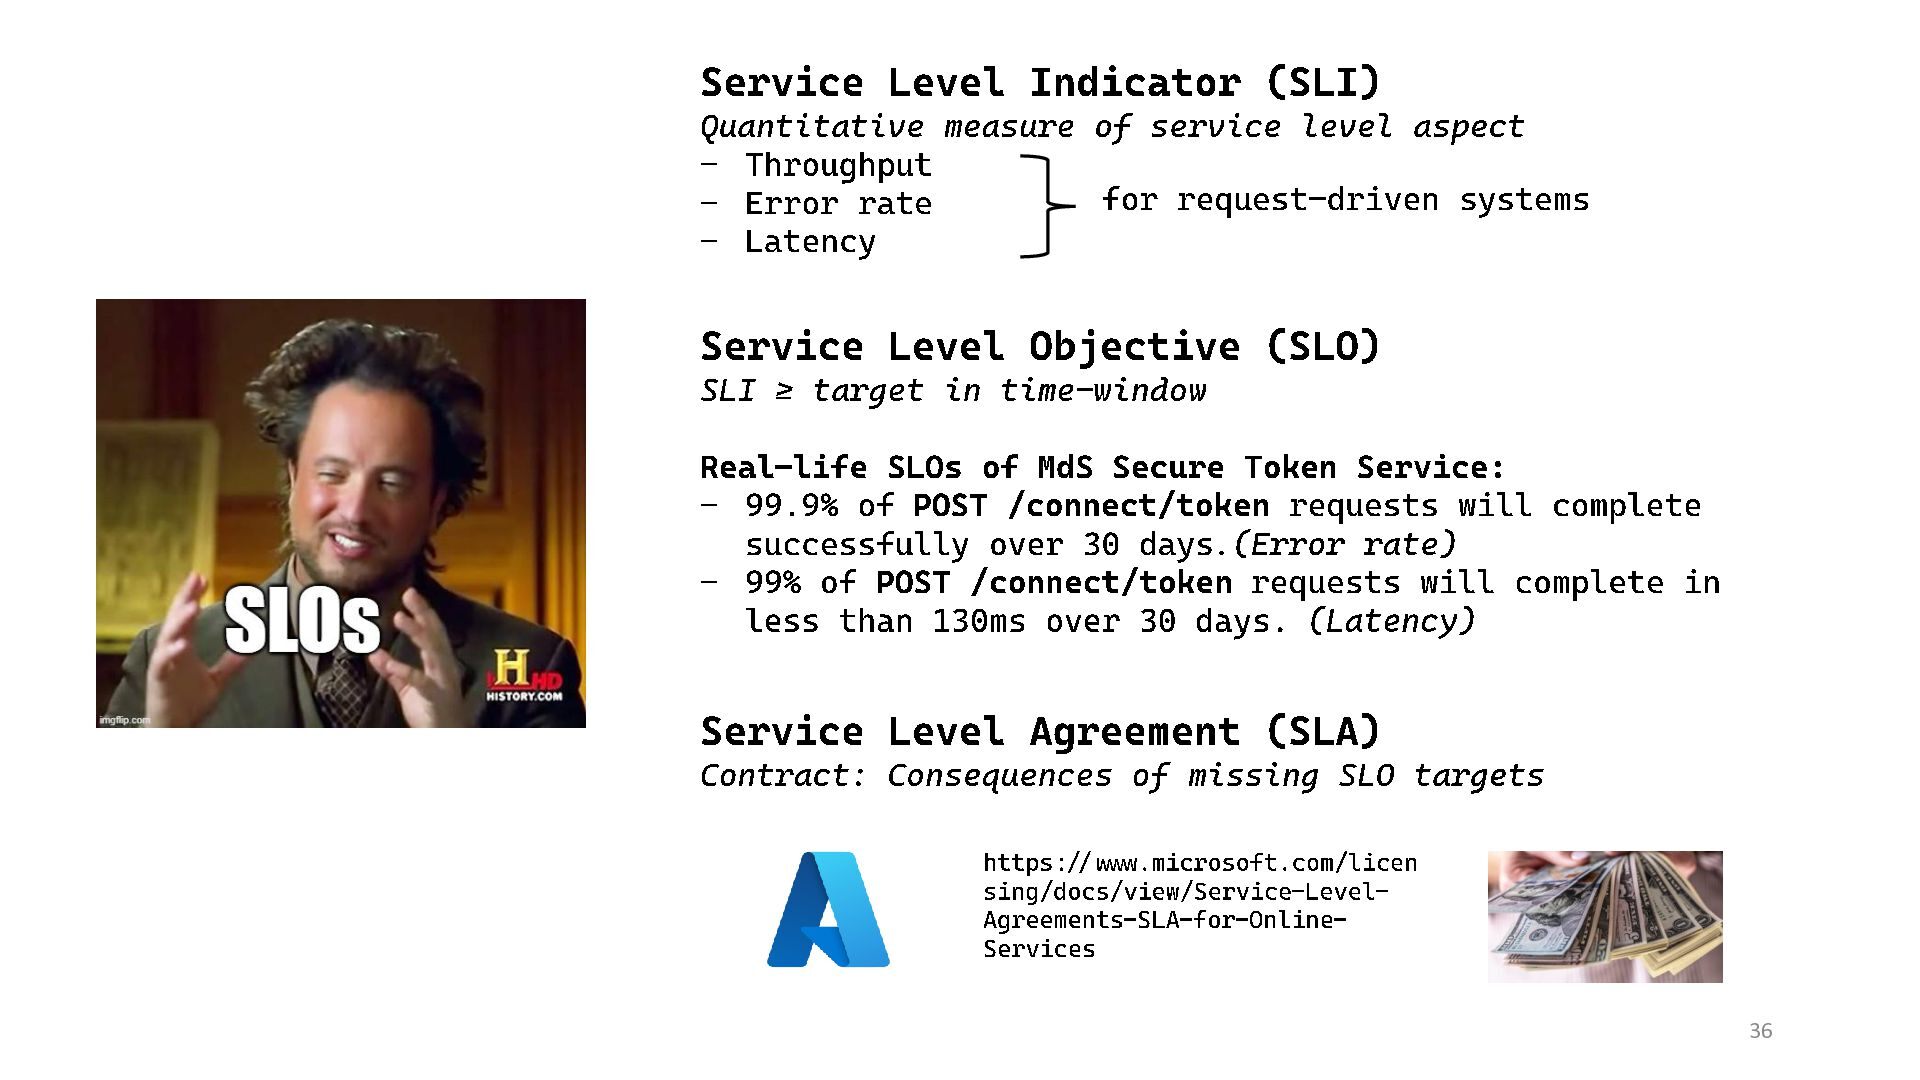
  22. 36 Service Level Indicator (SLI) Quantitative measure of service level

    aspect - Throughput - Error rate - Latency Service Level Objective (SLO) SLI ≥ target in time - window Real - life SLOs of MdS Secure Token Service: - 99.9% of POST /connect/token requests will complete successfully over 30 days .(Error rate) - 99% of POST /connect/token requests will complete in less than 130ms over 30 days. (Latency) Service Level Agreement (SLA) Contract: Consequences of missing SLO targets for request - driven systems https://www.microsoft.com/licen sing/docs/view/Service - Level - Agreements - SLA - for - Online - Services
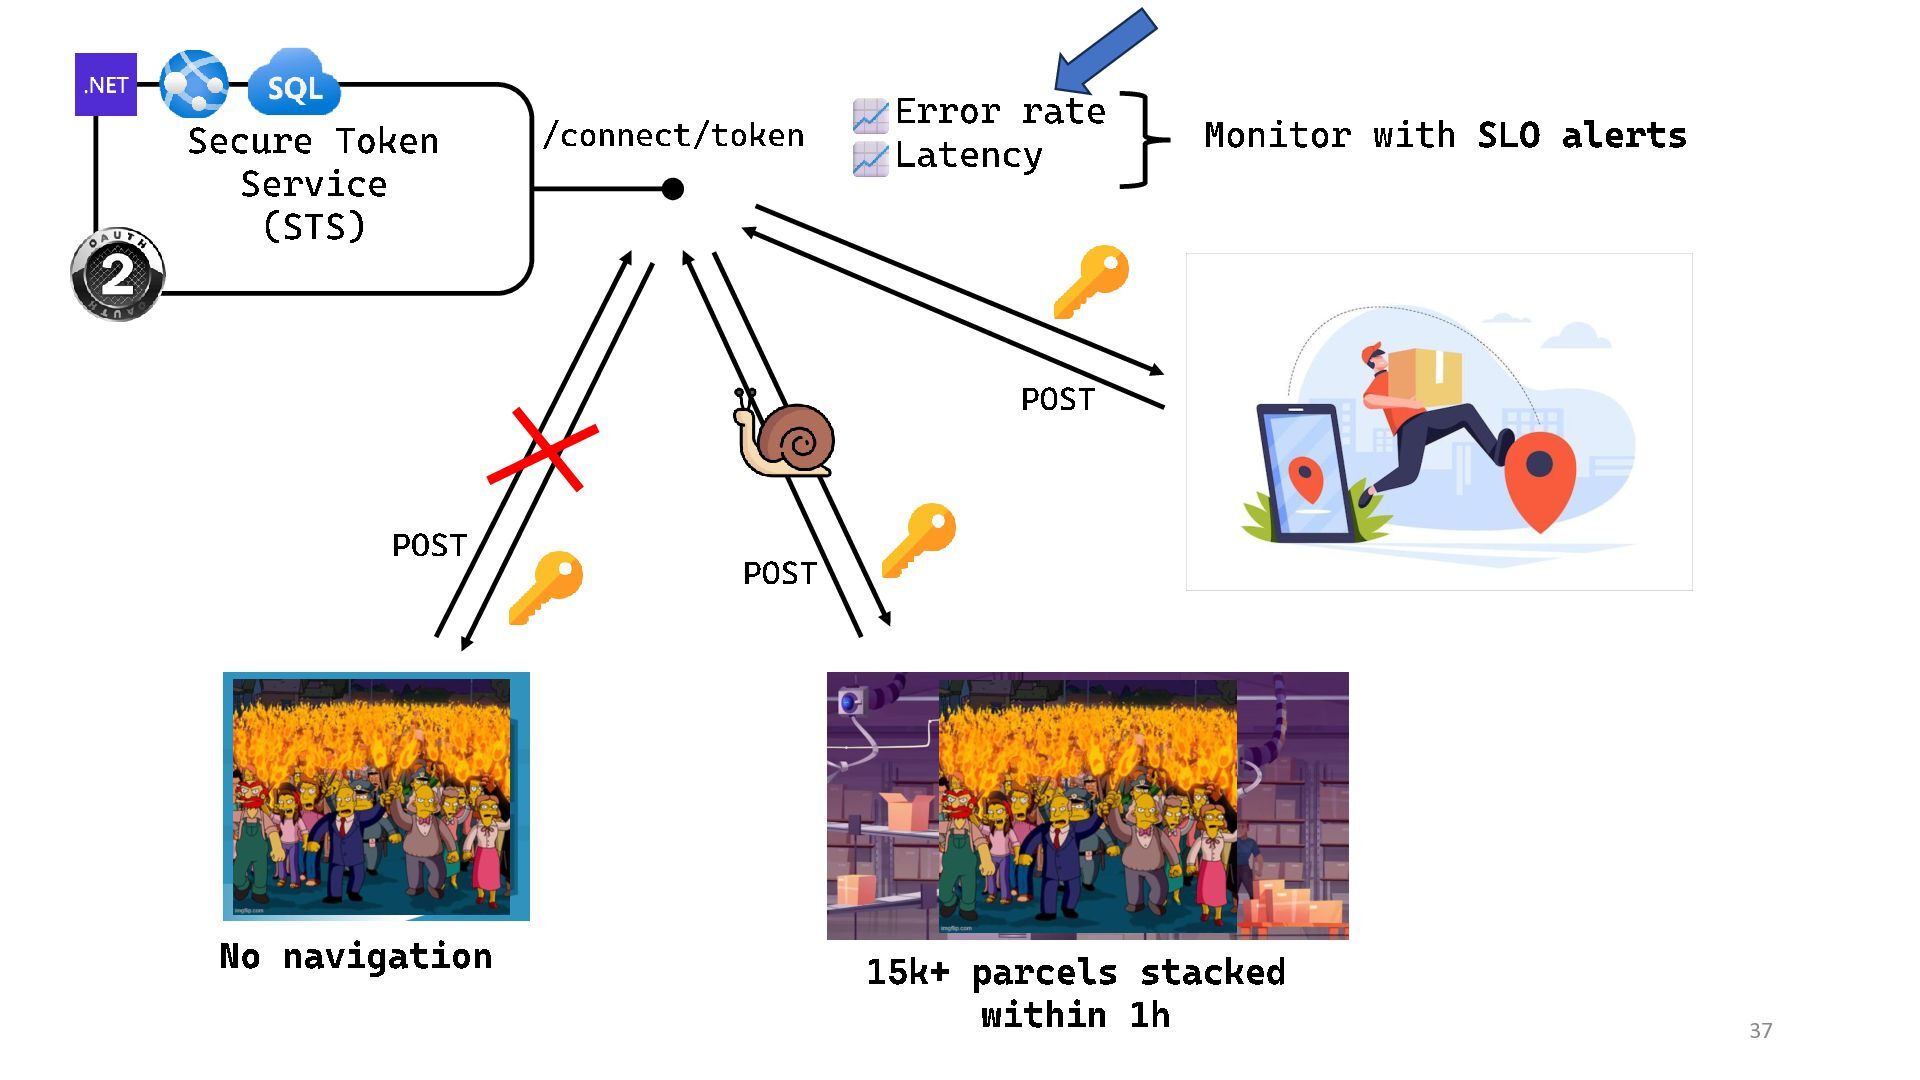
  23. 37 Secure Token Service (STS) /connect/token Error rate Latency POST

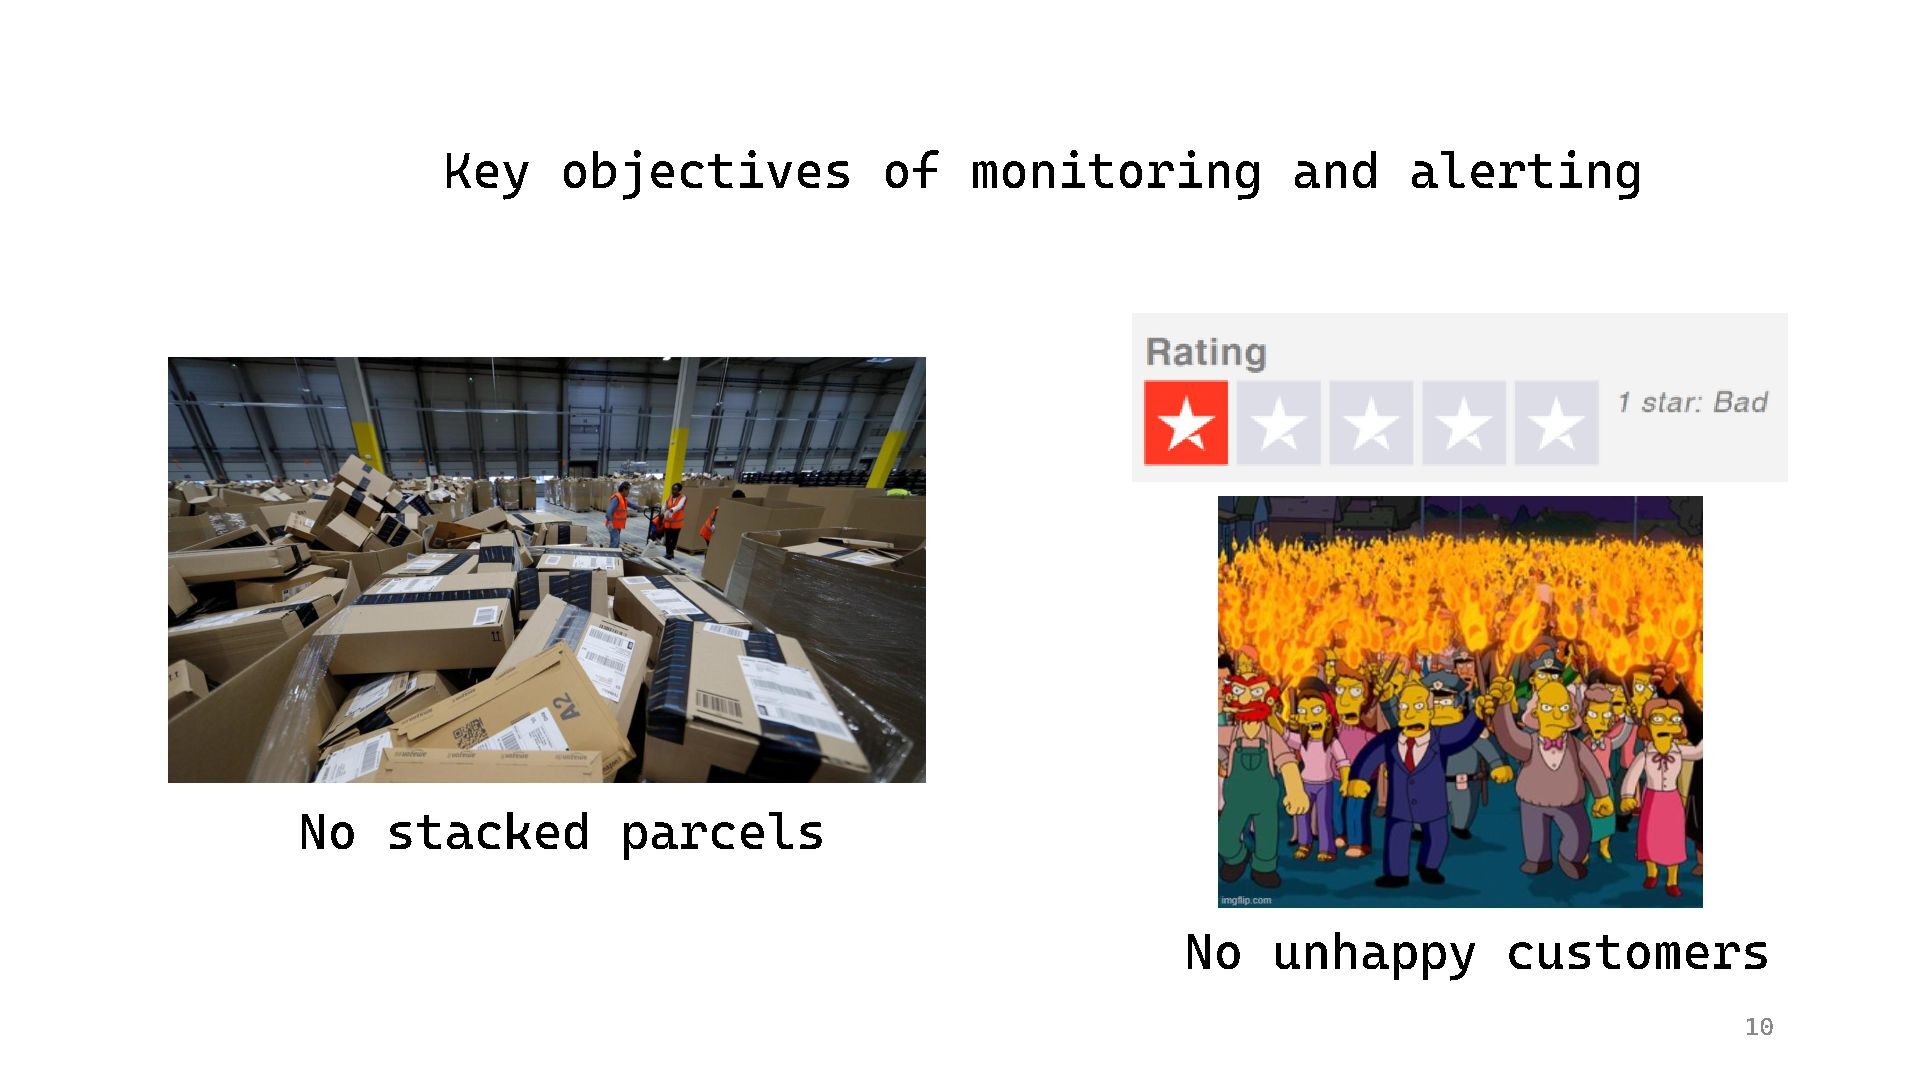
    POST POST Monitor with SLO alerts 15k+ parcels stacked within 1h No navigation
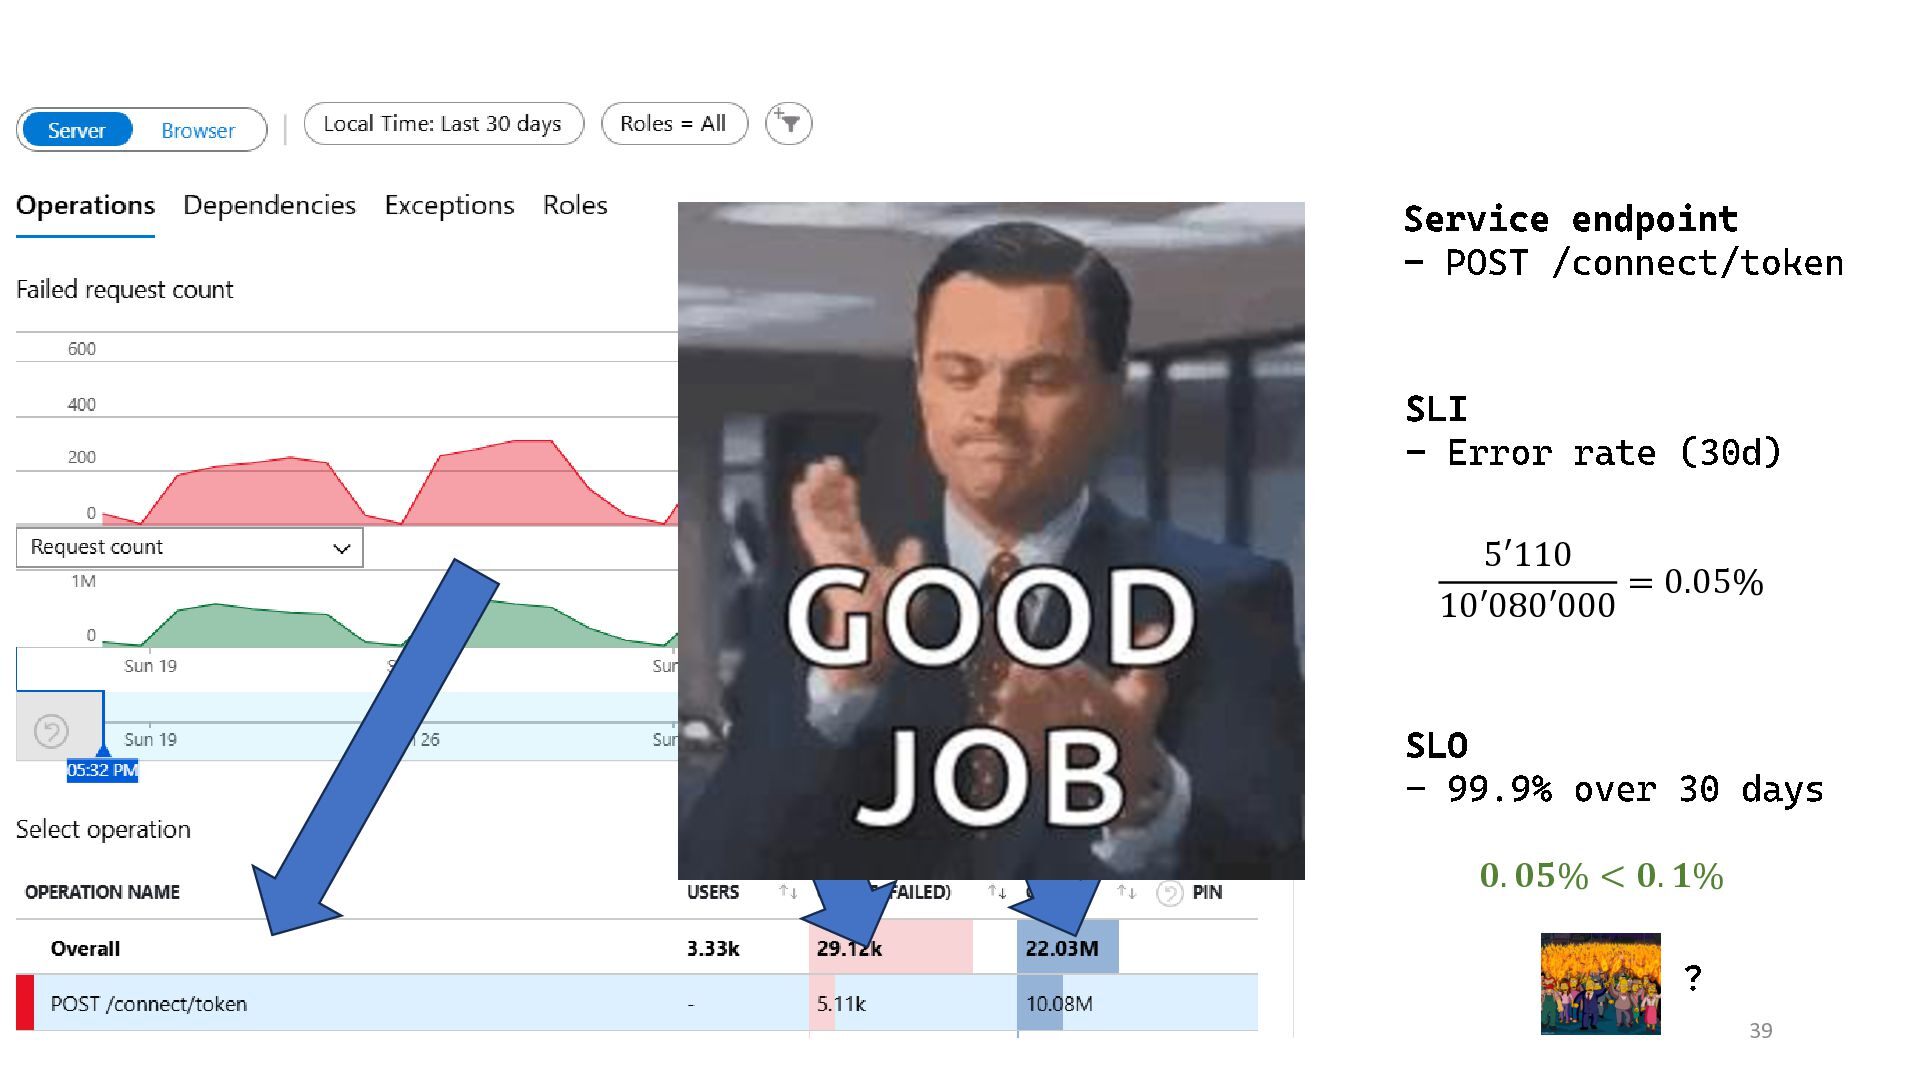
  24. 39 SLI - Error rate (30d) SLO - 99.9% over

    30 days 5′110 10′080′000 = 0.05% 𝟎. 𝟎𝟓% < 𝟎. 𝟏% Service endpoint - POST /connect/token ?
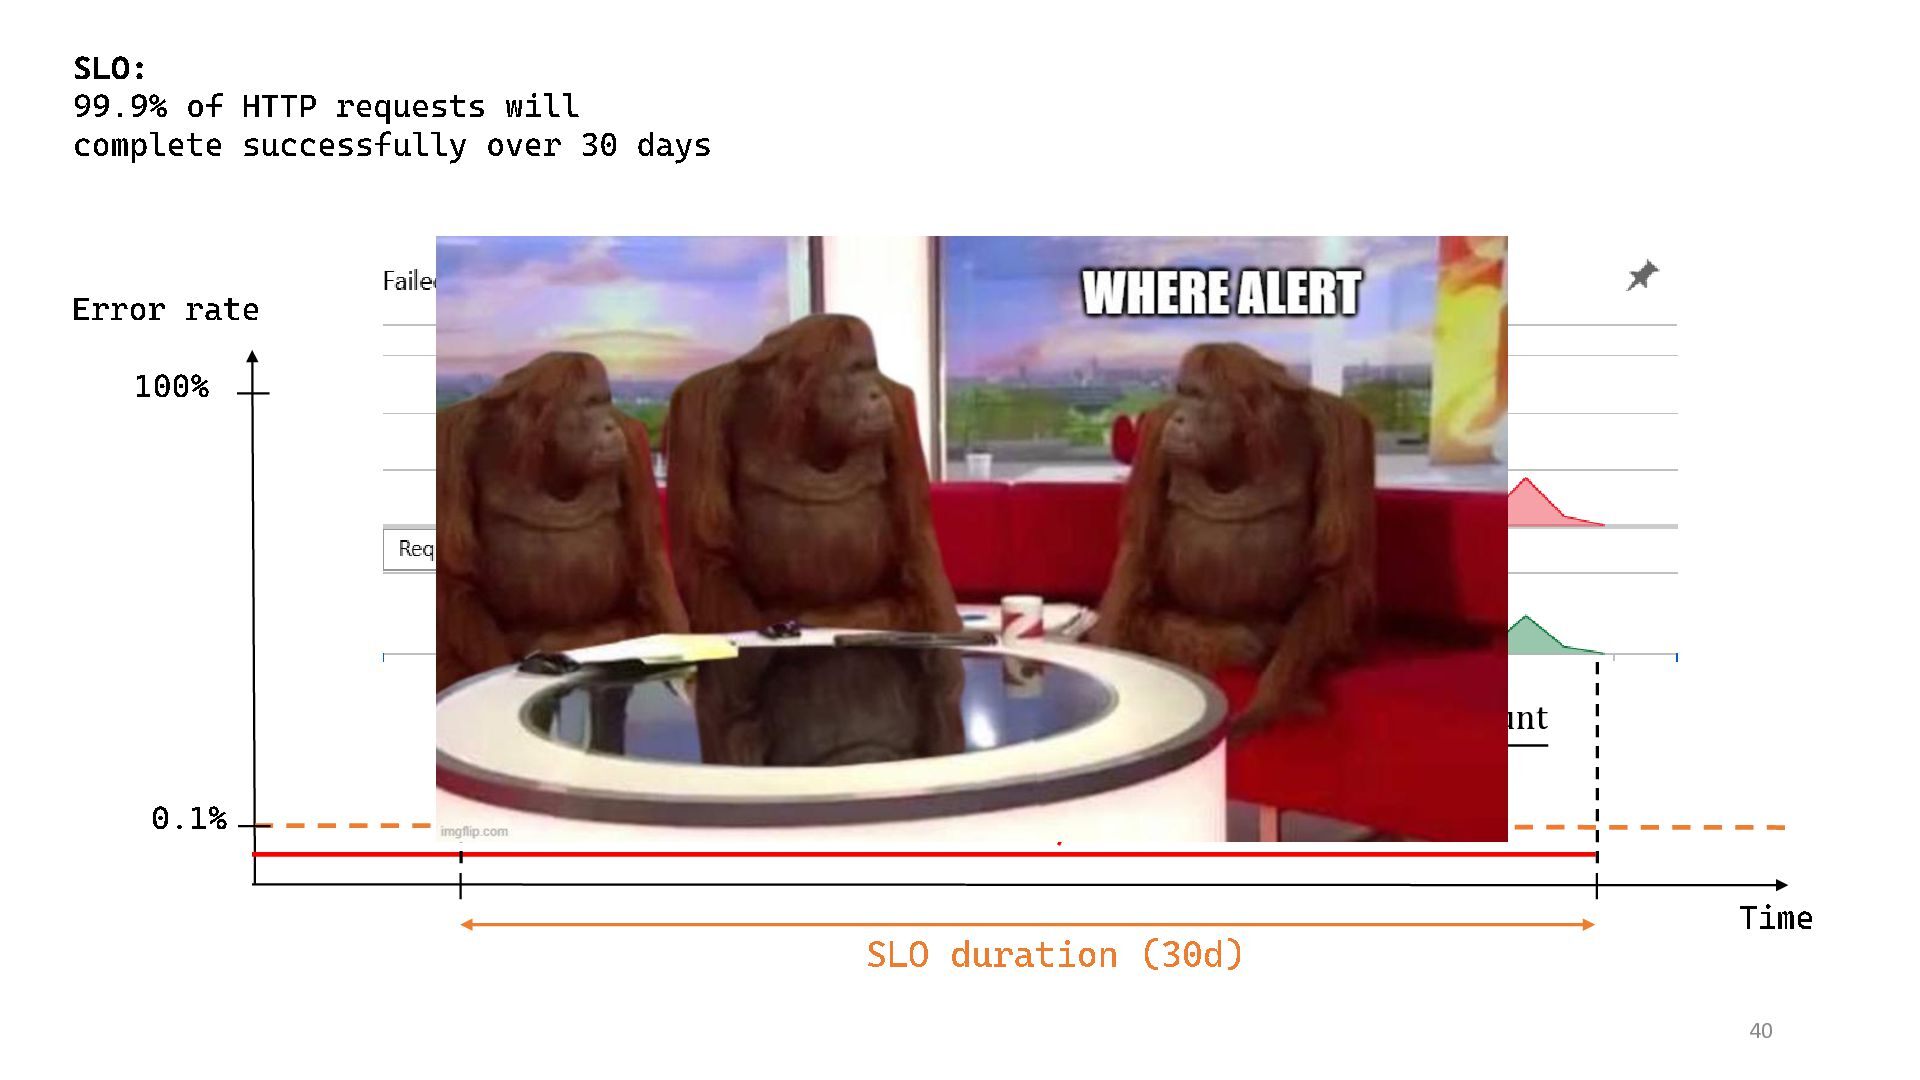
  25. 40 100% 0.1% SLO target SLO duration (30d) = Failed

    request count Request count Error rate = 1 − SLO Error rate SLO: 99.9% of HTTP requests will complete successfully over 30 days Time
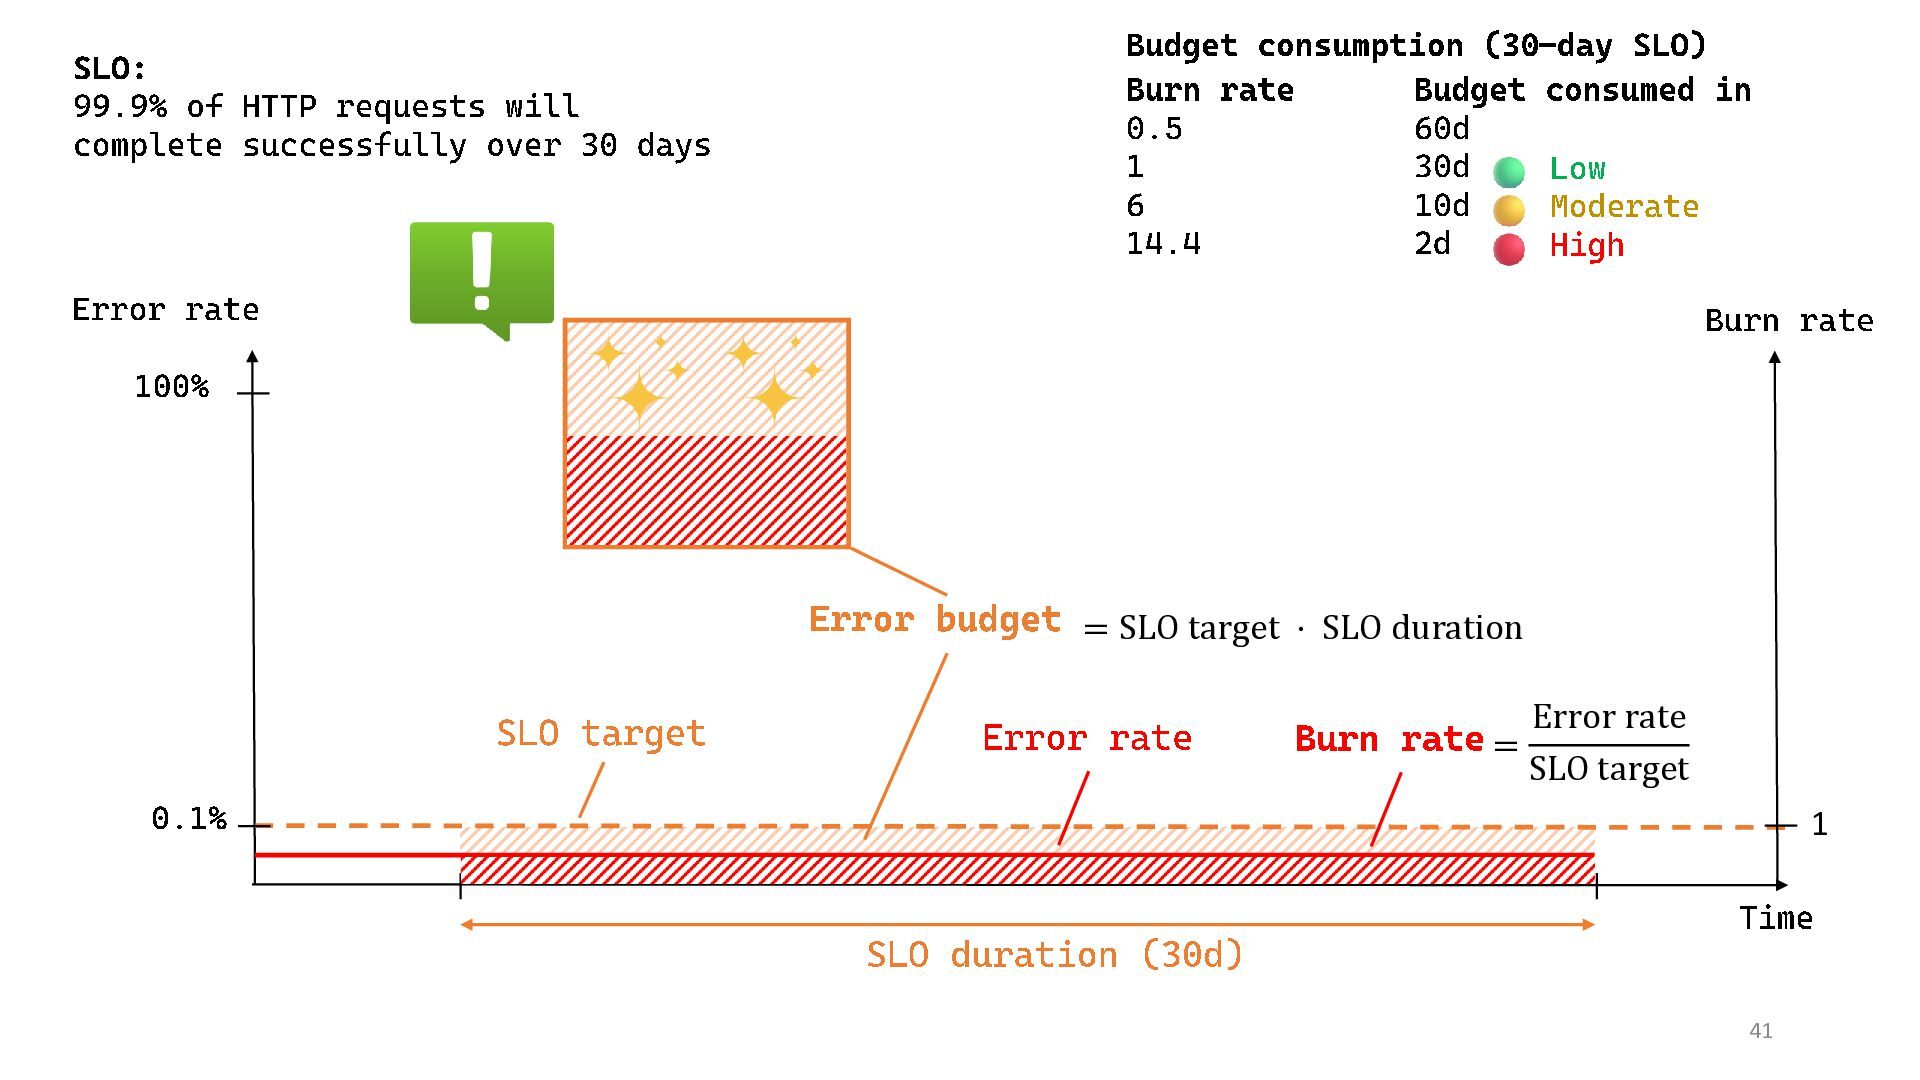
  26. 41 Time 100% 0.1% Error budget = SLO target ⋅

    SLO duration SLO target = Error rate SLO target Burn rate 1 Burn rate SLO duration (30d) Burn rate Budget consumed in 0.5 60d 1 30d 6 10d 14.4 2d Budget consumption (30 - day SLO) Low Moderate High Error rate Error rate SLO: 99.9% of HTTP requests will complete successfully over 30 days
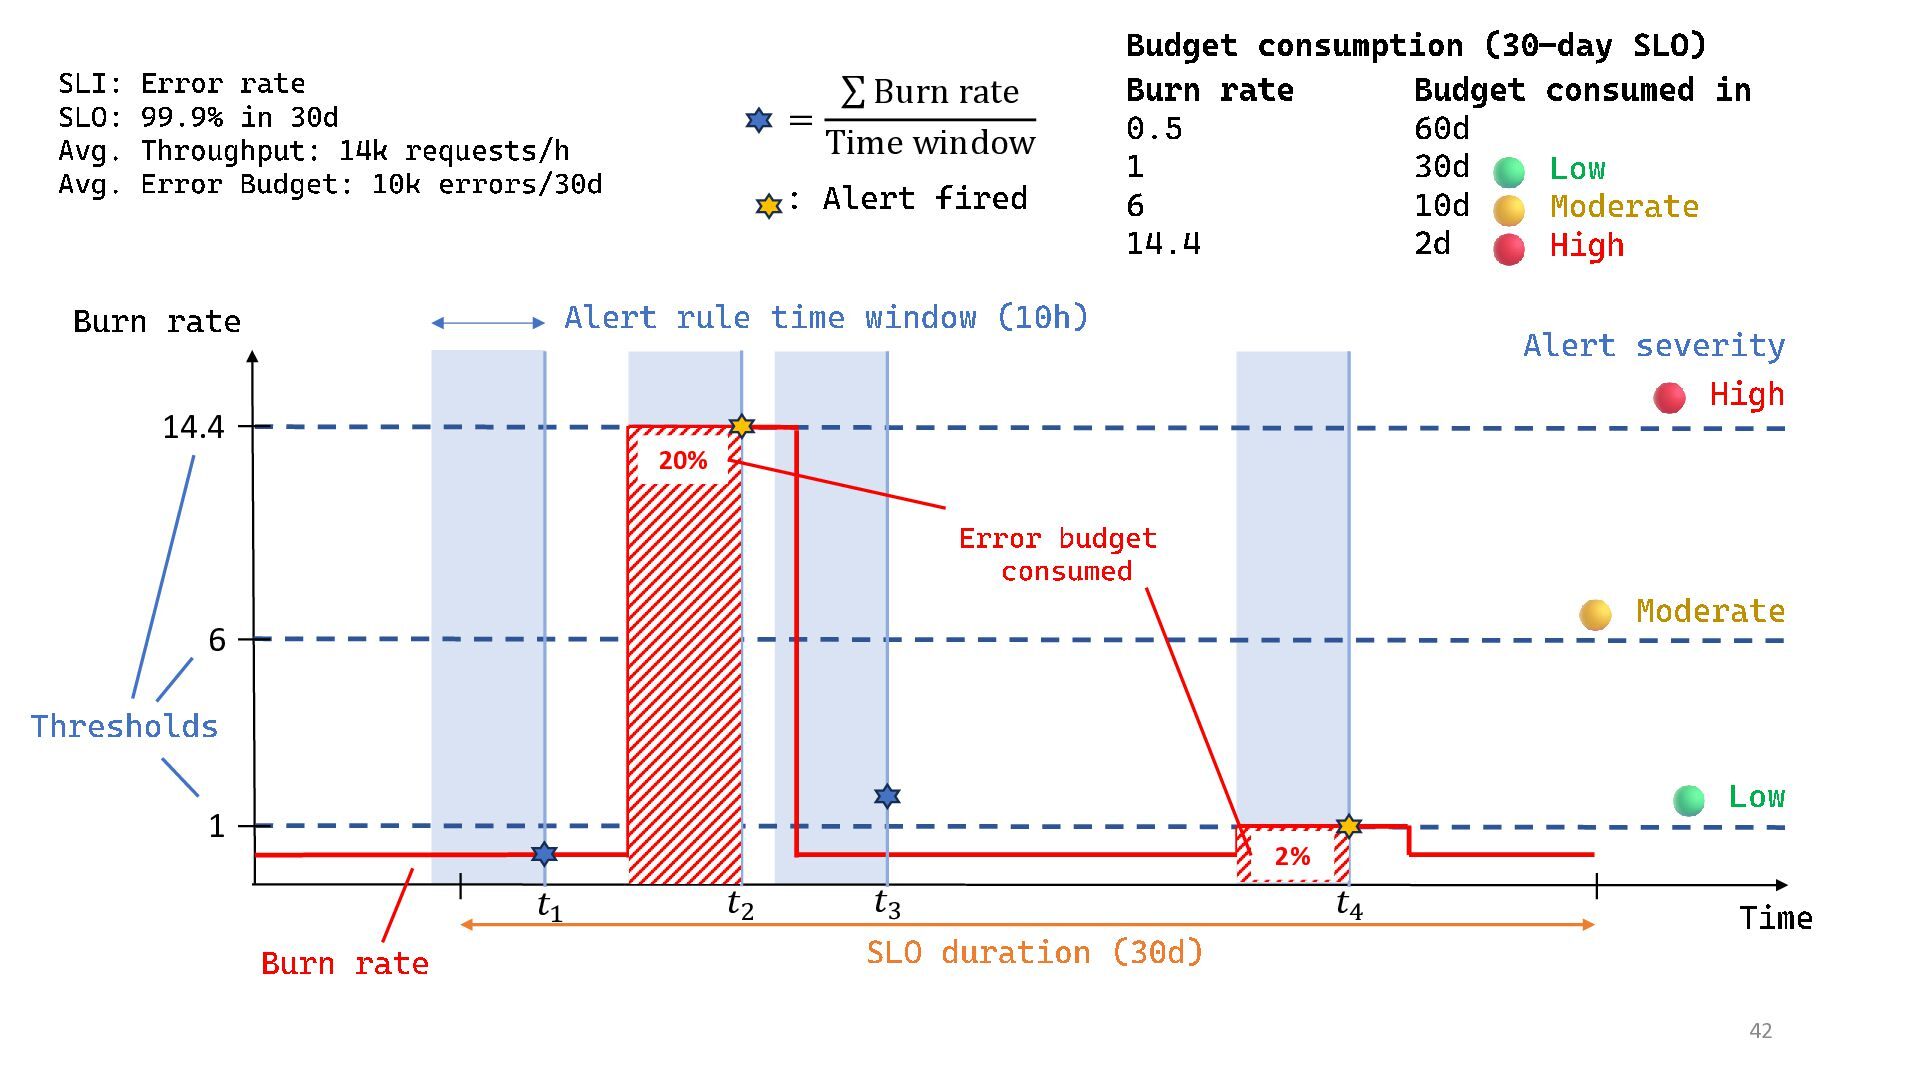
  27. 42 Time 1 Burn rate SLO duration (30d) Burn rate

    High 6 14.4 Alert rule time window (10h) Thresholds Moderate Low = σ Burn rate Time window : Alert fired Alert severity SLI: Error rate SLO: 99.9% in 30d Avg. Throughput: 14k requests/h Avg. Error Budget: 10k errors/30d 20% 2% Error budget consumed Burn rate Budget consumed in 0.5 60d 1 30d 6 10d 14.4 2d Budget consumption (30 - day SLO) Low Moderate High 𝑡1 𝑡2 𝑡3 𝑡4
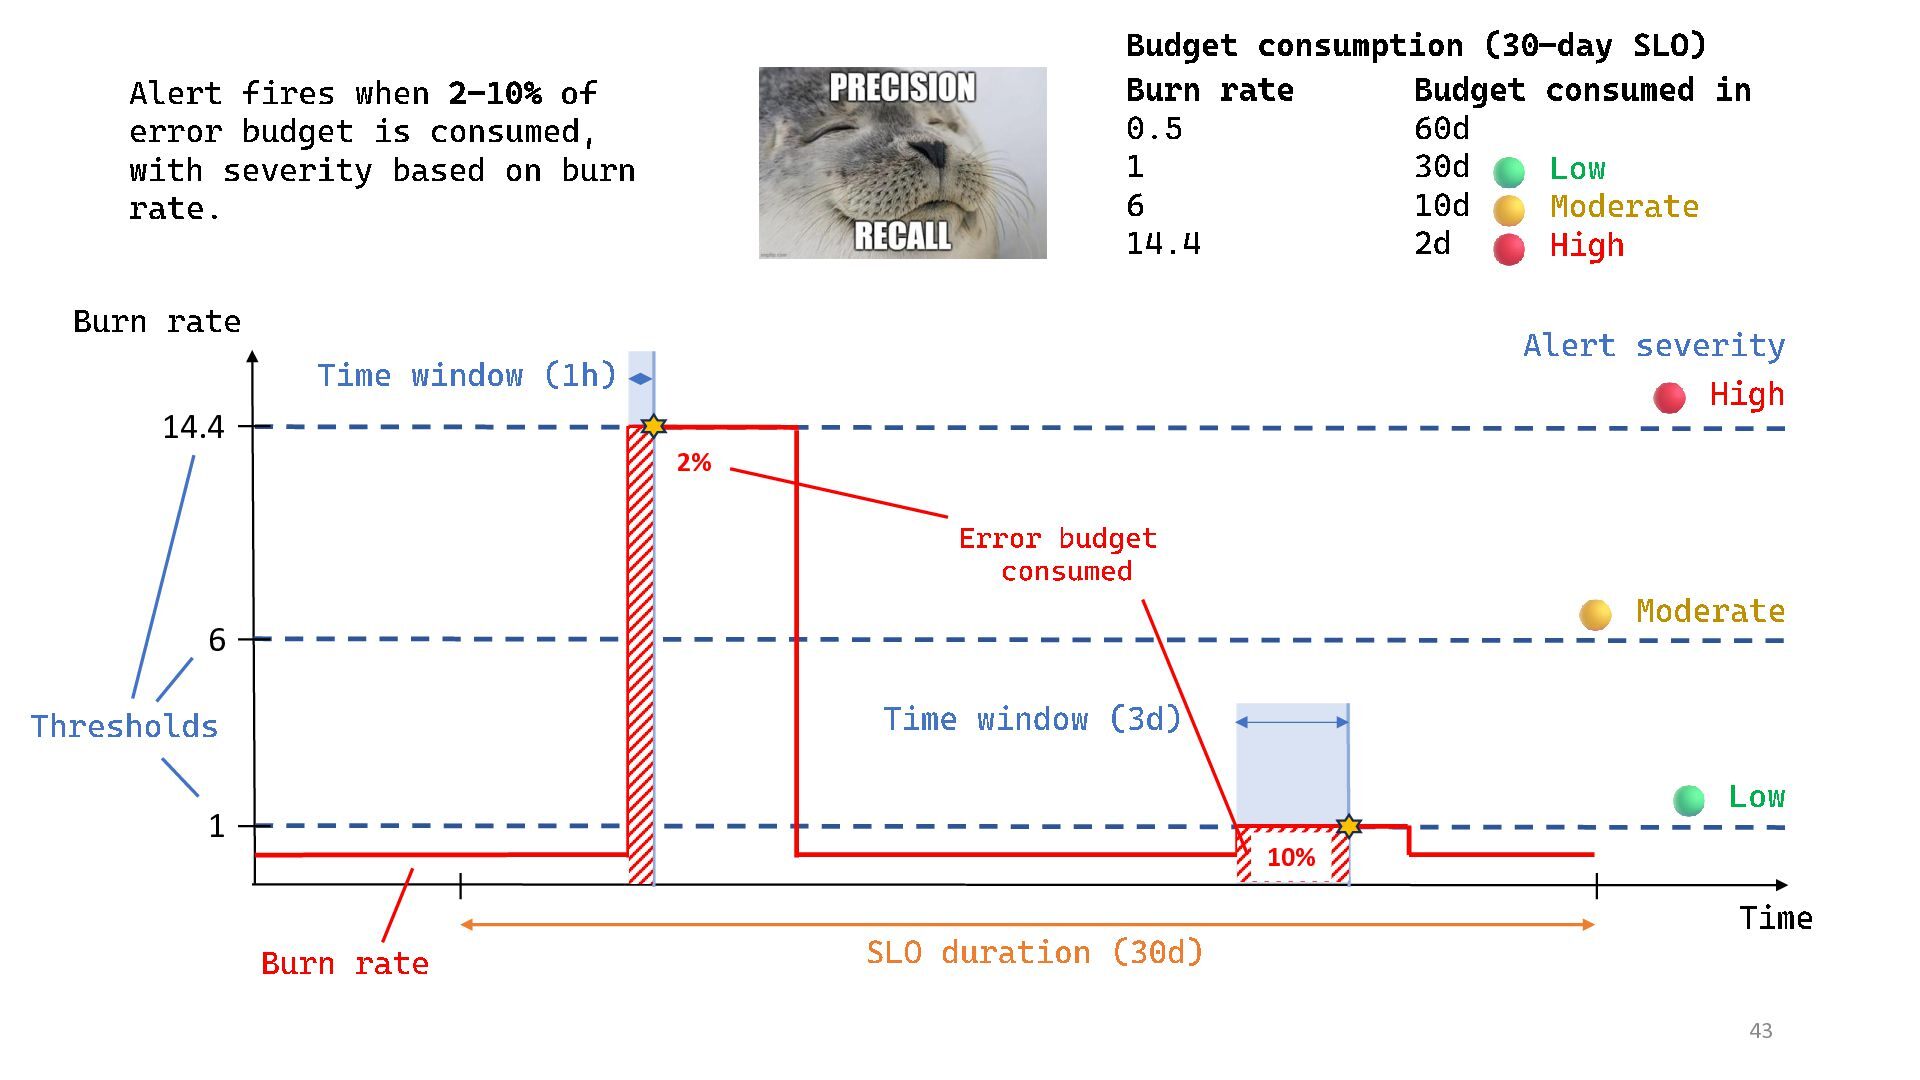
  28. 43 1 Burn rate SLO duration (30d) 6 14.4 Thresholds

    Alert fires when 2- 10% of error budget is consumed, with severity based on burn rate. High Moderate Low Alert severity Burn rate Time 2% 10% Time window (1h) Time window (3d) Error budget consumed Burn rate Budget consumed in 0.5 60d 1 30d 6 10d 14.4 2d Budget consumption (30 - day SLO) Low Moderate High
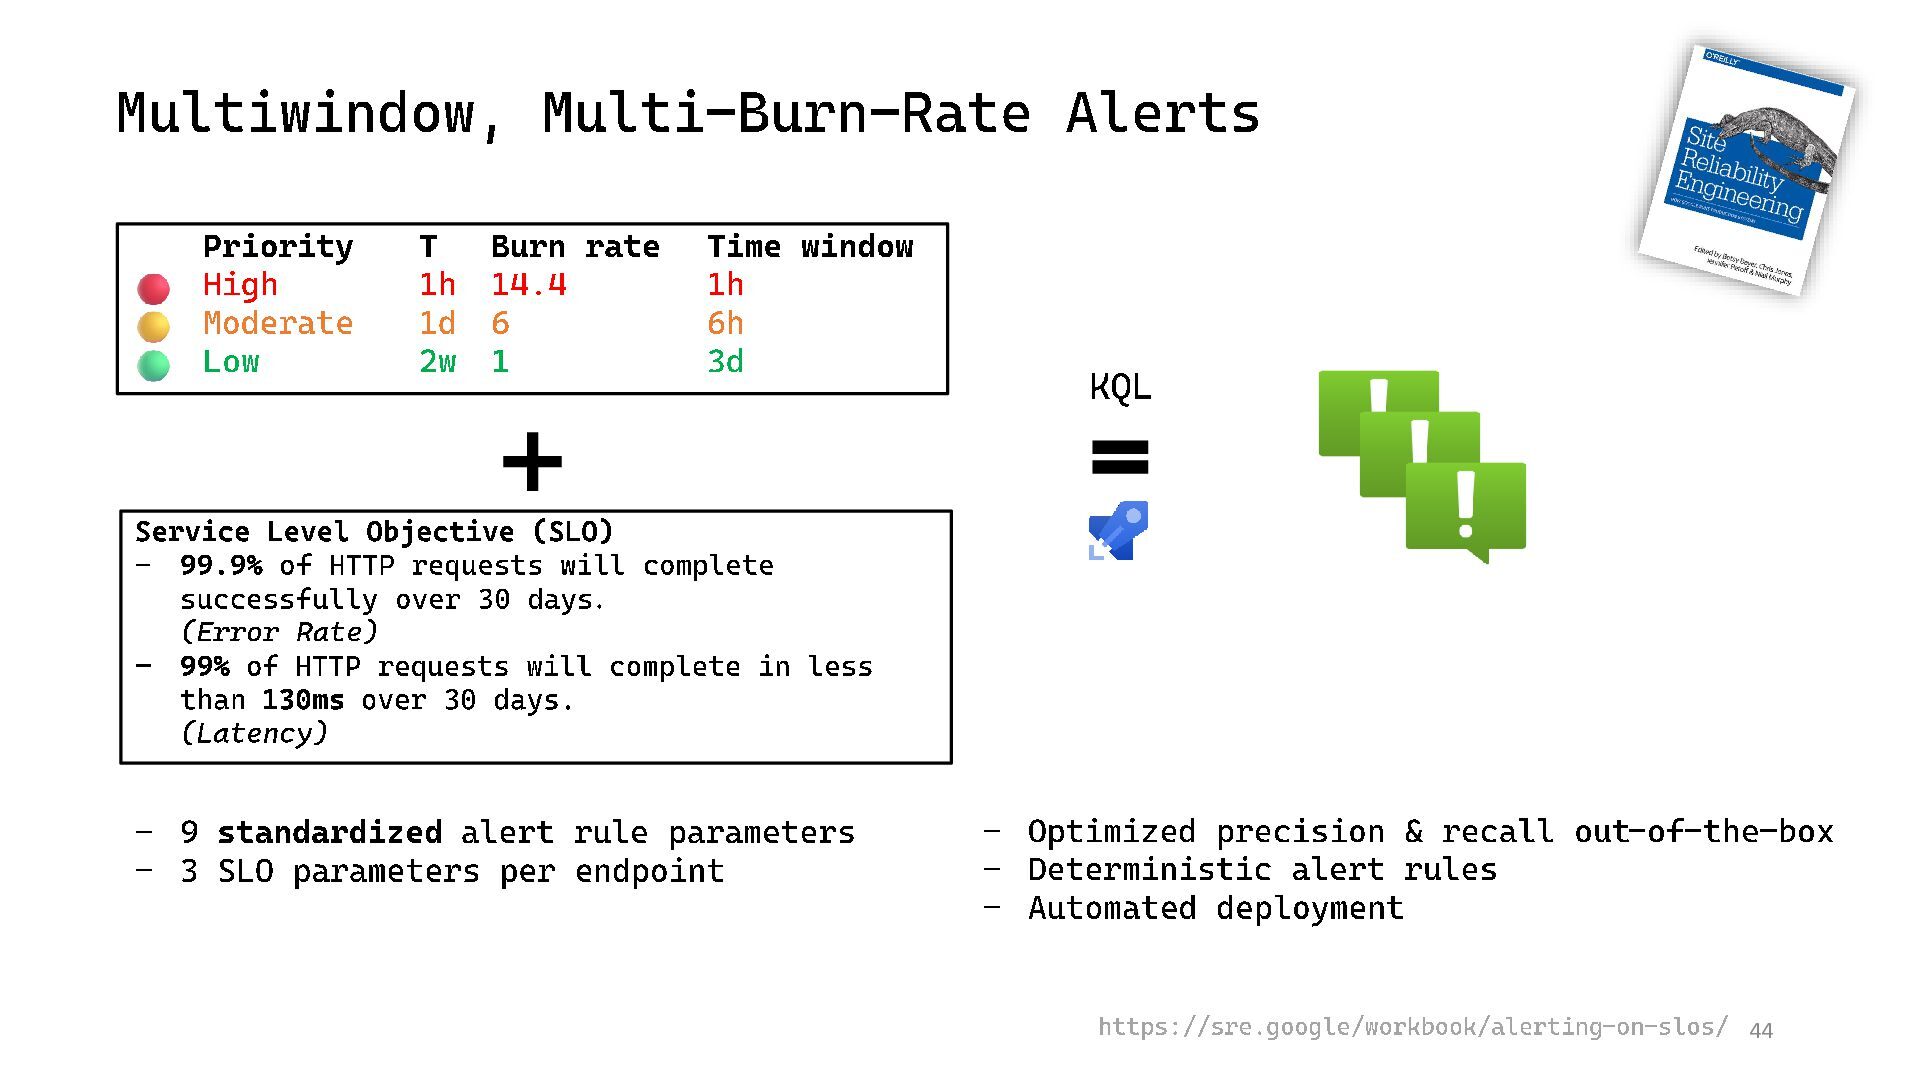
  29. Multiwindow, Multi - Burn - Rate Alerts 44 https://sre.google/workbook/alerting -

    on- slos/ Priority T Burn rate Time window High 1h 14.4 1h Moderate 1d 6 6h Low 2w 1 3d Service Level Objective (SLO) - 99.9% of HTTP requests will complete successfully over 30 days . (Error Rate) - 99% of HTTP requests will complete in less than 130ms over 30 days. (Latency) KQL - 9 standardized alert rule parameters - 3 SLO parameters per endpoint - Optimized precision & recall out - of - the - box - Deterministic alert rules - Automated deployment
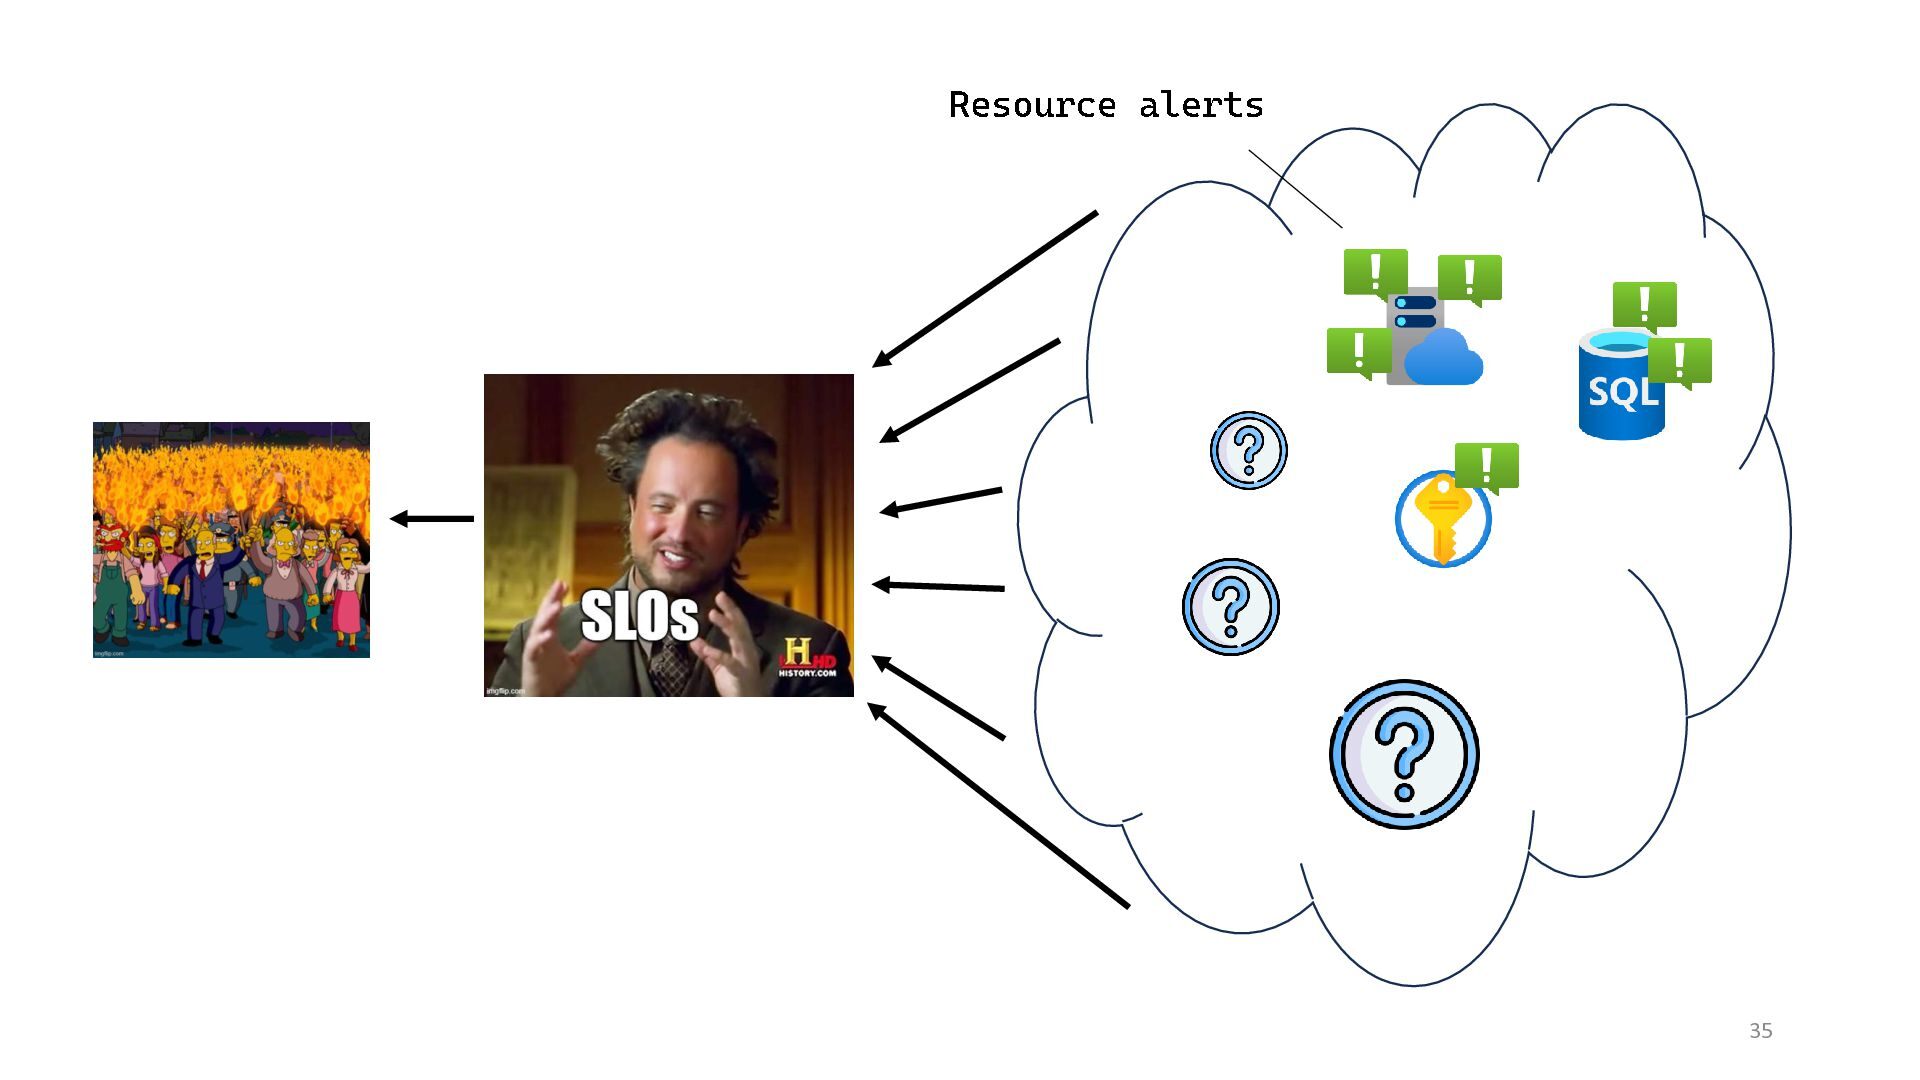
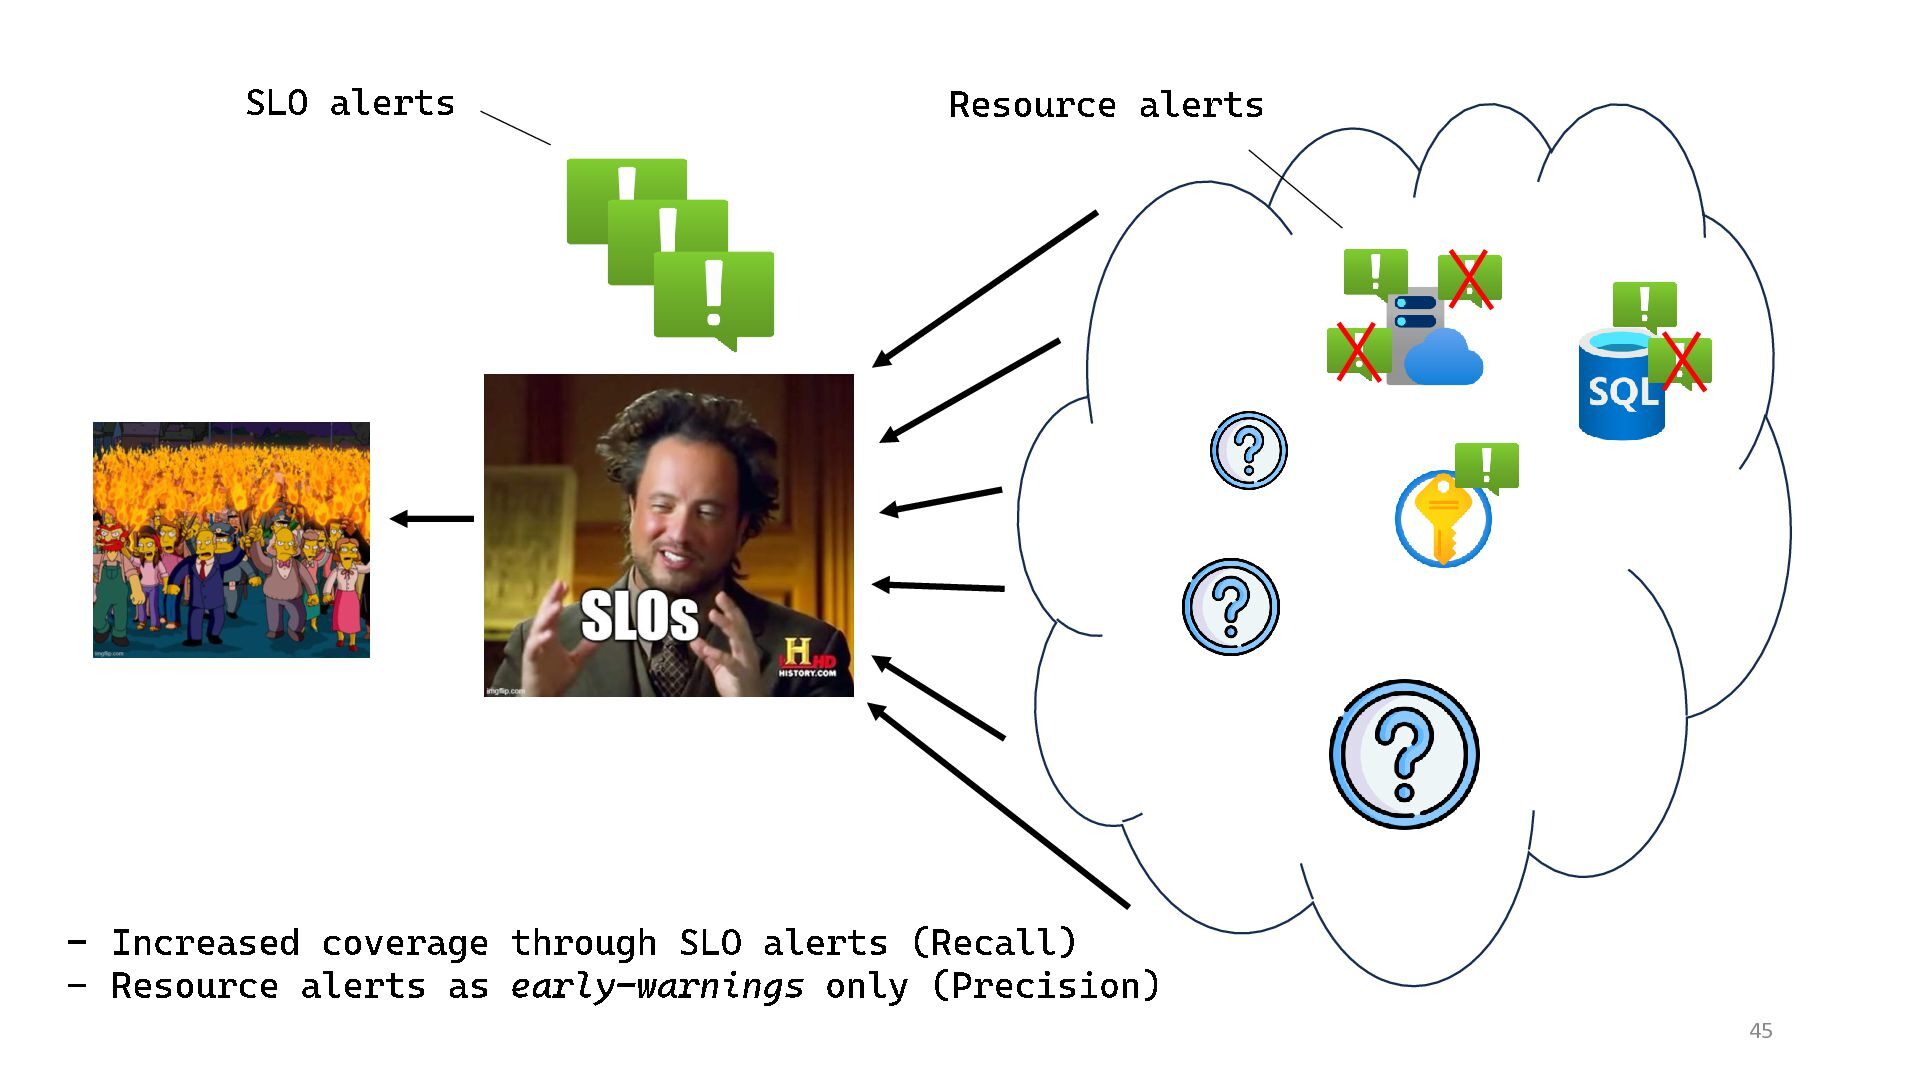
  30. 45 Resource alerts SLO alerts - Increased coverage through SLO

    alerts (Recall) - Resource alerts as early - warnings only (Precision)
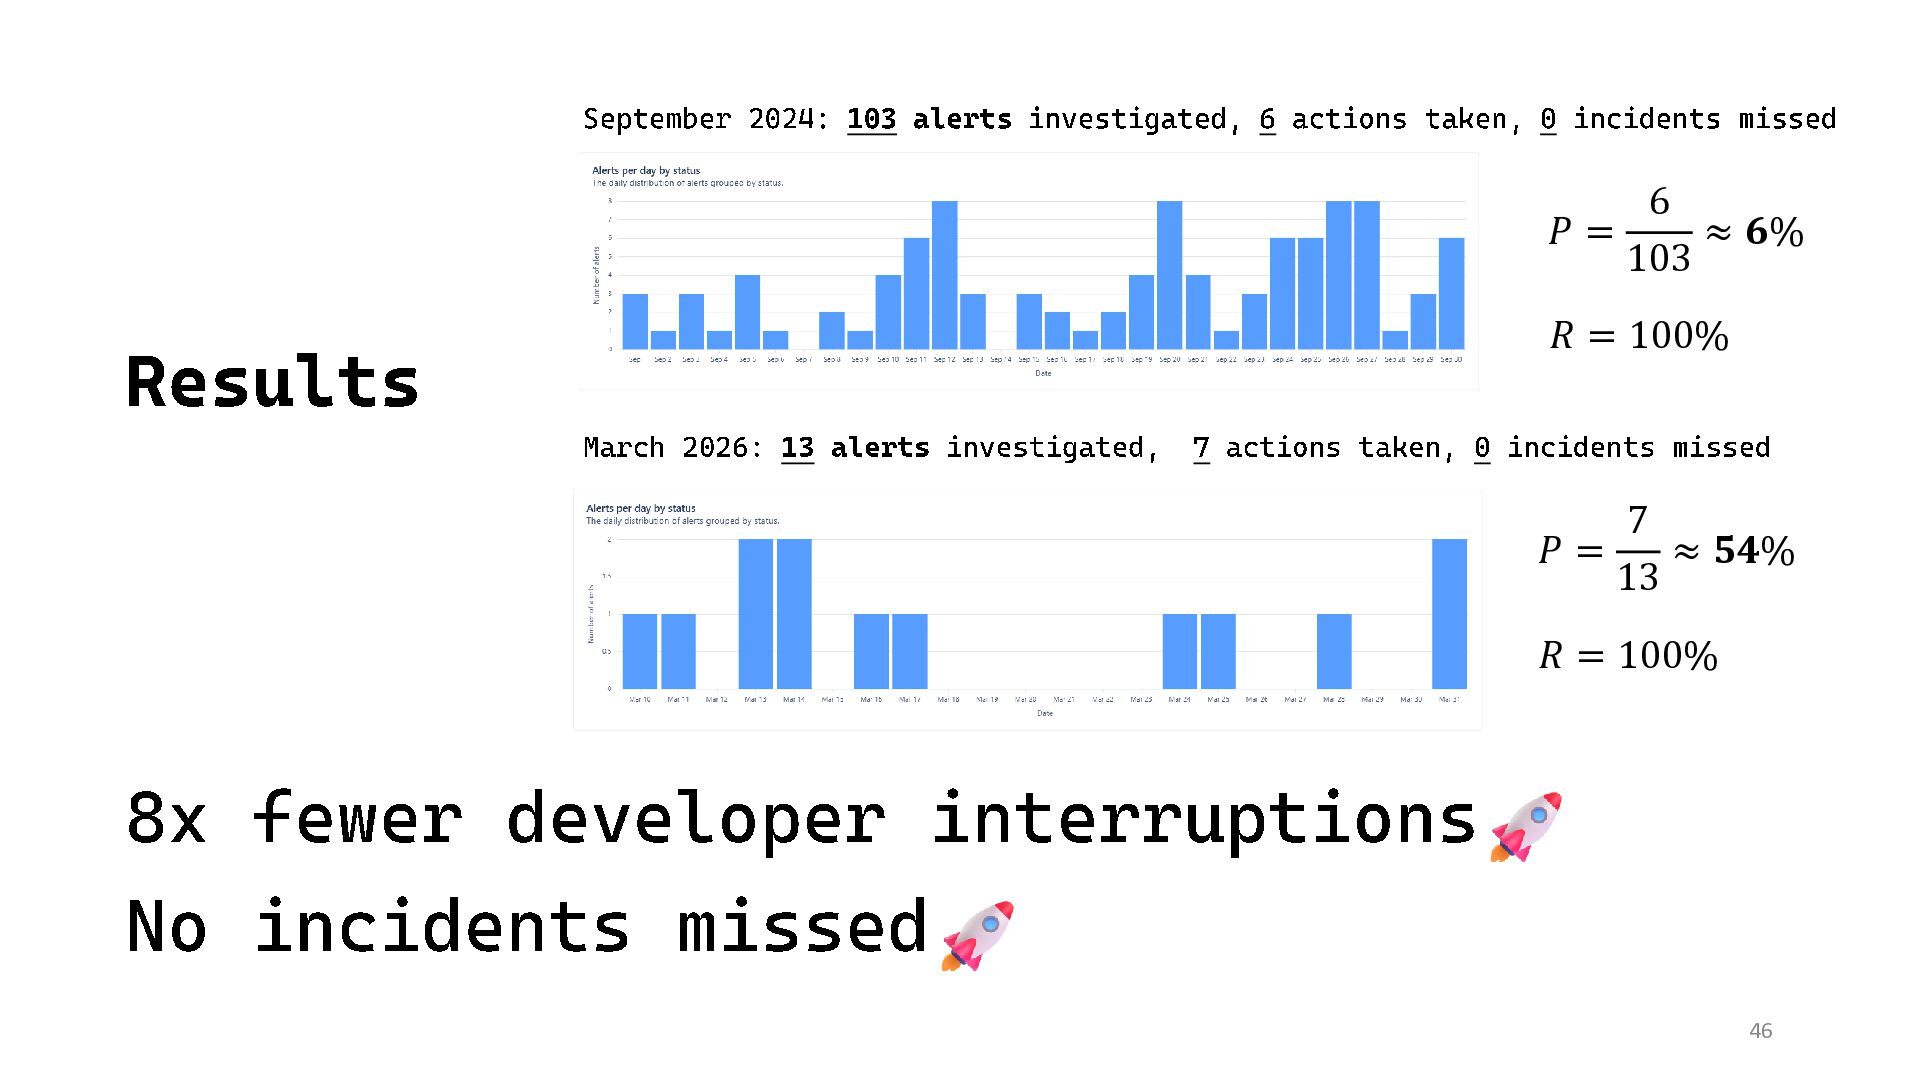
  31. September 2024: 103 alerts investigated, 6 actions taken, 0 incidents

    missed March 2026: 13 alerts investigated, 7 actions taken, 0 incidents missed 𝑃 = 6 103 ≈ 𝟔% 𝑅 = 100% 𝑃 = 7 13 ≈ 𝟓𝟒% 𝑅 = 100% 46 8x fewer developer interruptions Results No incidents missed
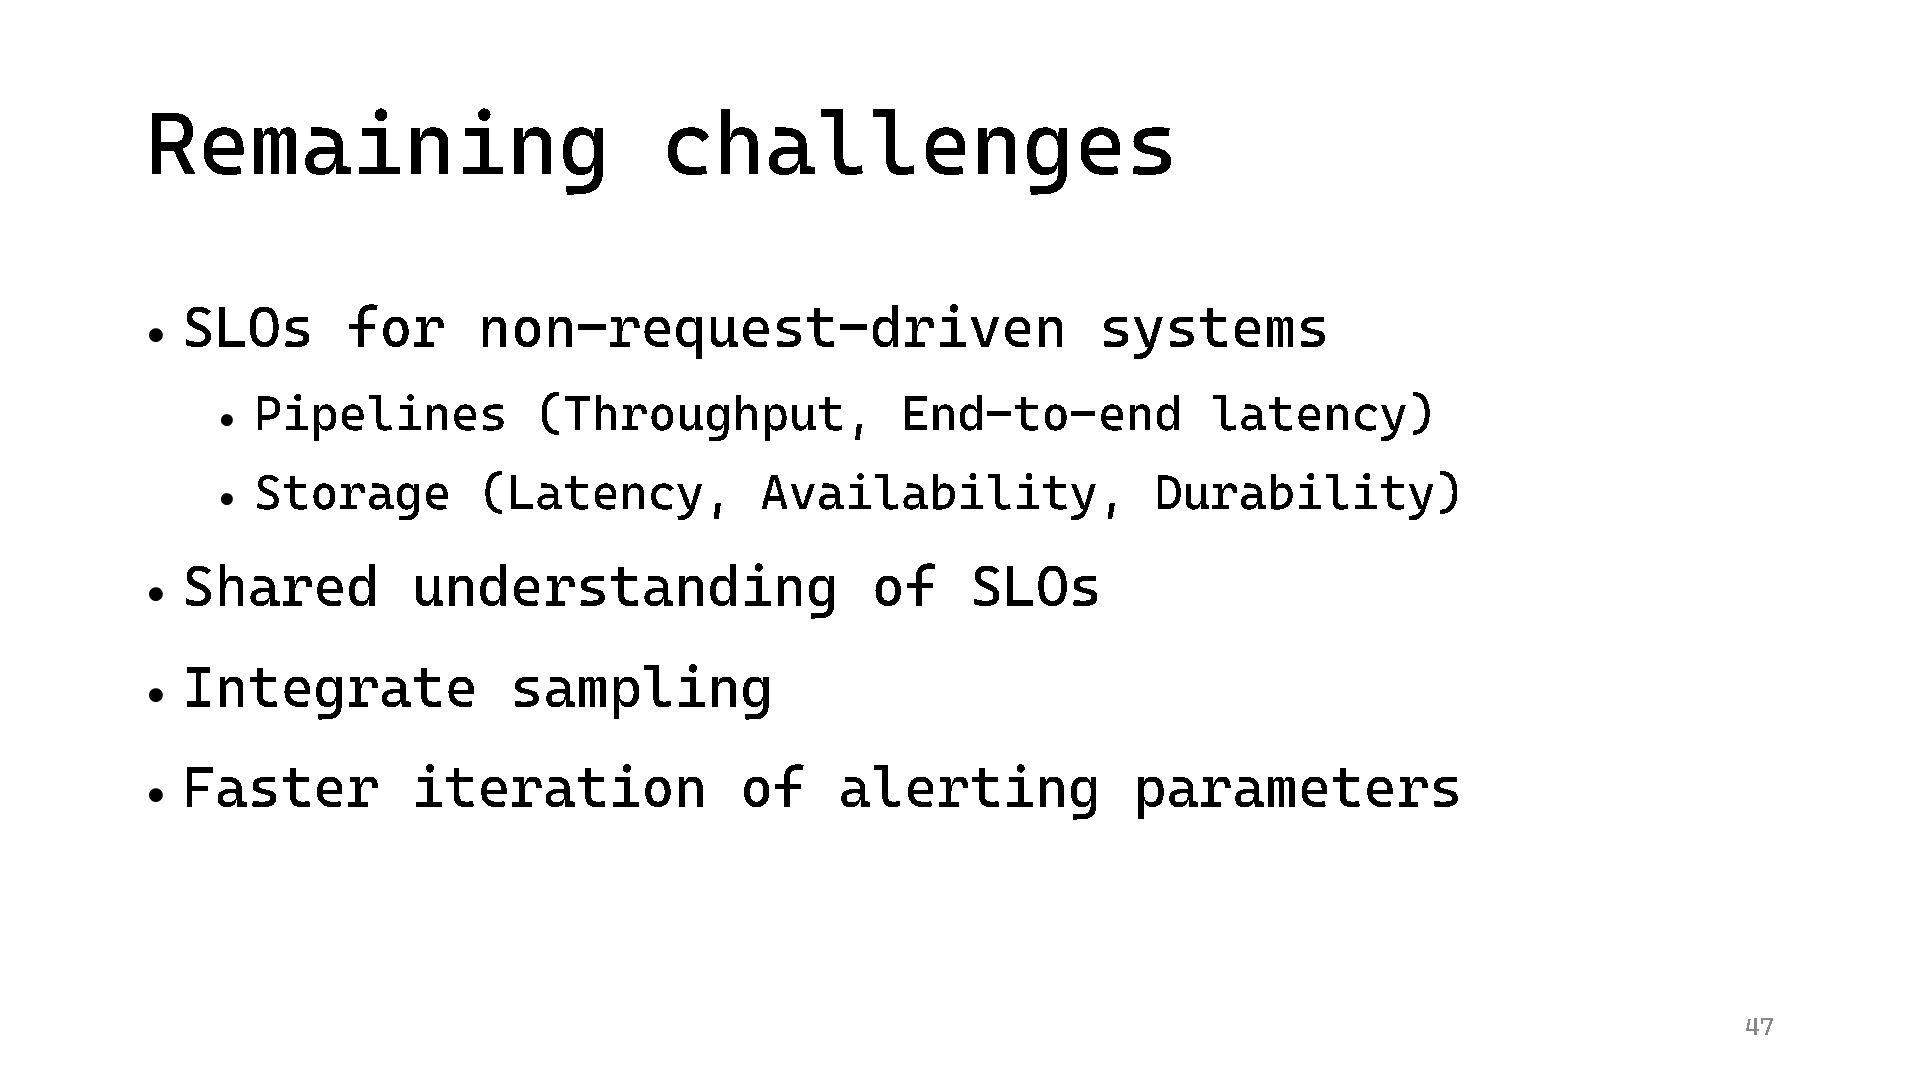
  32. Remaining challenges • SLOs for non - request - driven

    systems • Pipelines (Throughput, End - to - end latency) • Storage (Latency, Availability, Durability) • Shared understanding of SLOs • Integrate sampling • Faster iteration of alerting parameters 47
  33. 49