A Server-to-Server View of the Internet, CoNEXT 2015.
A large-scale study of the effects of routing changes and congestion on the end-to-end latencies of server-to-server paths in the core of the Internet.
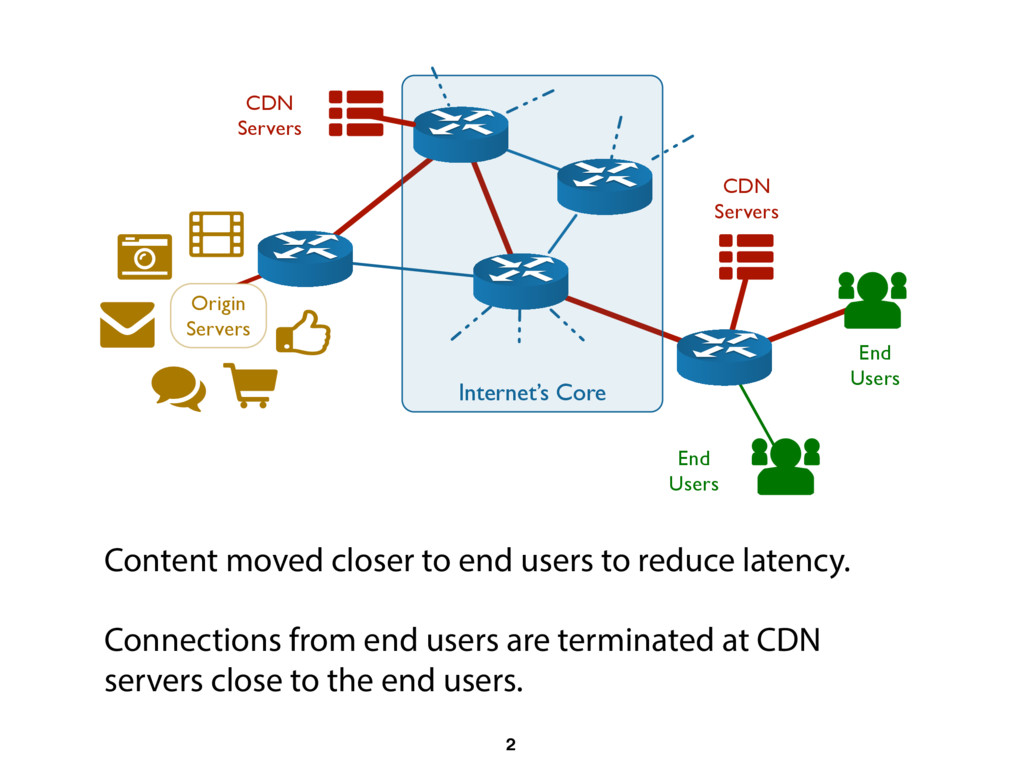
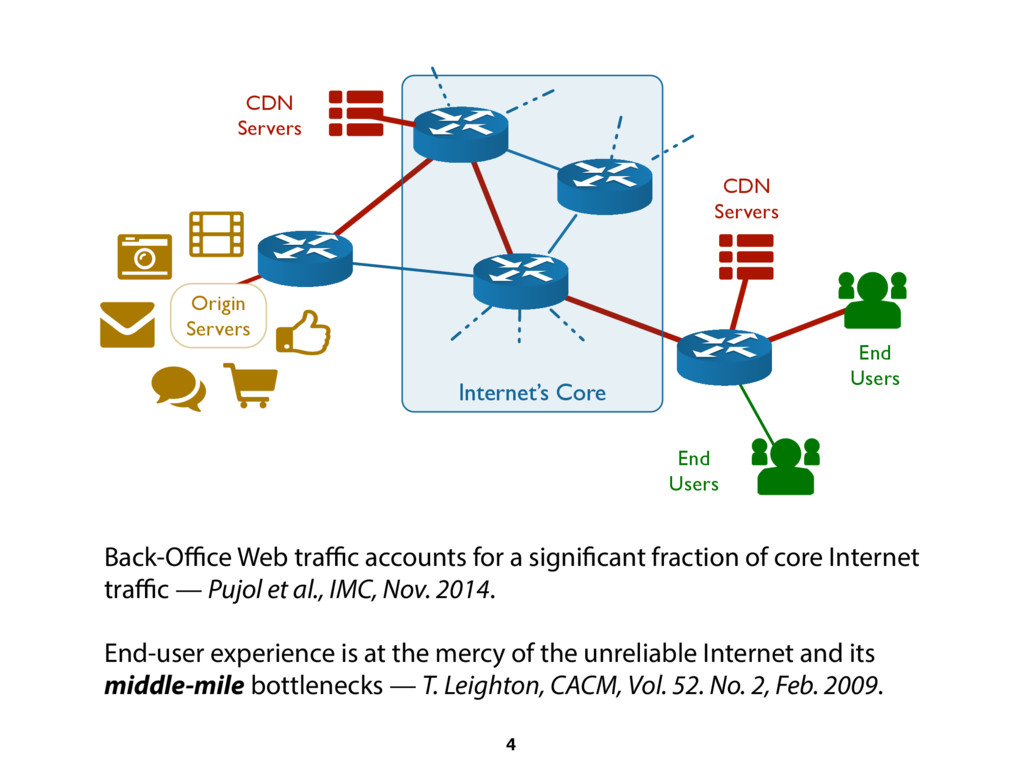
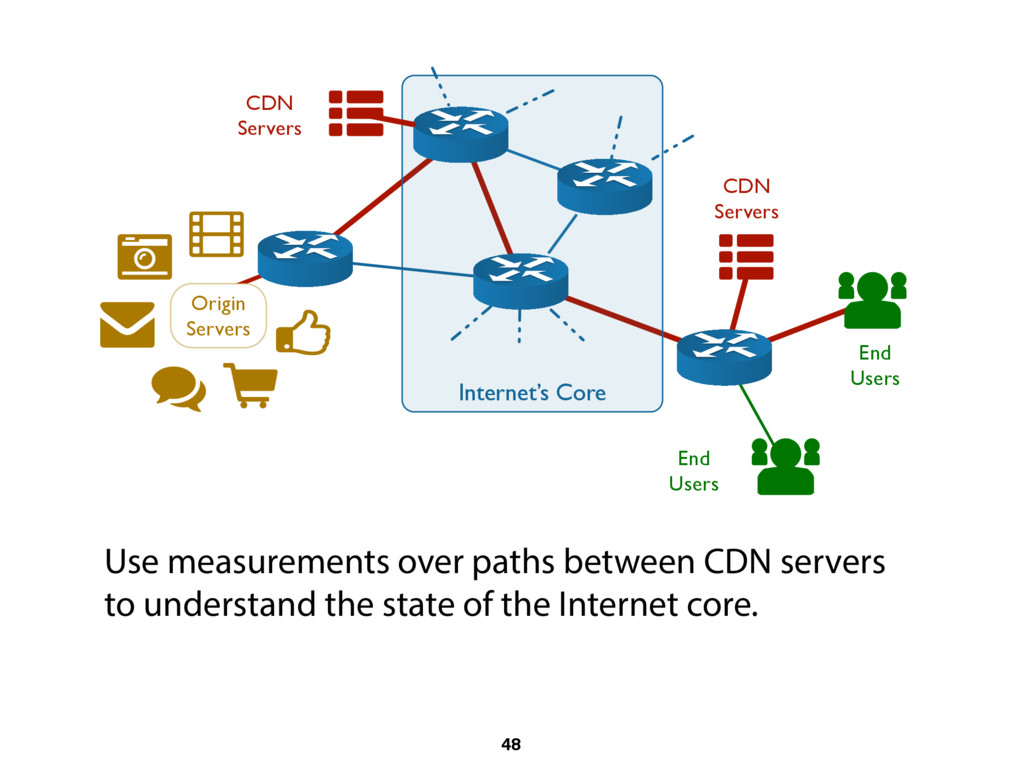
Internet traffic — Pujol et al., IMC, Nov. 2014. End-user experience is at the mercy of the unreliable Internet and its middle-mile bottlenecks — T. Leighton, CACM, Vol. 52. No. 2, Feb. 2009. 4 End Users End Users Origin Servers CDN Servers Internet’s Core CDN Servers
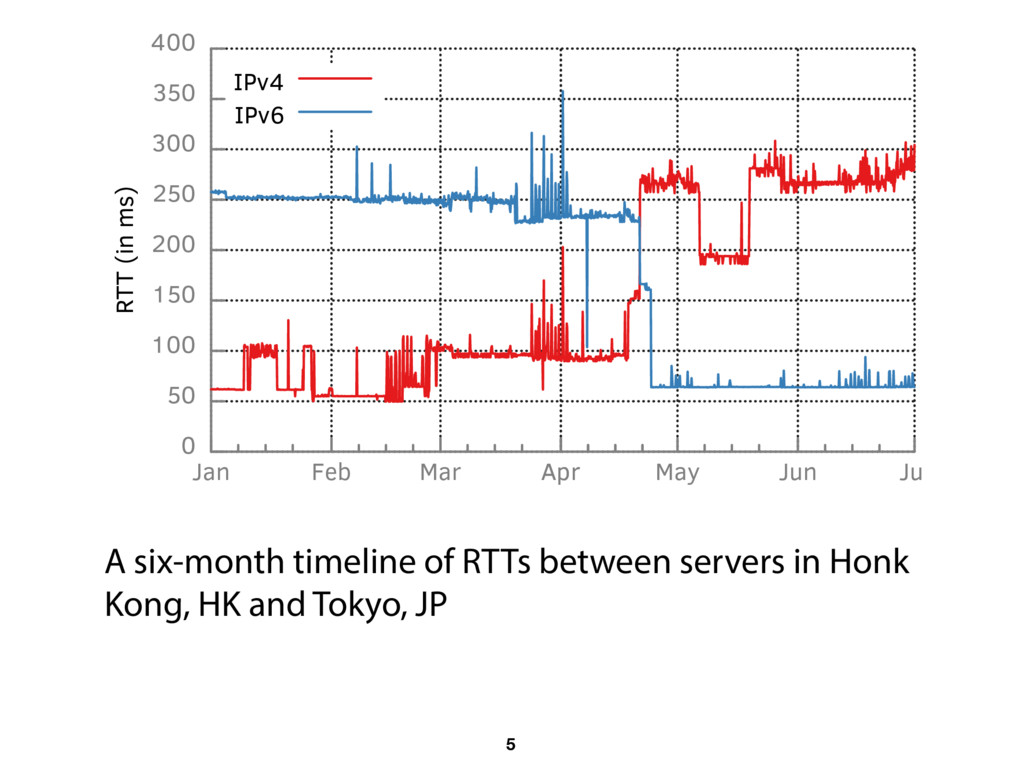
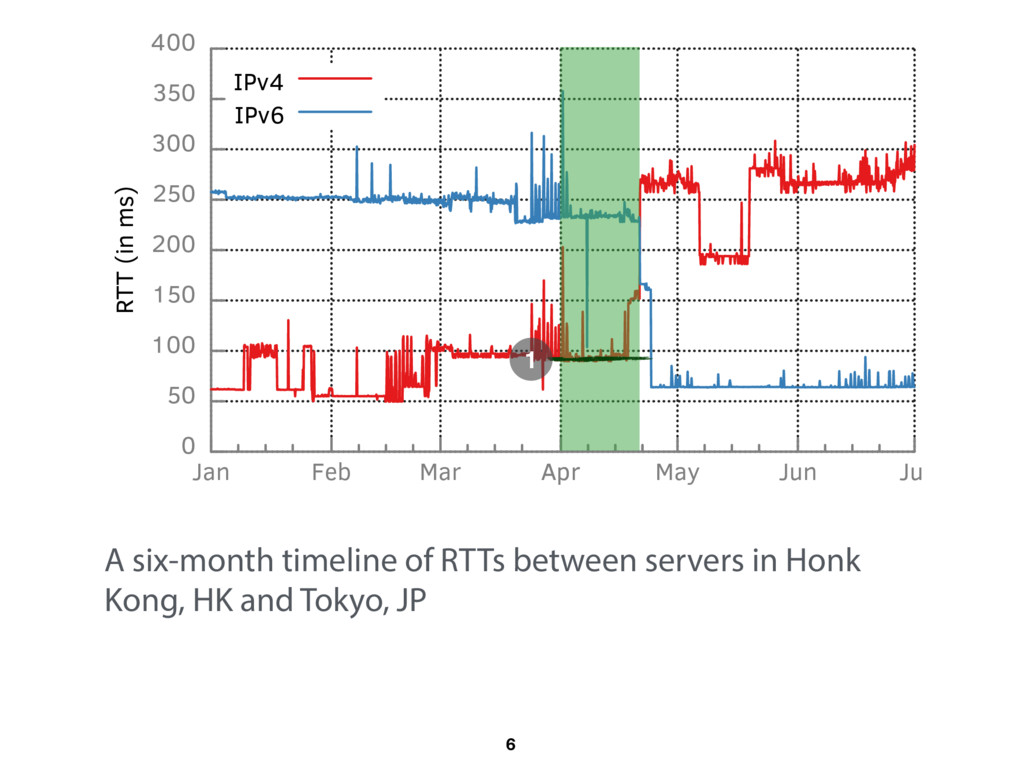
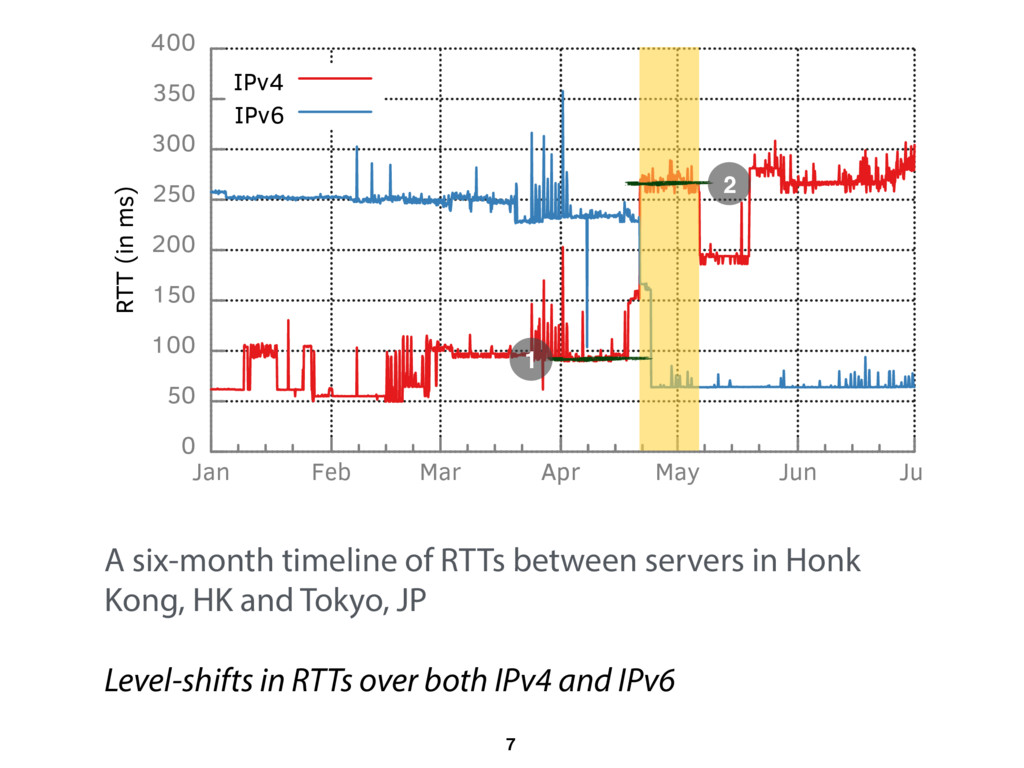
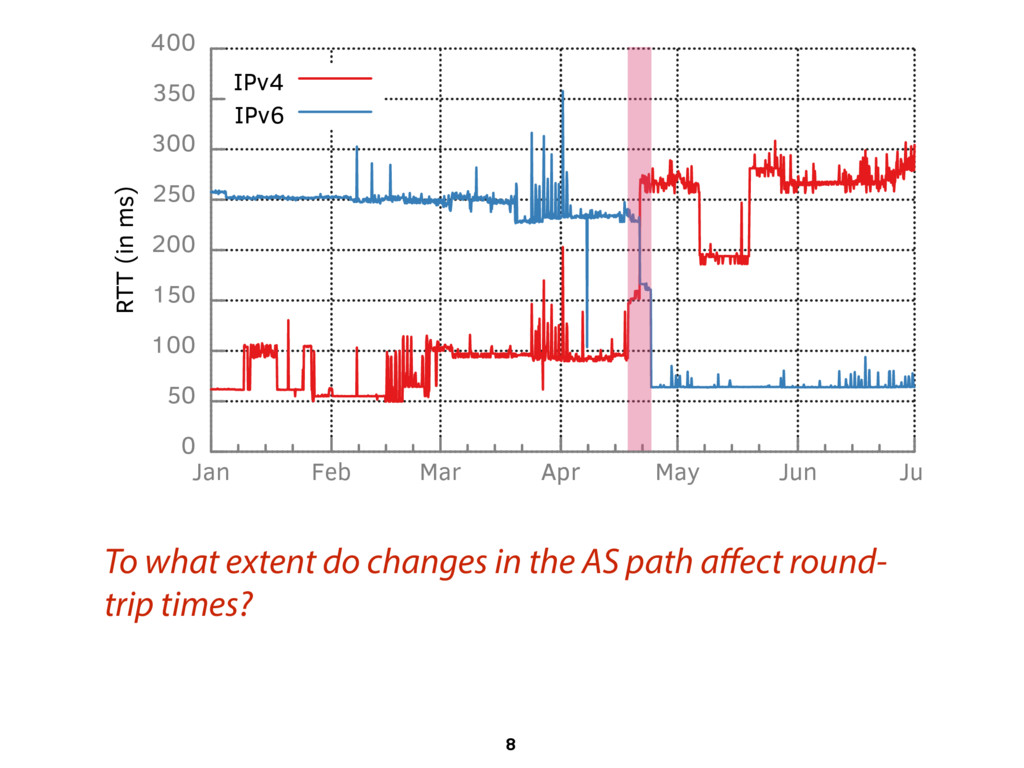
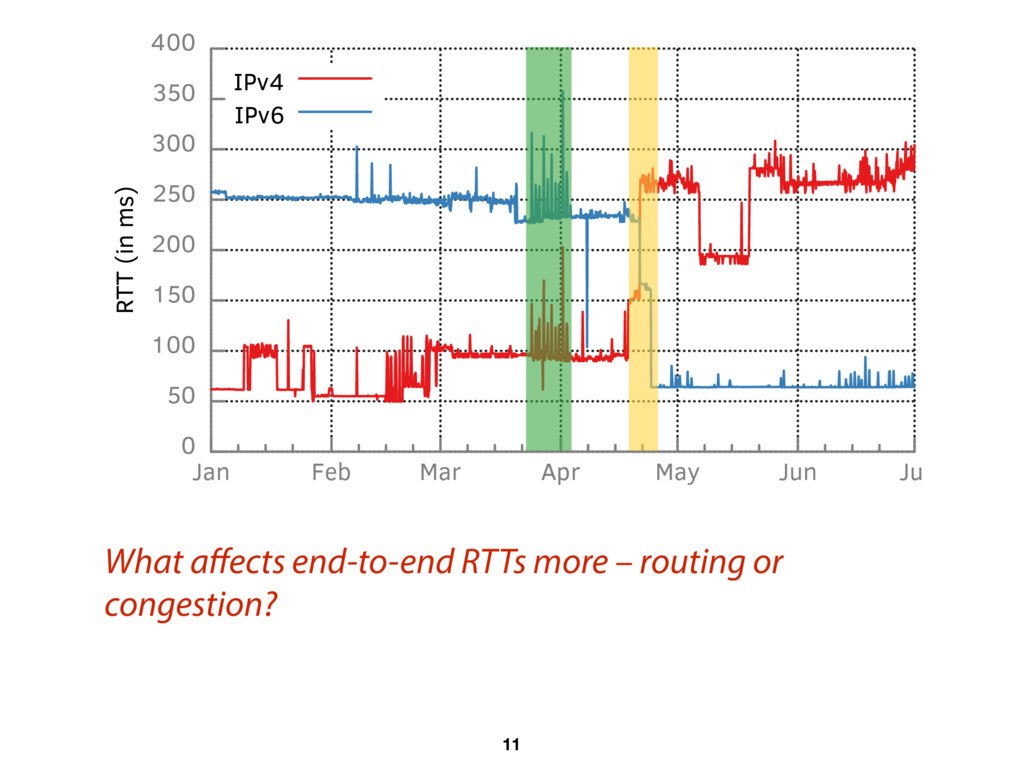
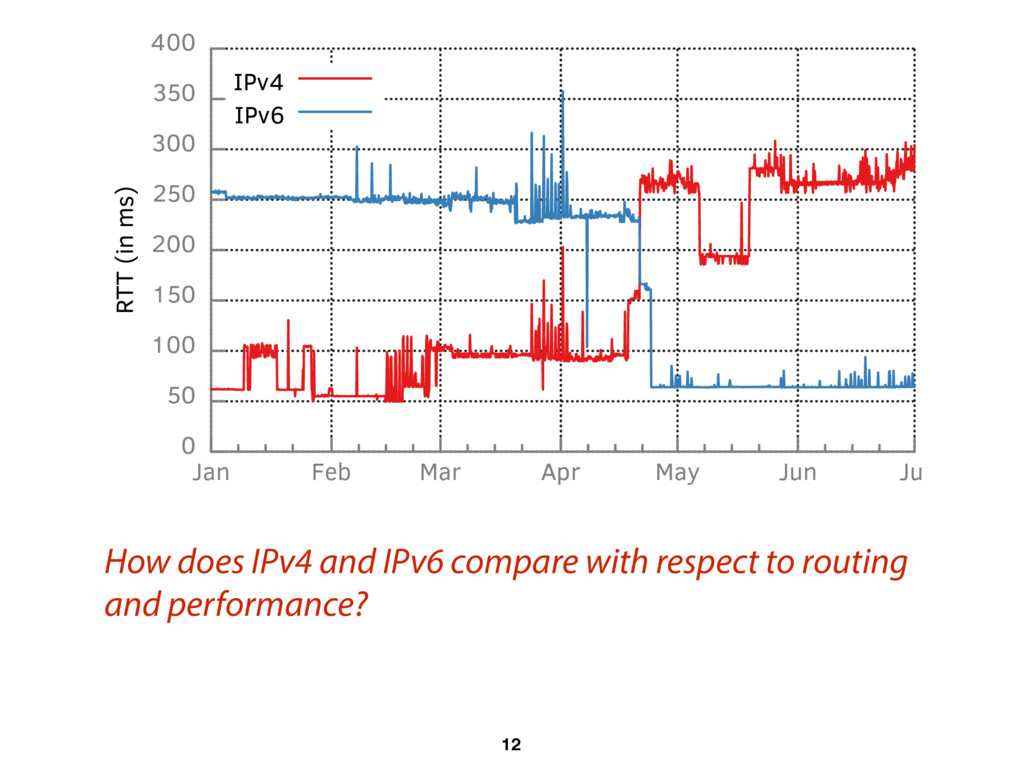
Feb Mar Apr Apr May Jun Jul RTT (in ms) IPv4 IPv6 A six-month timeline of RTTs between servers in Honk Kong, HK and Tokyo, JP Level-shifts in RTTs over both IPv4 and IPv6 7 2 1
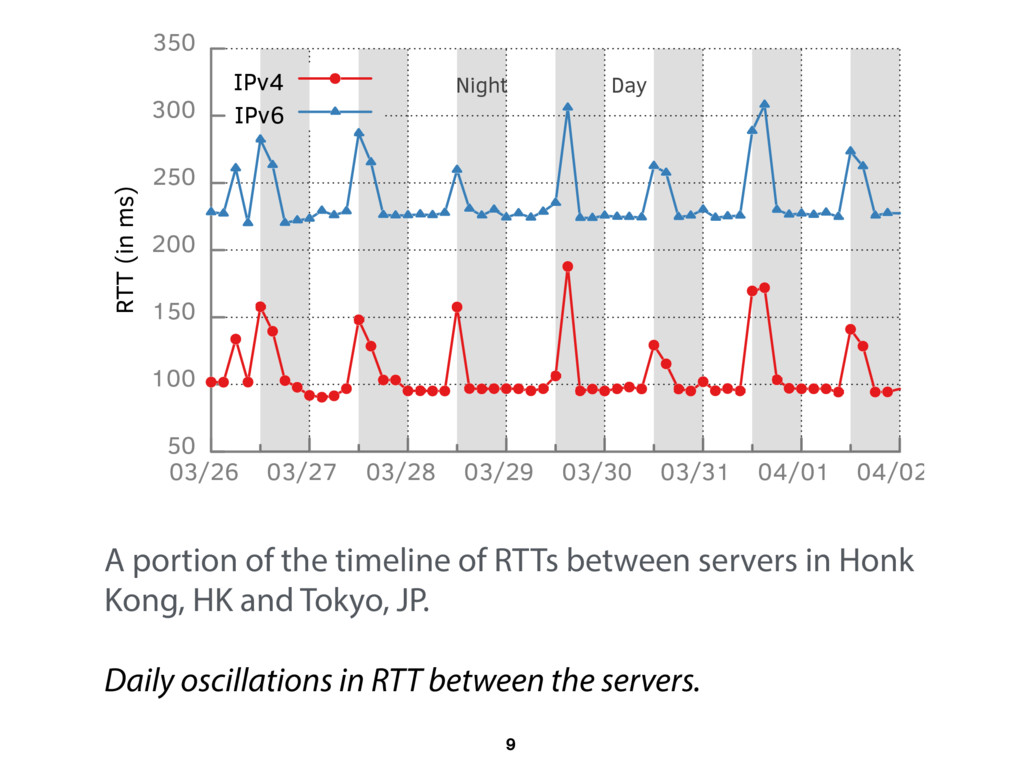
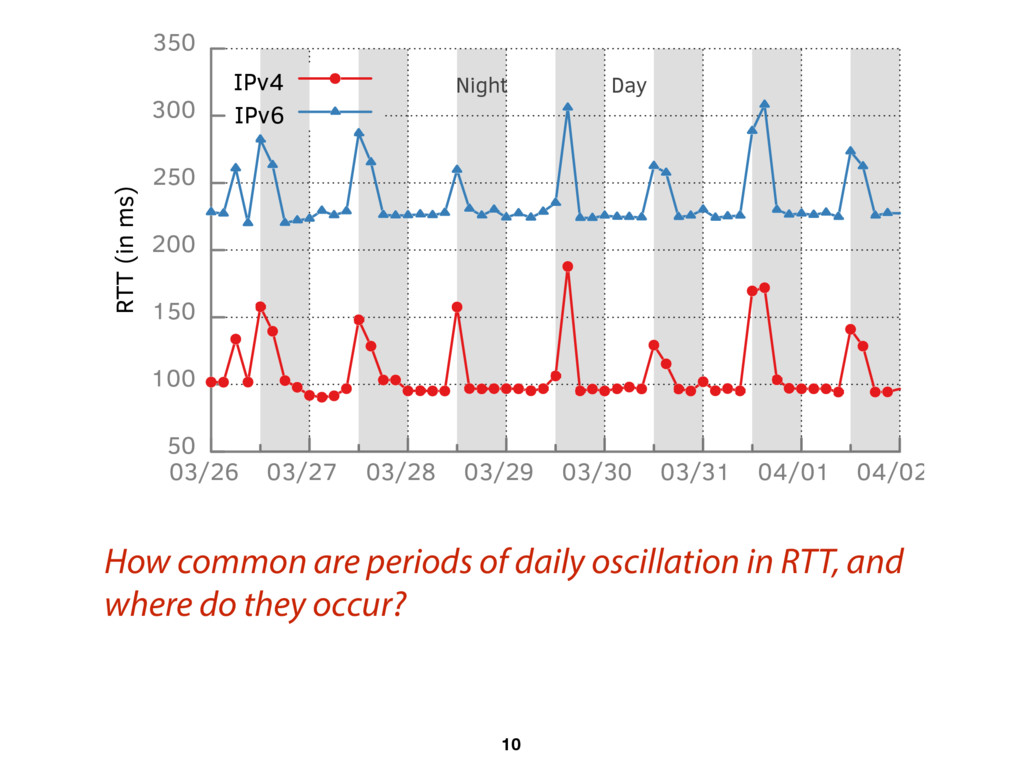
03/29 03/30 03/31 04/01 04/02 RTT (in ms) IPv4 IPv6 Night Day A portion of the timeline of RTTs between servers in Honk Kong, HK and Tokyo, JP. Daily oscillations in RTT between the servers. 9
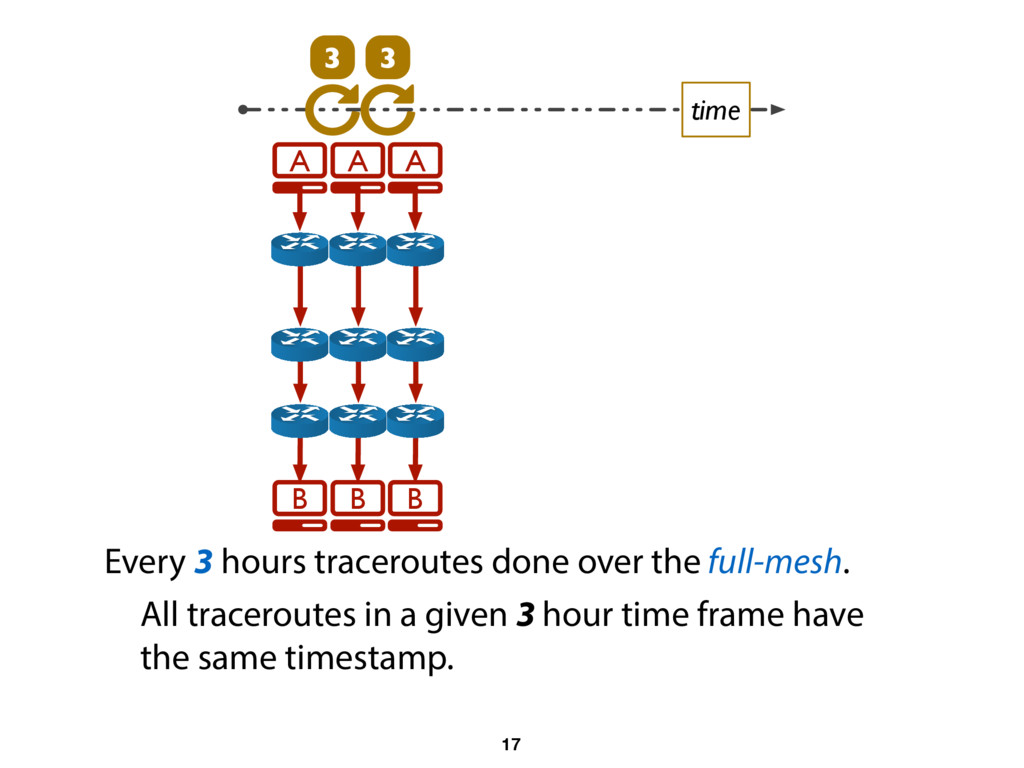
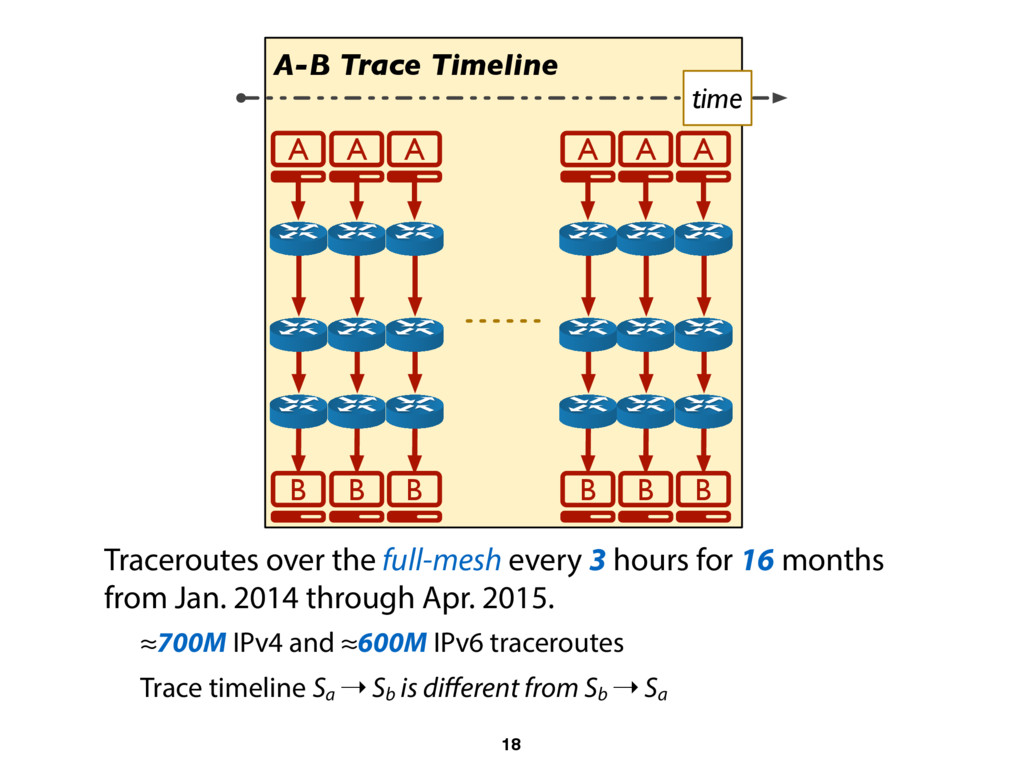
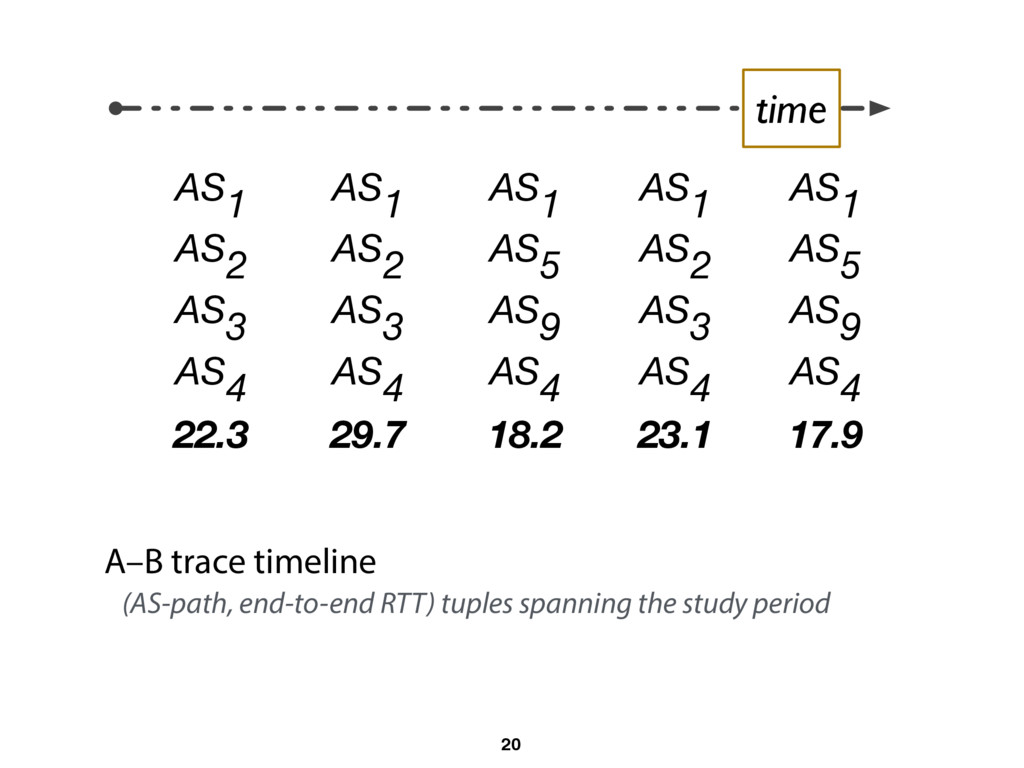
A B A B A B Traceroutes over the full-mesh every 3 hours for 16 months from Jan. 2014 through Apr. 2015. ≈700M IPv4 and ≈600M IPv6 traceroutes Trace timeline Sa ➝ Sb is different from Sb ➝ Sa 18
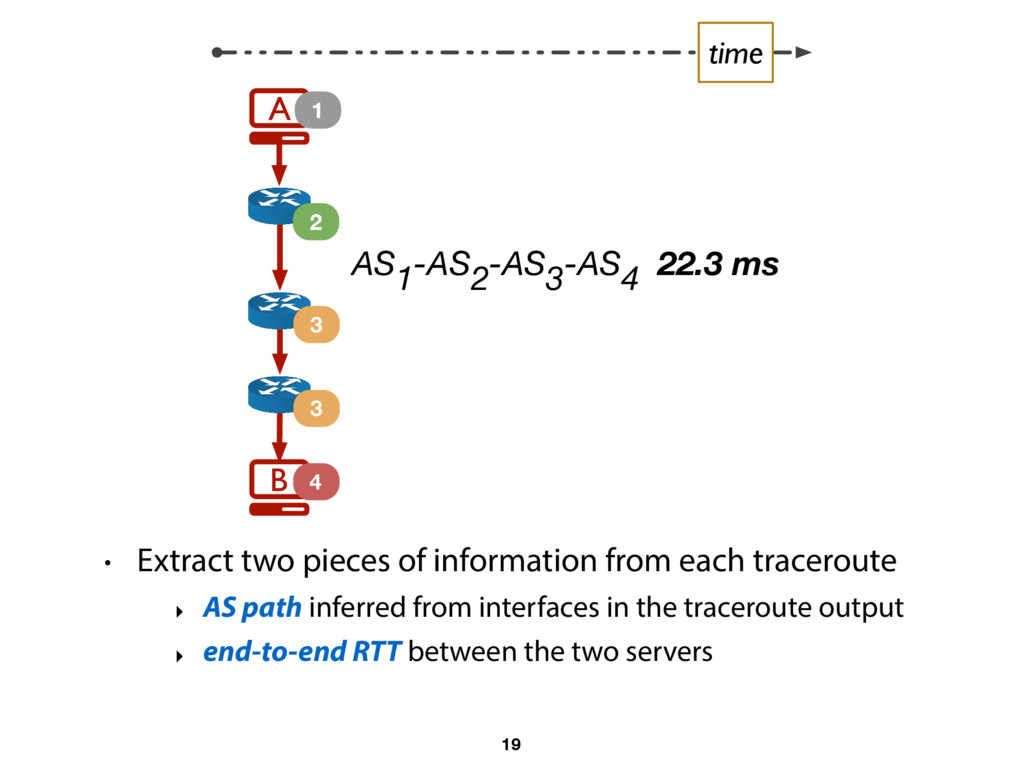
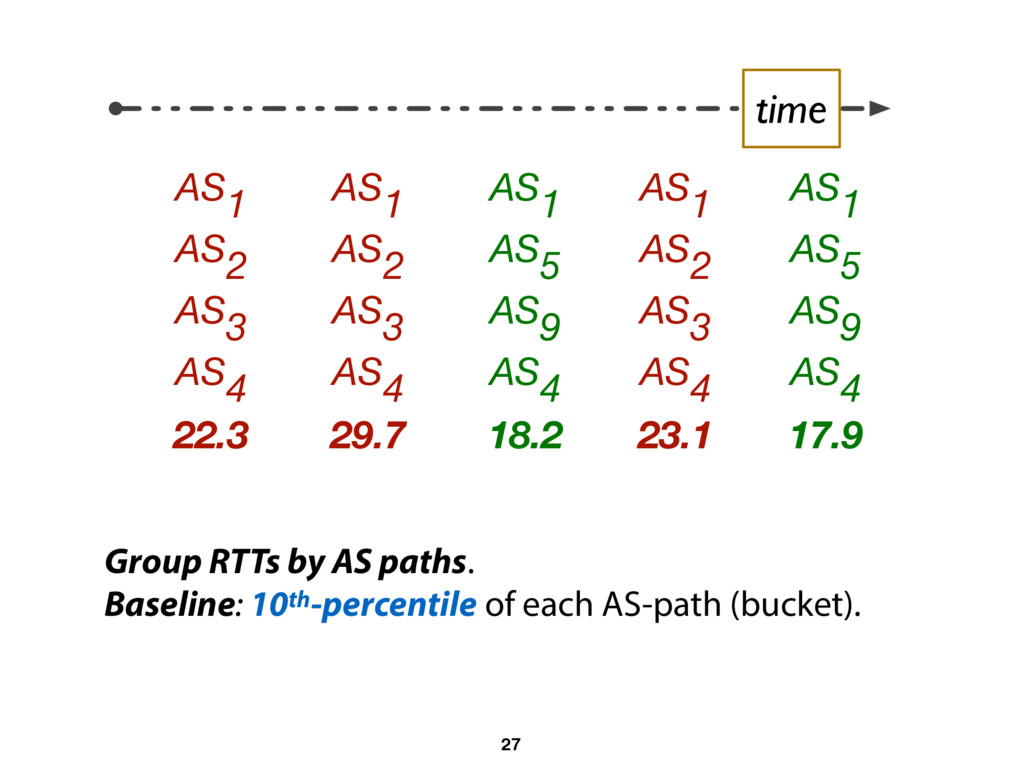
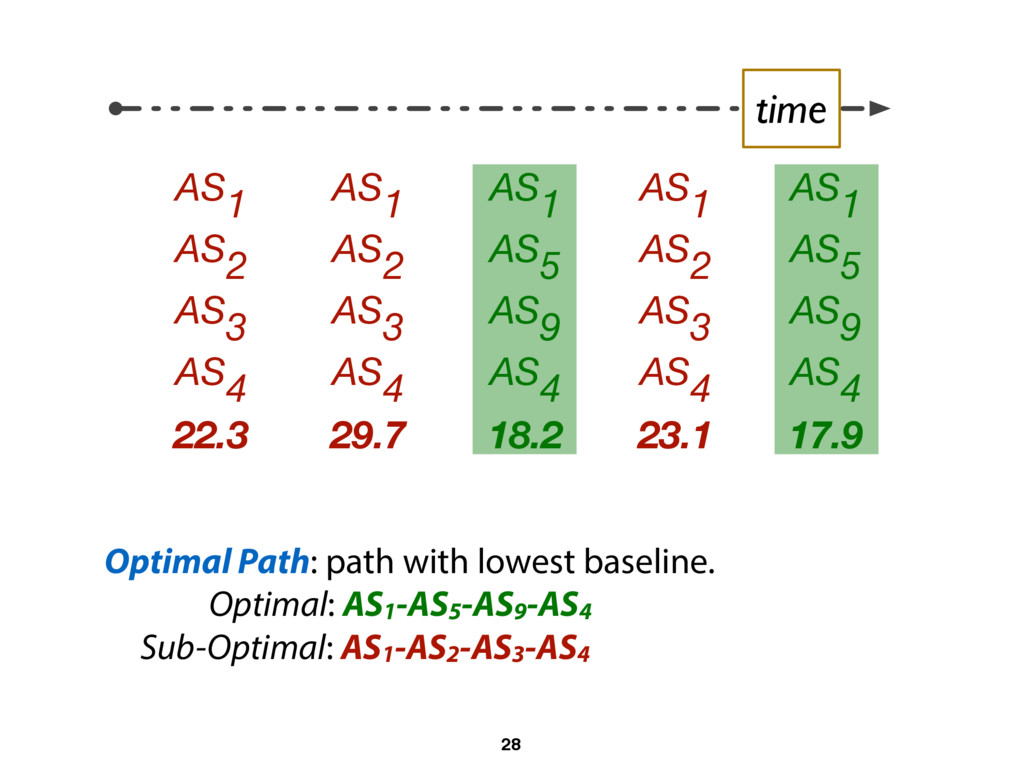
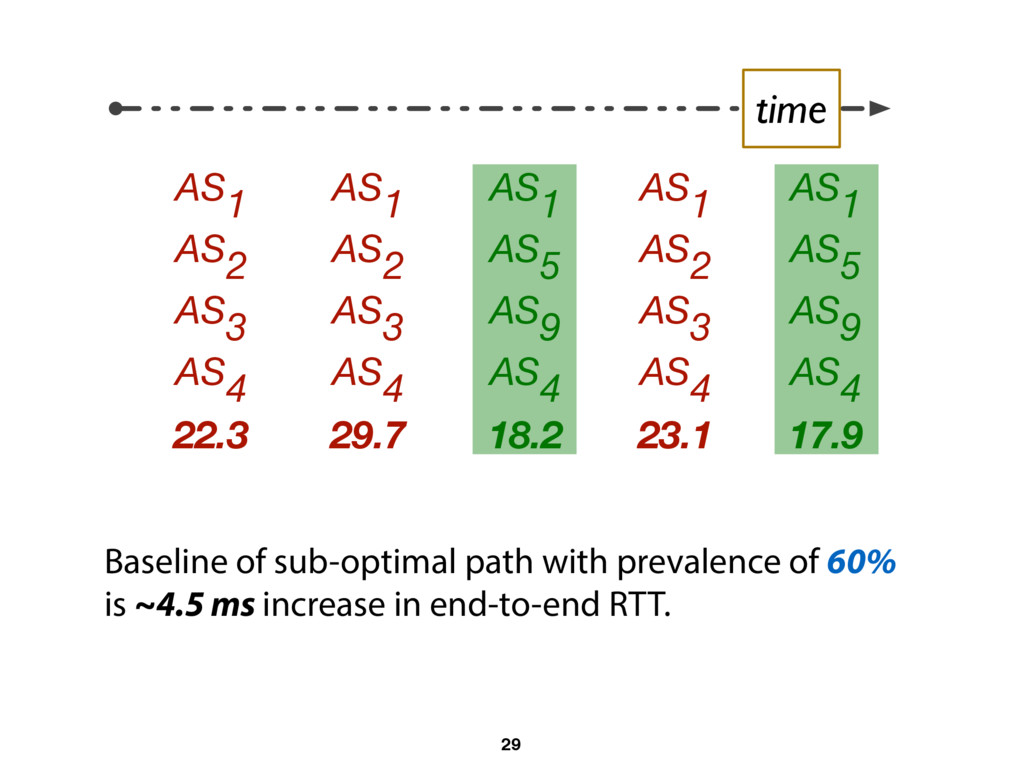
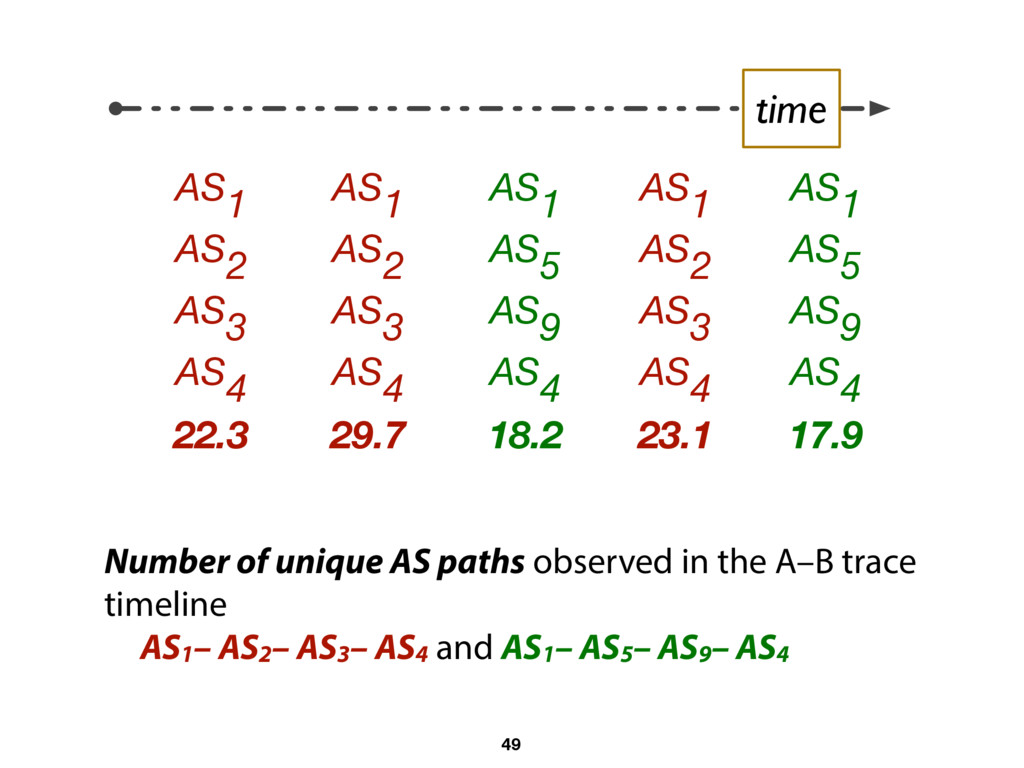
4 • Extract two pieces of information from each traceroute ‣ AS path inferred from interfaces in the traceroute output ‣ end-to-end RTT between the two servers 19
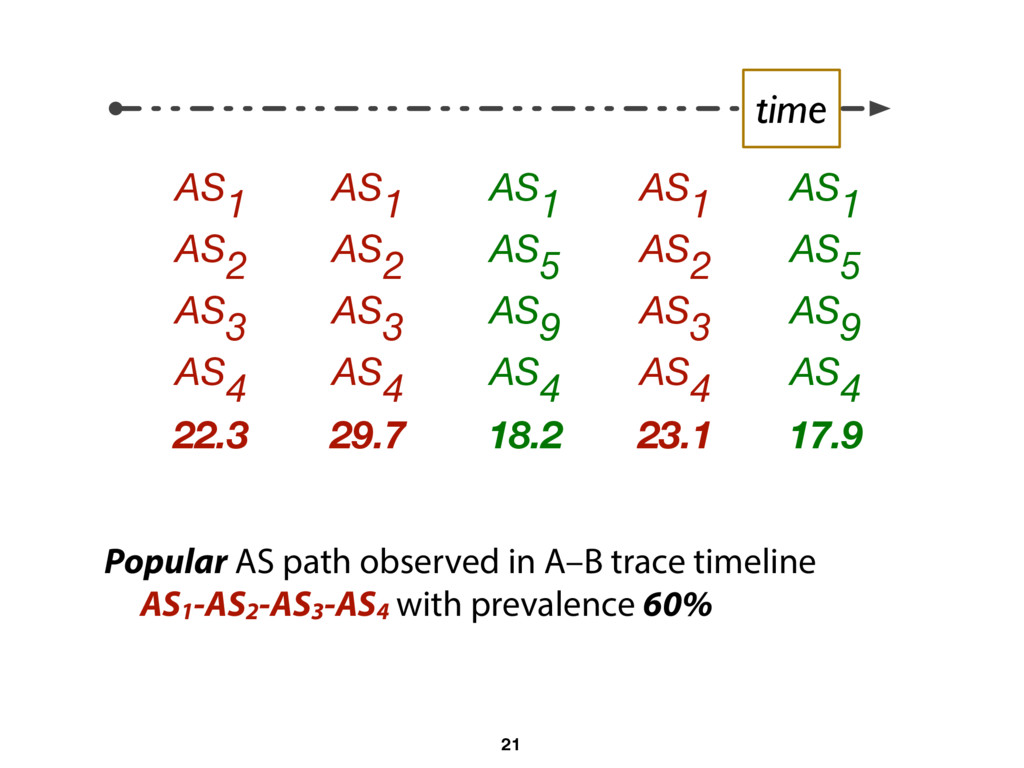
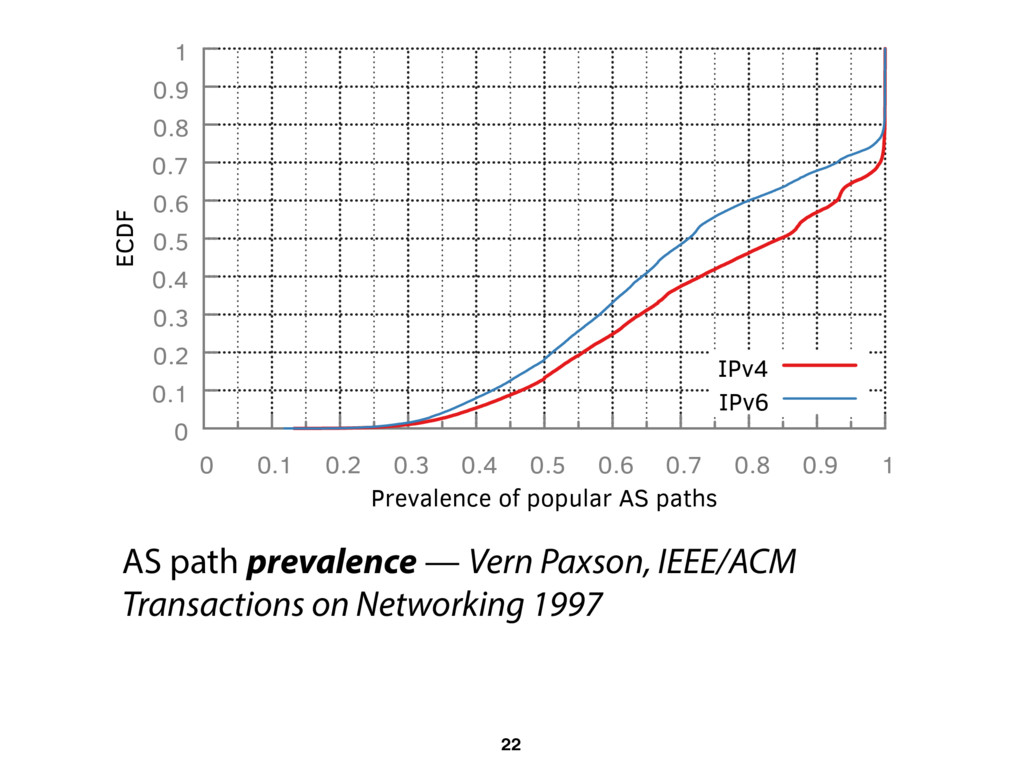
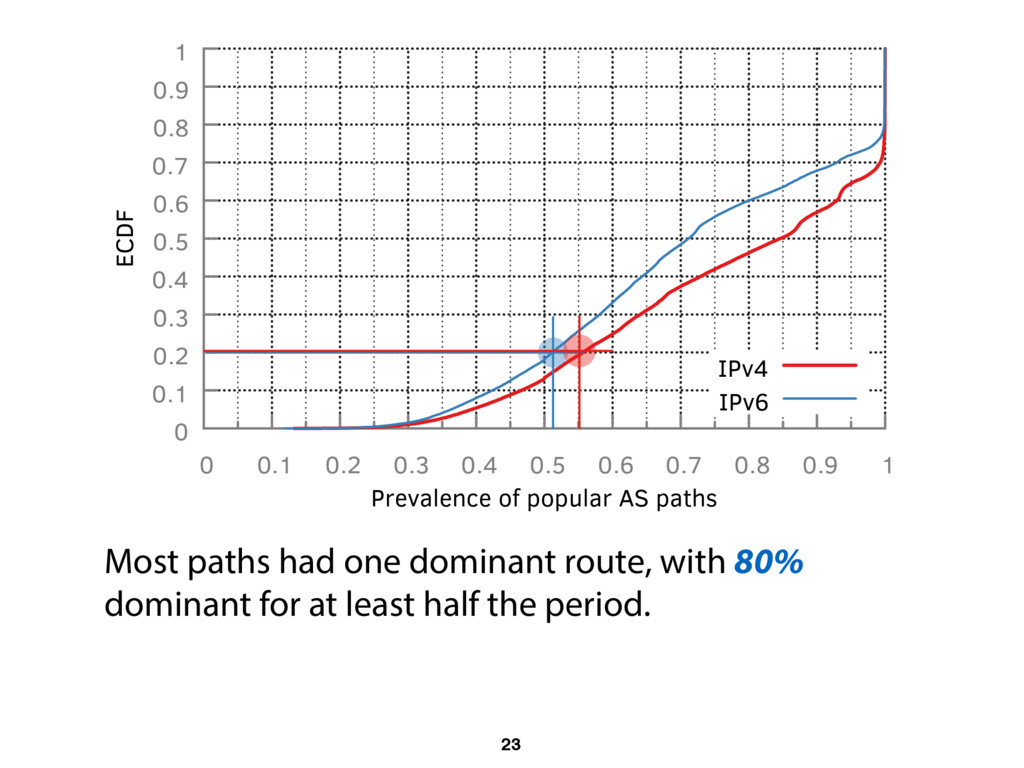
1 0 0.1 0.2 0.3 0.4 0.5 0.6 0.7 0.8 0.9 1 ECDF Prevalence of popular AS paths IPv4 IPv6 Most paths had one dominant route, with 80% dominant for at least half the period. 23
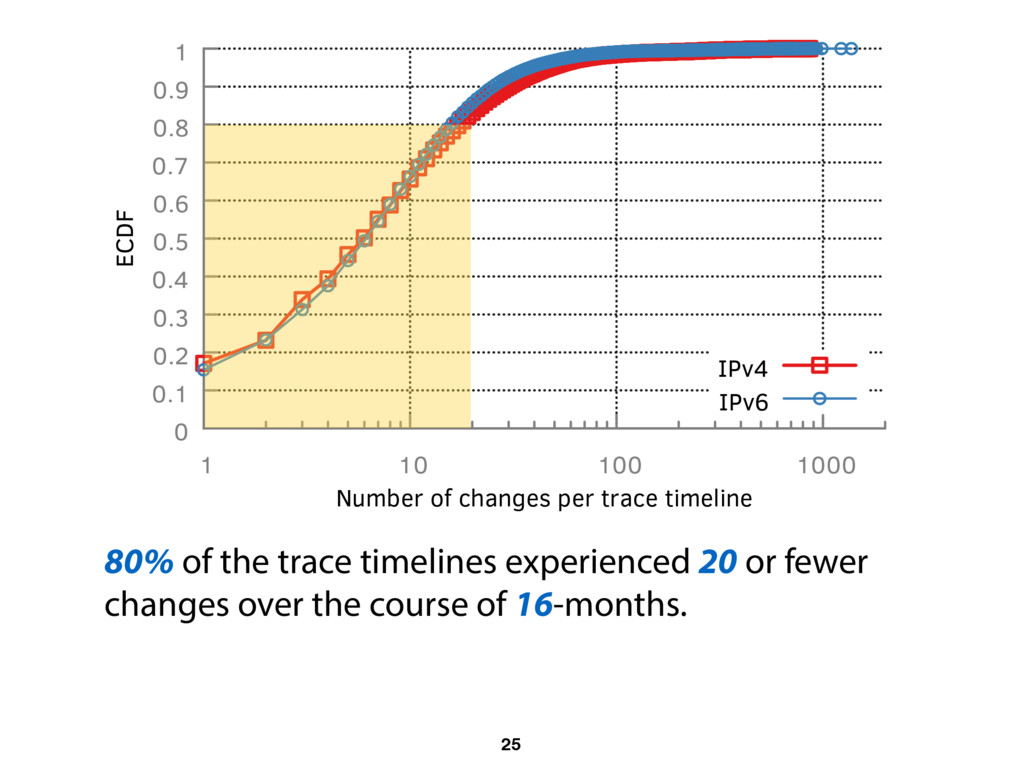
1 1 10 100 1000 ECDF Number of changes per trace timeline IPv4 IPv6 80% of the trace timelines experienced 20 or fewer changes over the course of 16-months. 25
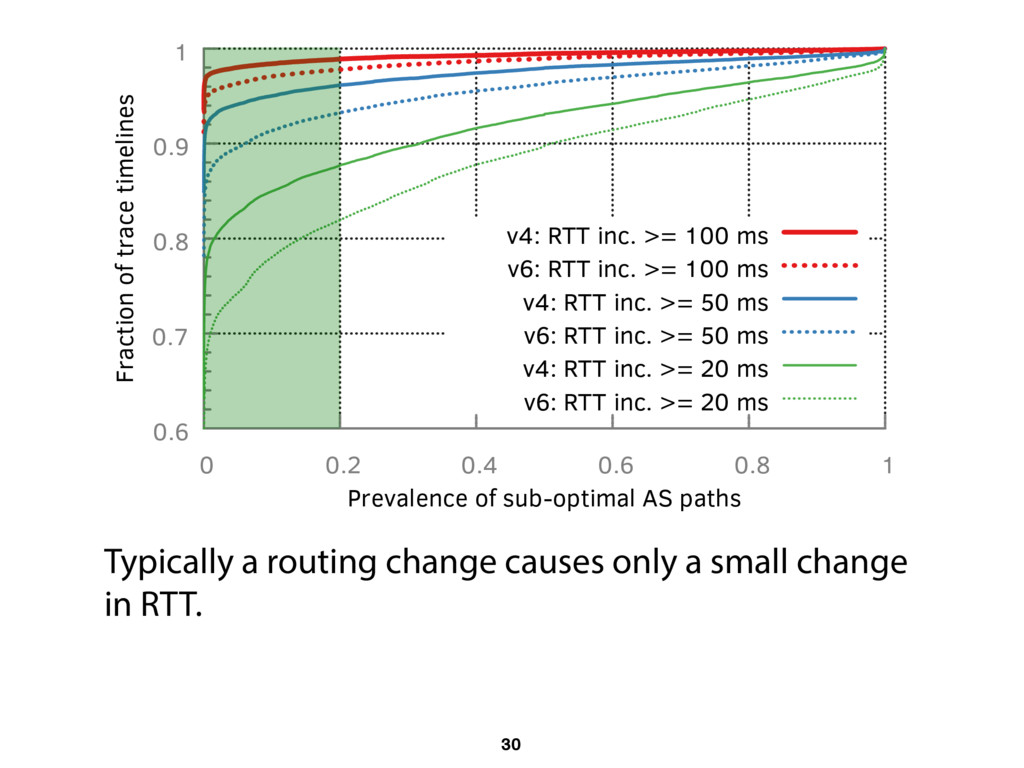
1 Fraction of trace timelines Prevalence of sub-optimal AS paths v4: RTT inc. >= 100 ms v6: RTT inc. >= 100 ms v4: RTT inc. >= 50 ms v6: RTT inc. >= 50 ms v4: RTT inc. >= 20 ms v6: RTT inc. >= 20 ms Typically a routing change causes only a small change in RTT. 30
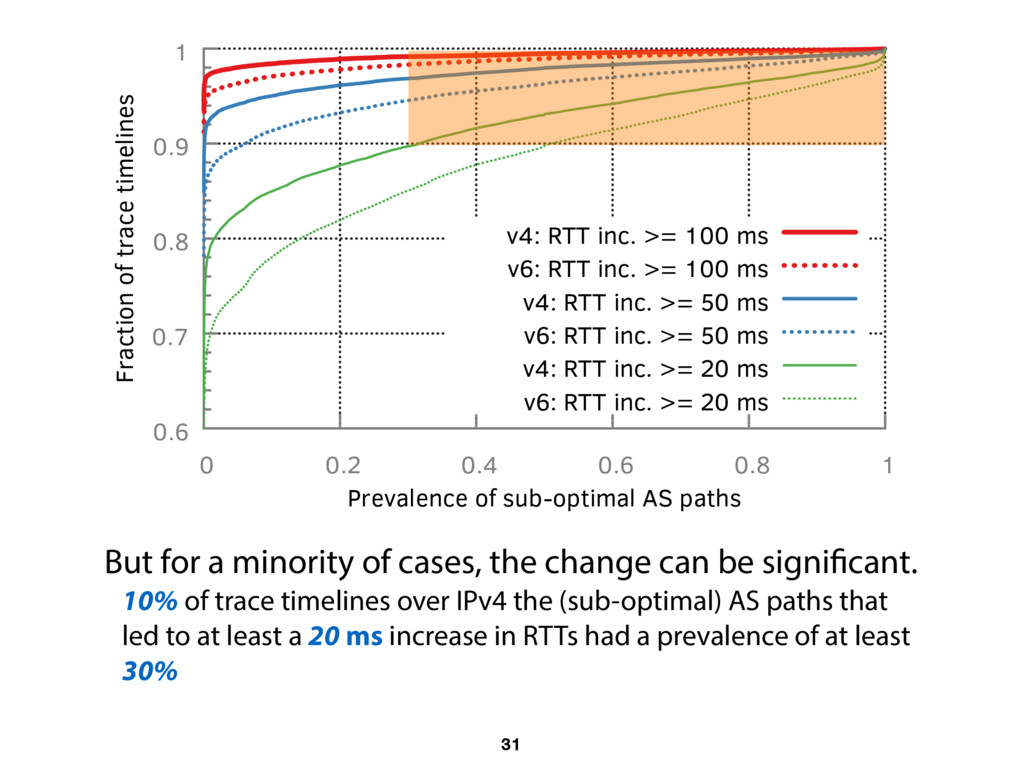
1 Fraction of trace timelines Prevalence of sub-optimal AS paths v4: RTT inc. >= 100 ms v6: RTT inc. >= 100 ms v4: RTT inc. >= 50 ms v6: RTT inc. >= 50 ms v4: RTT inc. >= 20 ms v6: RTT inc. >= 20 ms But for a minority of cases, the change can be significant. 10% of trace timelines over IPv4 the (sub-optimal) AS paths that led to at least a 20 ms increase in RTTs had a prevalence of at least 30% 31
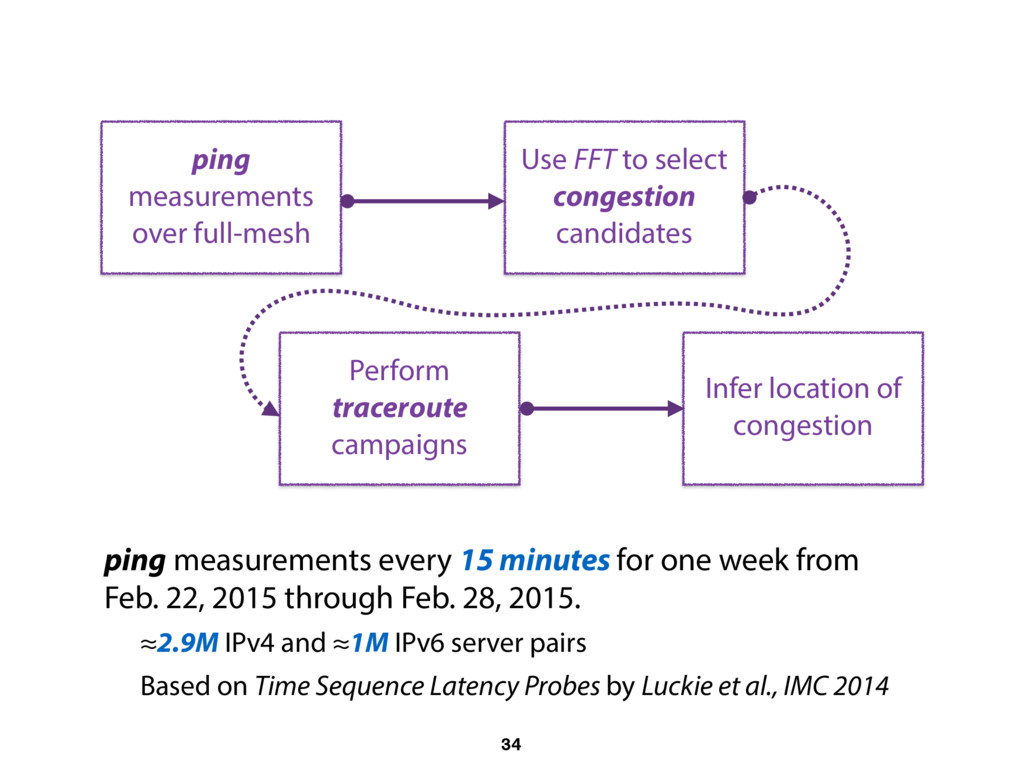
22, 2015 through Feb. 28, 2015. ≈2.9M IPv4 and ≈1M IPv6 server pairs Based on Time Sequence Latency Probes by Luckie et al., IMC 2014 34 ping measurements over full-mesh Use FFT to select congestion candidates Perform traceroute campaigns Infer location of congestion
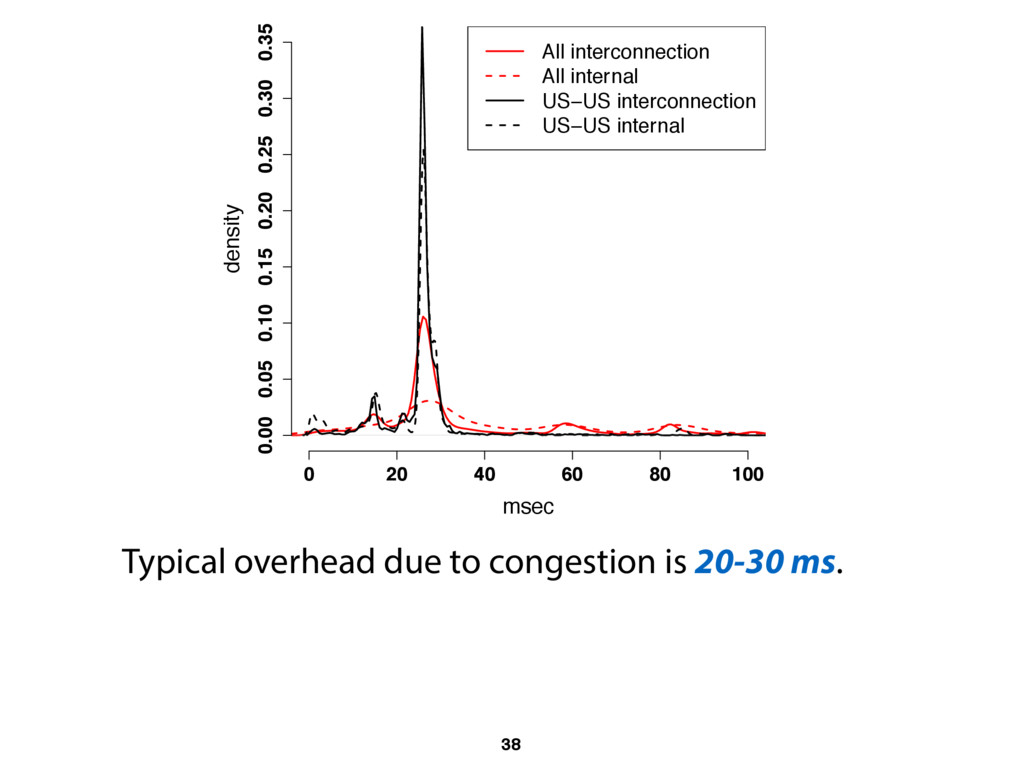
1768 internal & 1121 interconnection links. Weighting links by the number of server-to-server paths that cross them … interconnection links are more popular! Large majority of the interconnection links with congestion were private interconnects. 37 Highlights
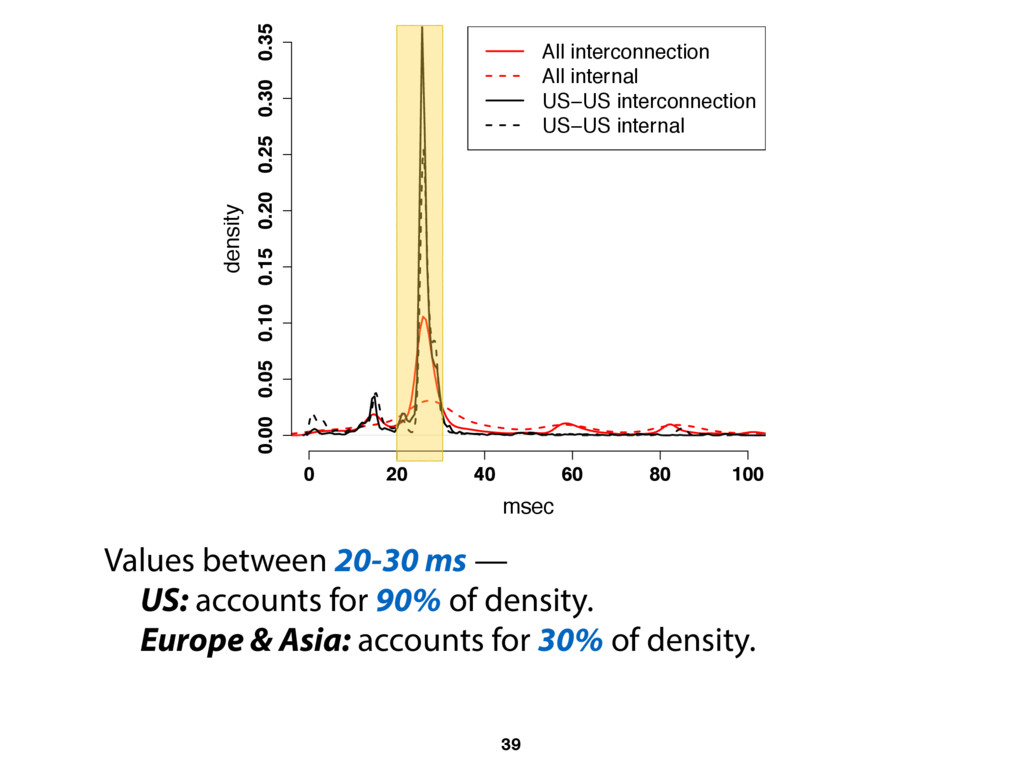
0.10 0.15 0.20 0.25 0.30 0.35 All interconnection All internal US−US interconnection US−US internal Values between 20-30 ms — US: accounts for 90% of density. Europe & Asia: accounts for 30% of density. 39
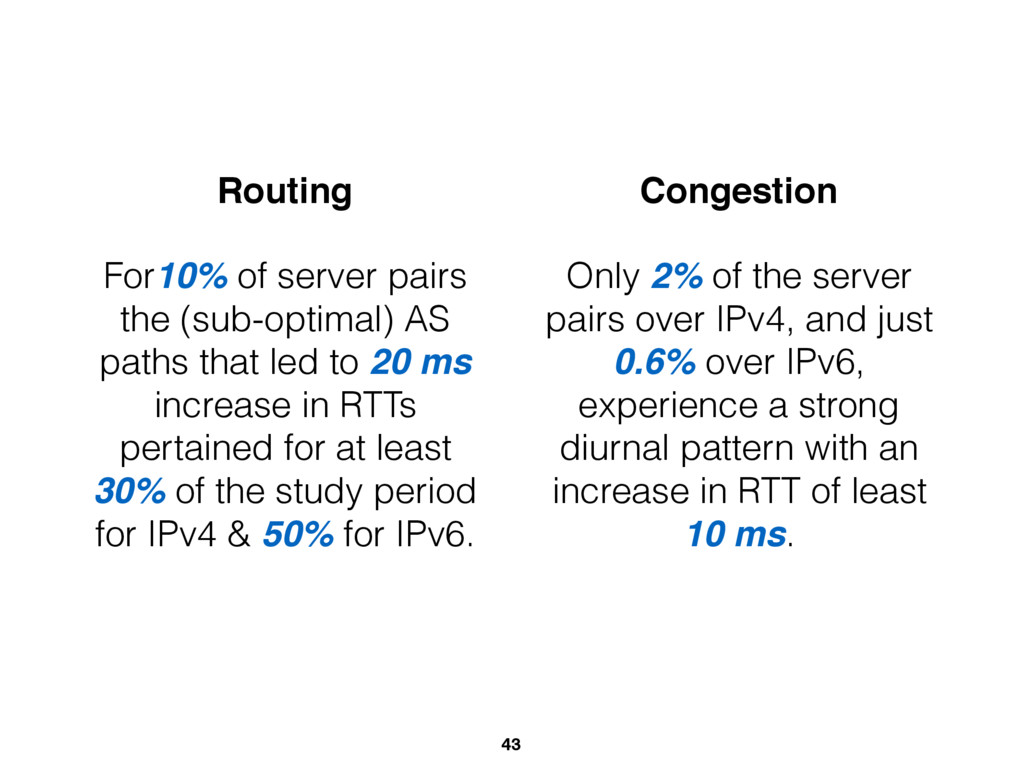
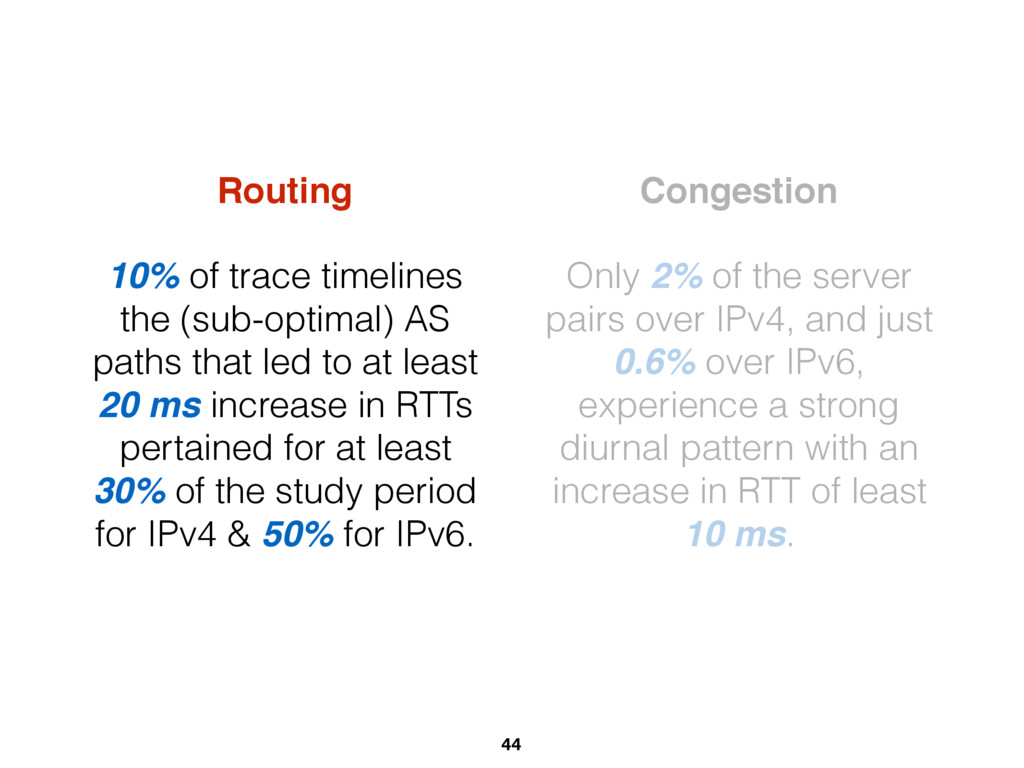
and just 0.6% over IPv6, experience a strong diurnal pattern with an increase in RTT of least 10 ms. Routing For10% of server pairs the (sub-optimal) AS paths that led to 20 ms increase in RTTs pertained for at least 30% of the study period for IPv4 & 50% for IPv6.
and just 0.6% over IPv6, experience a strong diurnal pattern with an increase in RTT of least 10 ms. Routing 10% of trace timelines the (sub-optimal) AS paths that led to at least 20 ms increase in RTTs pertained for at least 30% of the study period for IPv4 & 50% for IPv6.
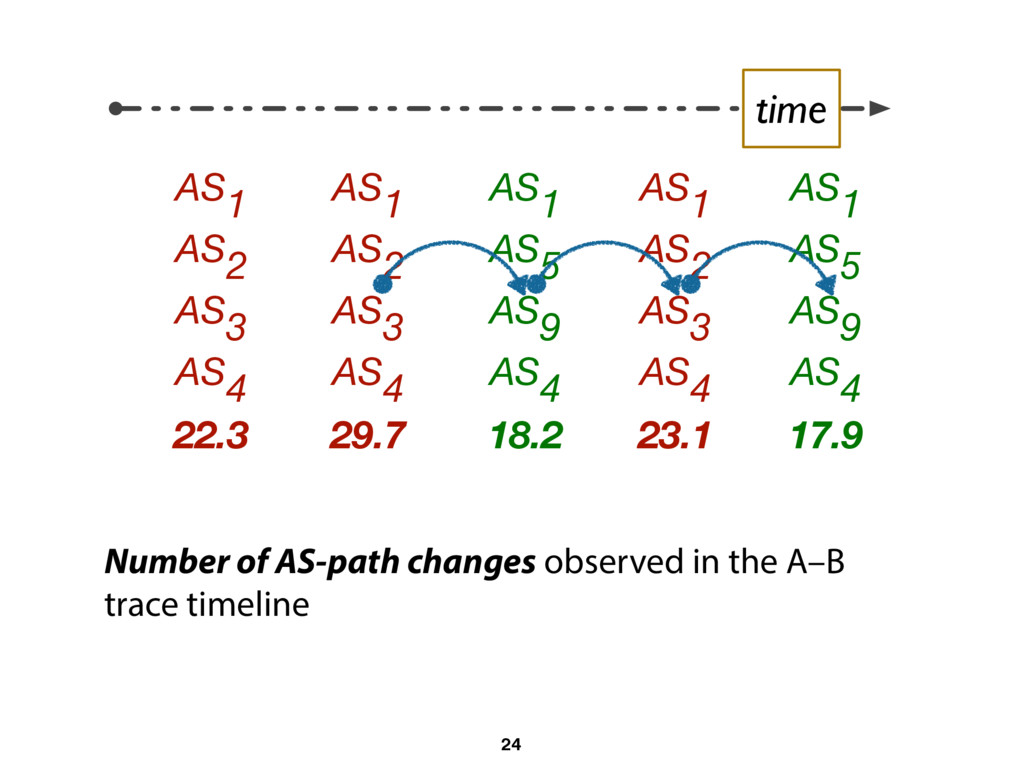
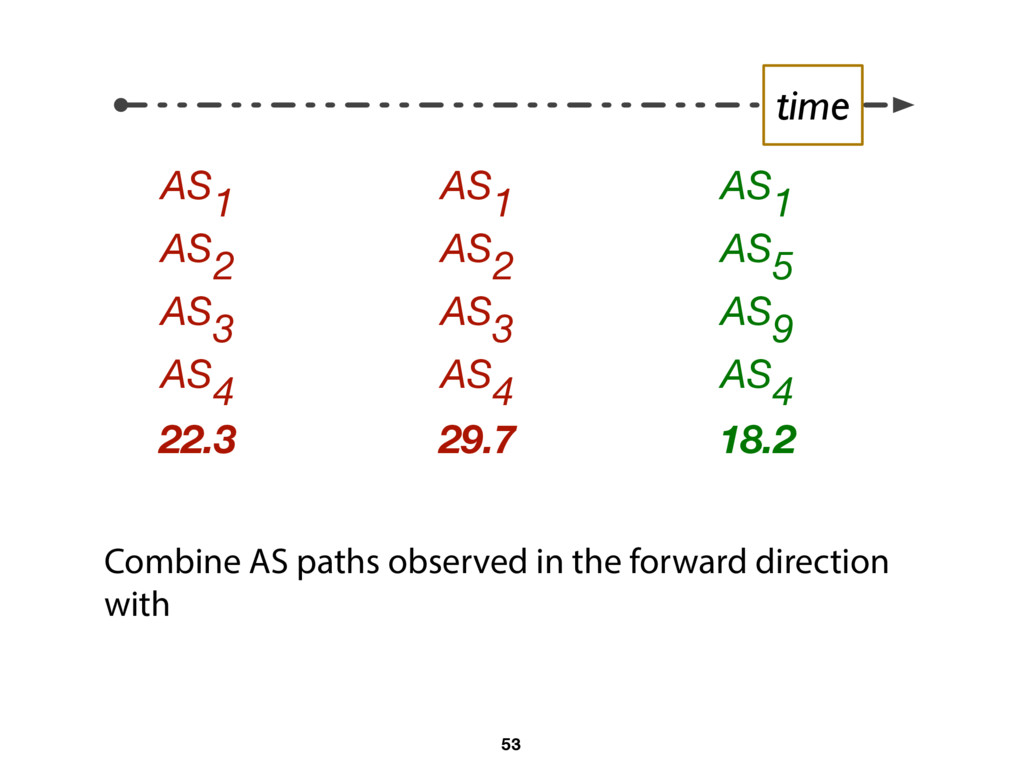
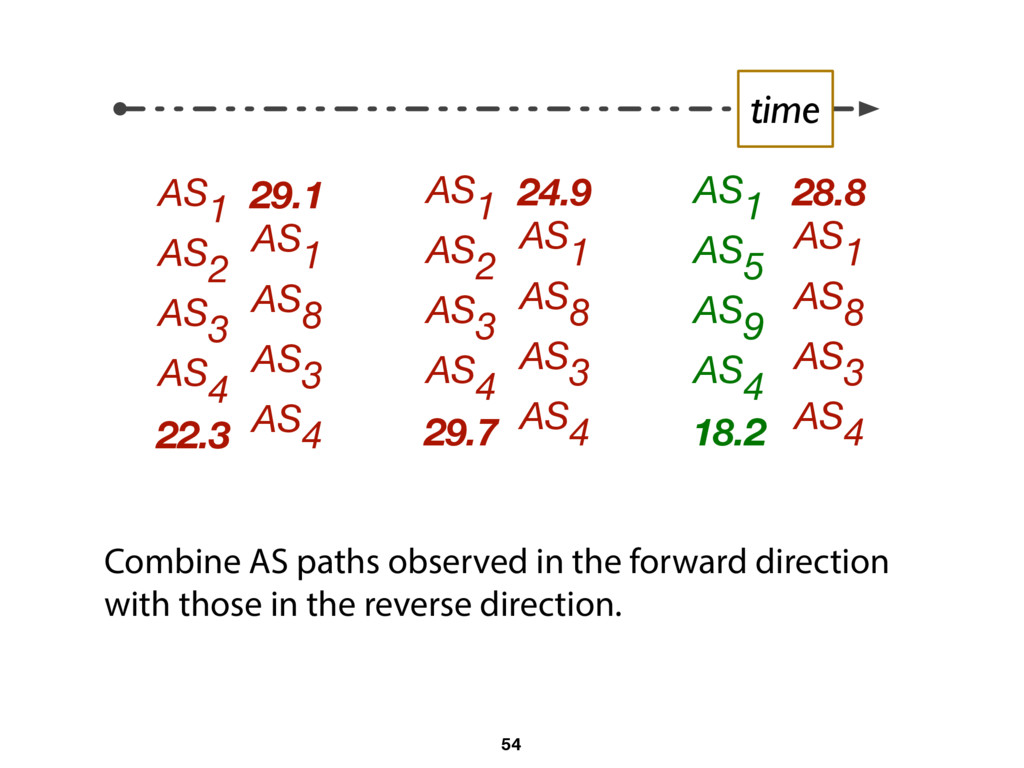
28.8 AS1 AS8 AS3 AS4 AS1 AS5 AS9 AS4 18.2 AS1 AS2 AS3 AS4 29.7 24.9 AS1 AS8 AS3 AS4 time Combine AS paths observed in the forward direction with those in the reverse direction. 54
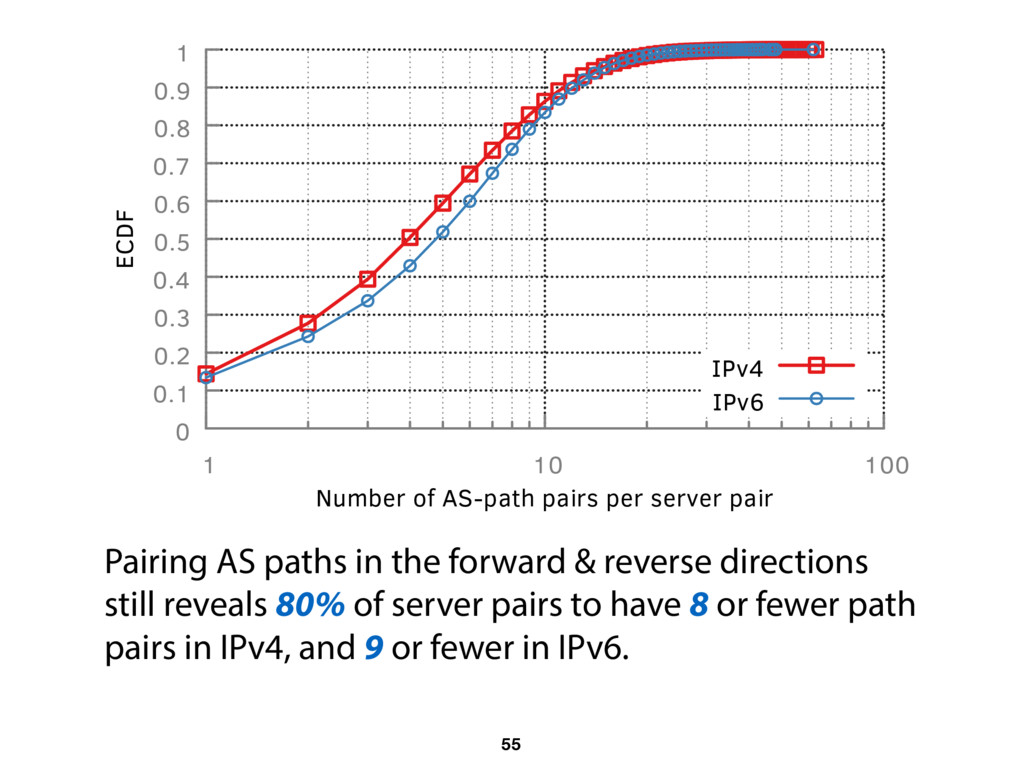
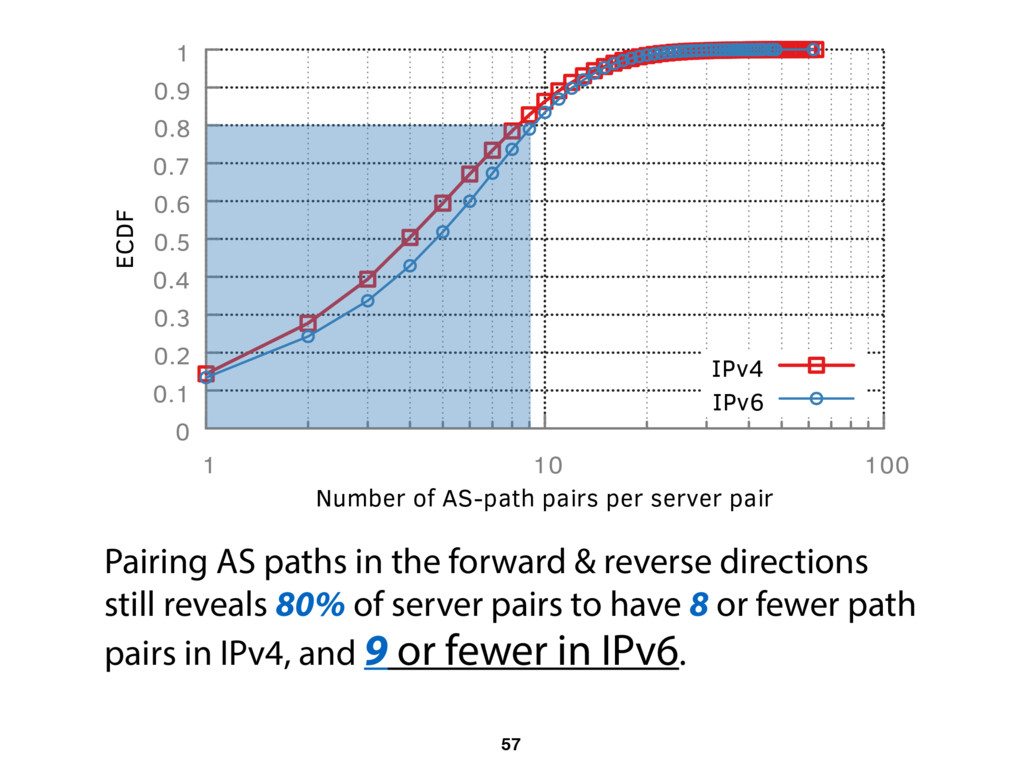
1 1 10 100 ECDF Number of AS-path pairs per server pair IPv4 IPv6 Pairing AS paths in the forward & reverse directions still reveals 80% of server pairs to have 8 or fewer path pairs in IPv4, and 9 or fewer in IPv6. 55
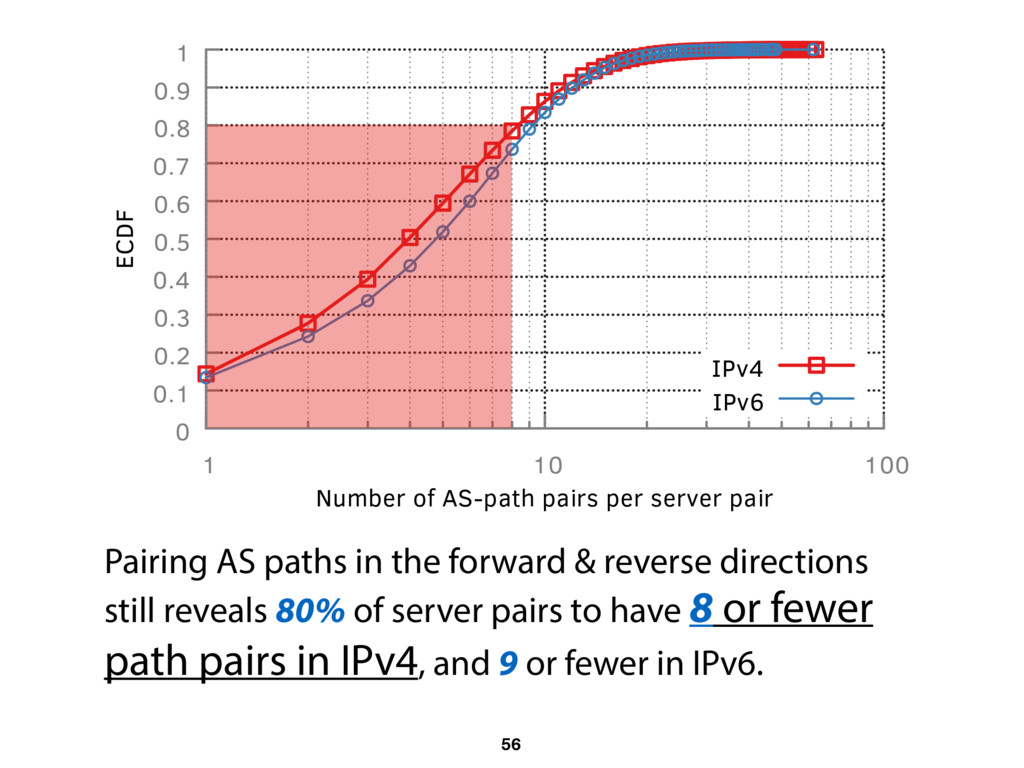
1 1 10 100 ECDF Number of AS-path pairs per server pair IPv4 IPv6 Pairing AS paths in the forward & reverse directions still reveals 80% of server pairs to have 8 or fewer path pairs in IPv4, and 9 or fewer in IPv6. 56
1 1 10 100 ECDF Number of AS-path pairs per server pair IPv4 IPv6 Pairing AS paths in the forward & reverse directions still reveals 80% of server pairs to have 8 or fewer path pairs in IPv4, and 9 or fewer in IPv6. 57