Kubernetes generates a wealth of metrics from several places. Some explicitly within the Kubernetes API server, the Kublet, and cAdvisor or implicitly by observing events such as the kube-state-metrics project. A subset of these metrics are used within Kubernetes itself to make scheduling decisions, however, other metrics can be used to determine the overall health of the system or for capacity planning purposes.
In this session you will learn about:
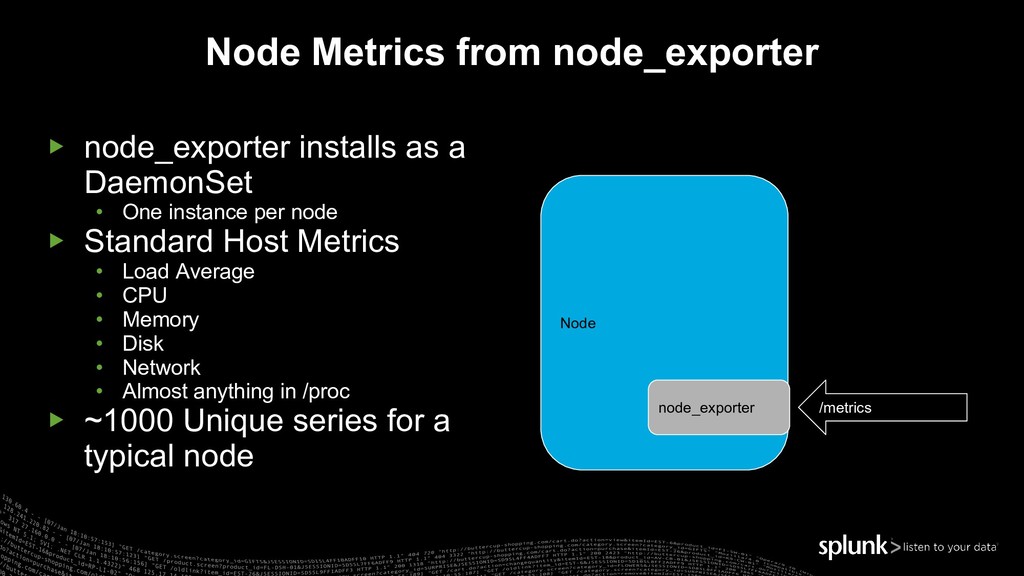
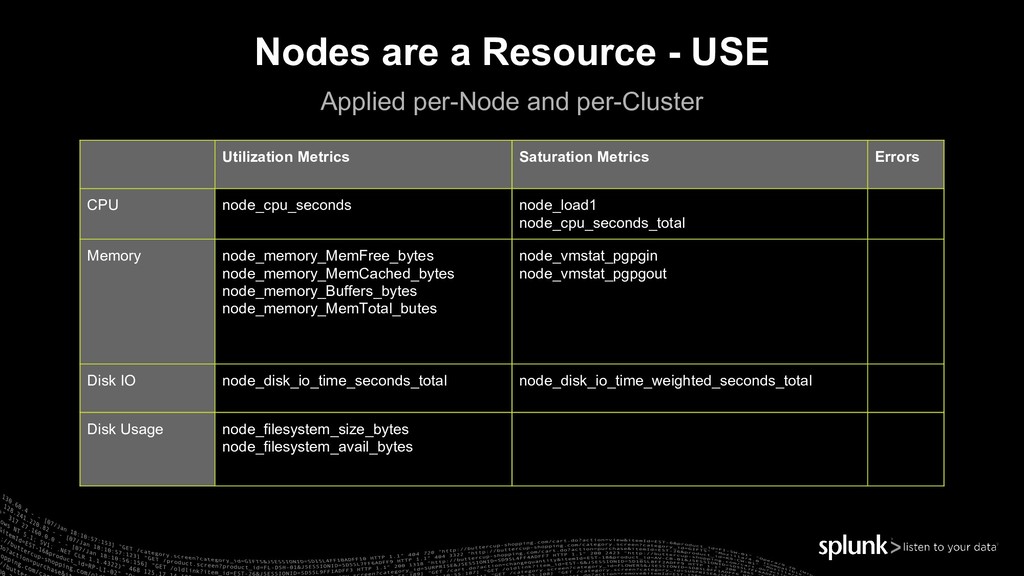
Node level metrics, as exposed from the node_exporter
Kublet metrics
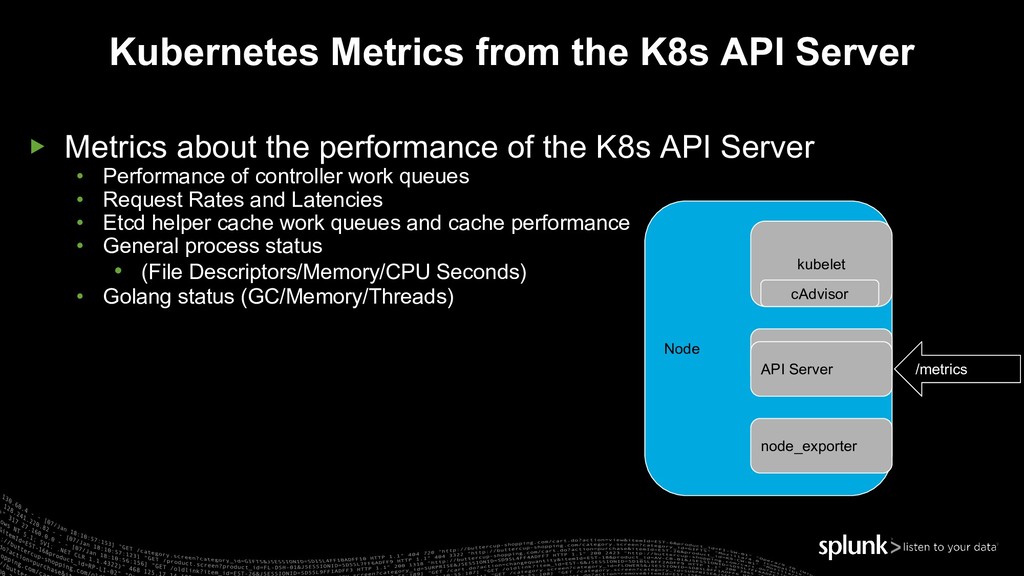
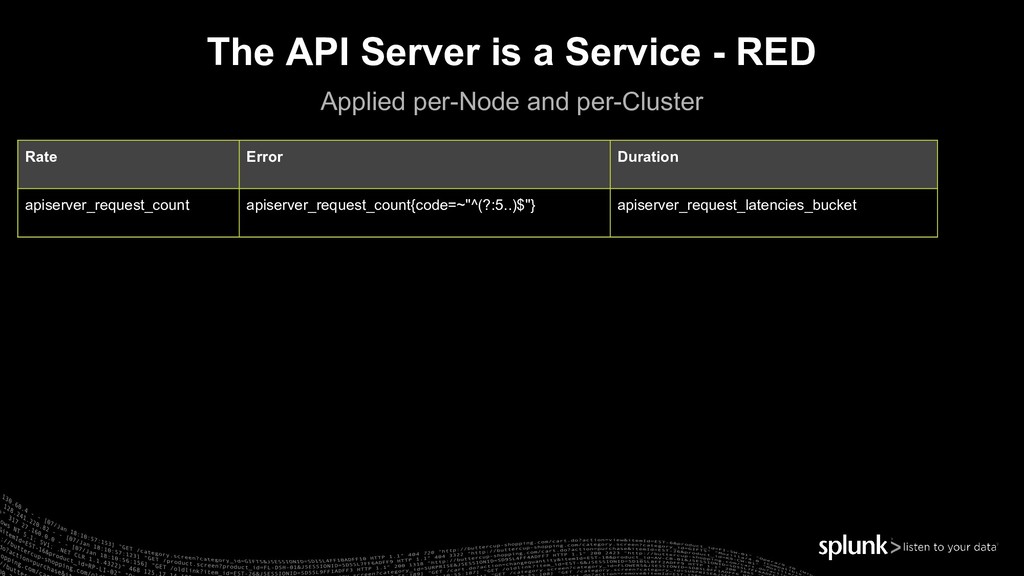
API server metrics
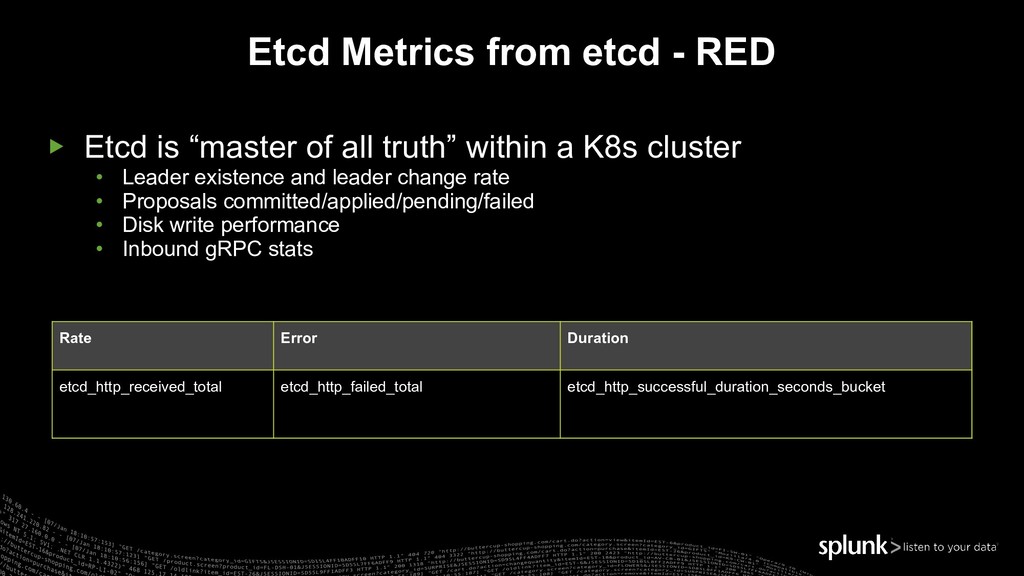
etcd metrics
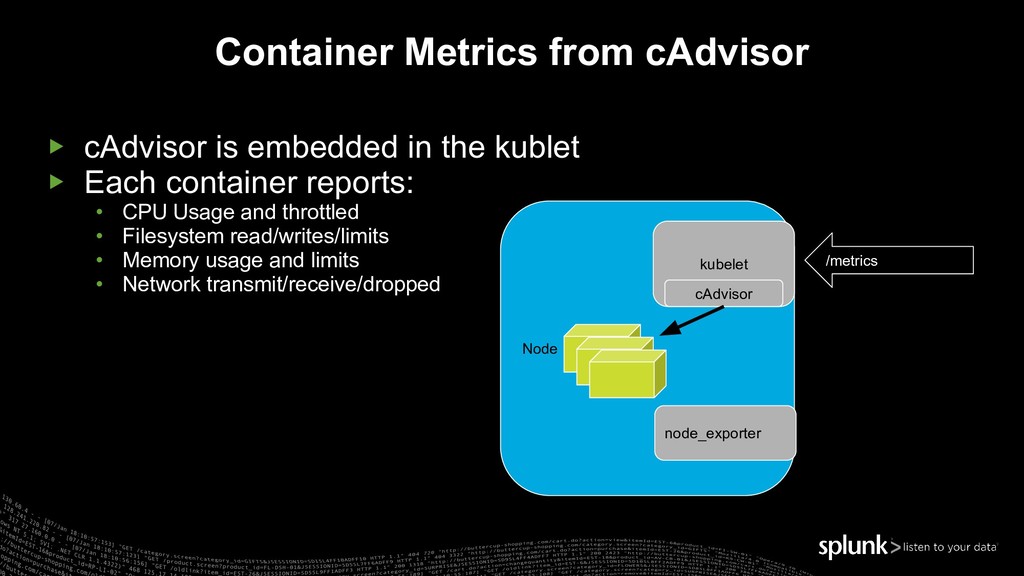
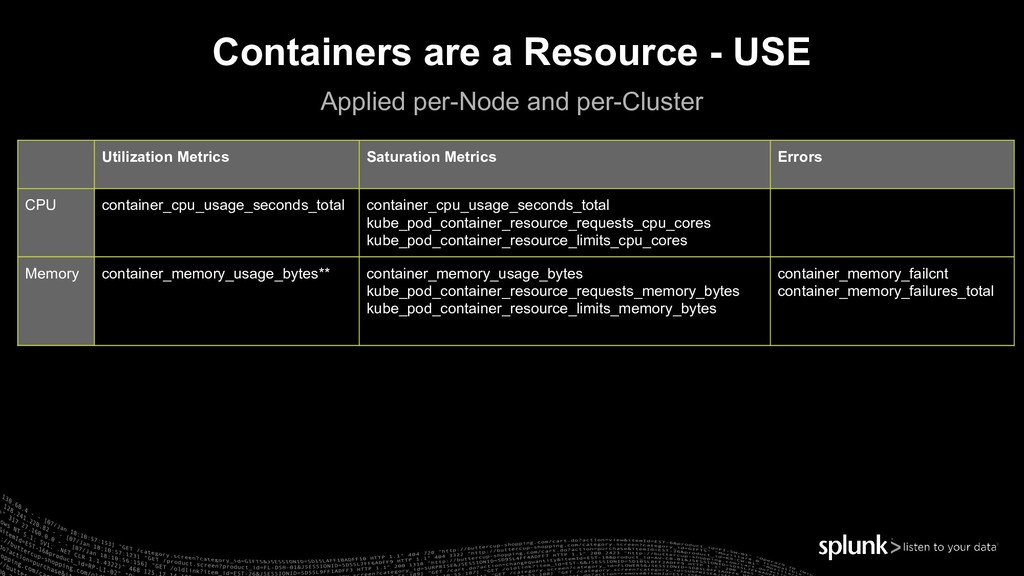
cAdvisor metrics
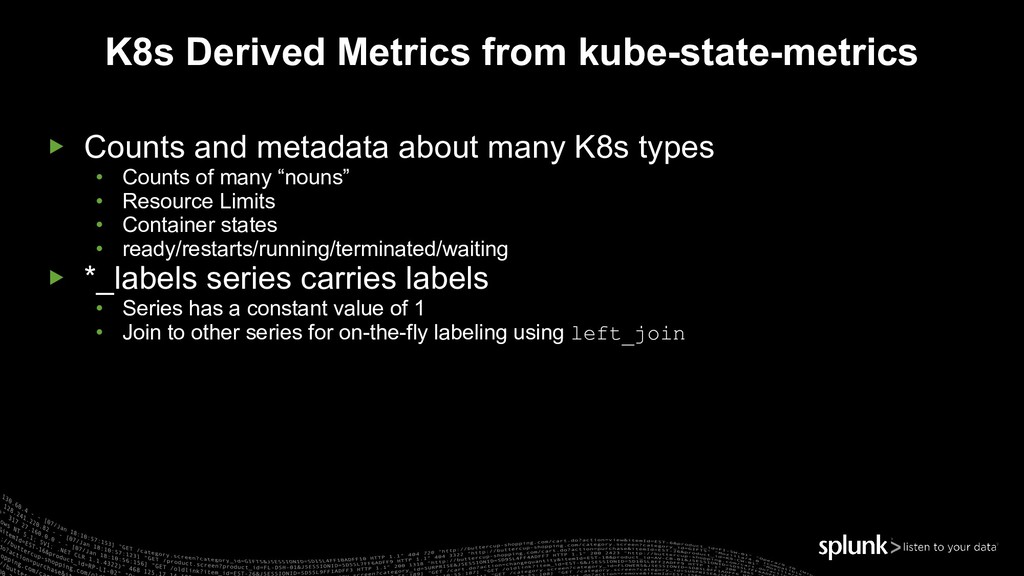
Metrics exposed from kube-state-metrics