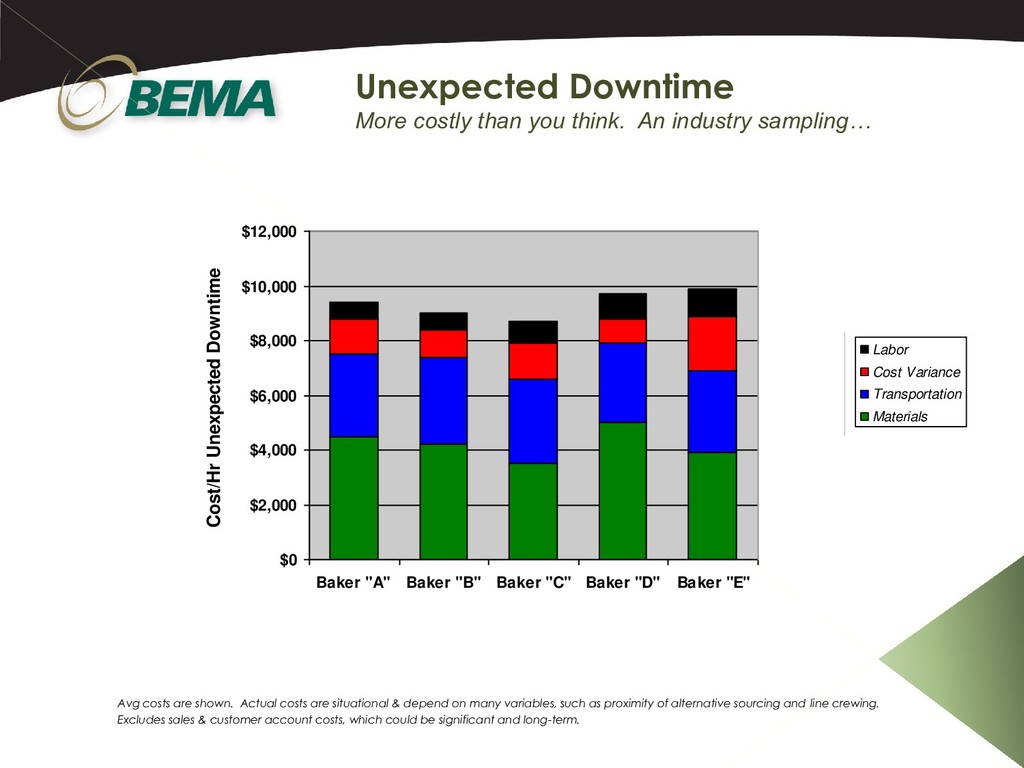
1 Hour Of Unexpected Production Line Downtime $0 $2 $4 $6 $8 $10 $12 Baker "A" Baker "B" Baker "C" Baker "D" Baker "E" Cost ($1,000's) Labor Cost Variance Transportation Materials Avg costs are shown. Actual costs are situational & depend on many variables, such as proximity of alternative sourcing and line crewing. Excludes sales & customer account costs, which could be significant and long-term. 1 Hour Of Unexpected Production Line Downtime $0 $2,000 $4,000 $6,000 $8,000 $10,000 $12,000 Baker "A" Baker "B" Baker "C" Baker "D" Baker "E" Cost/Hr Unexpected Downtime Labor Cost Variance Transportation Materials
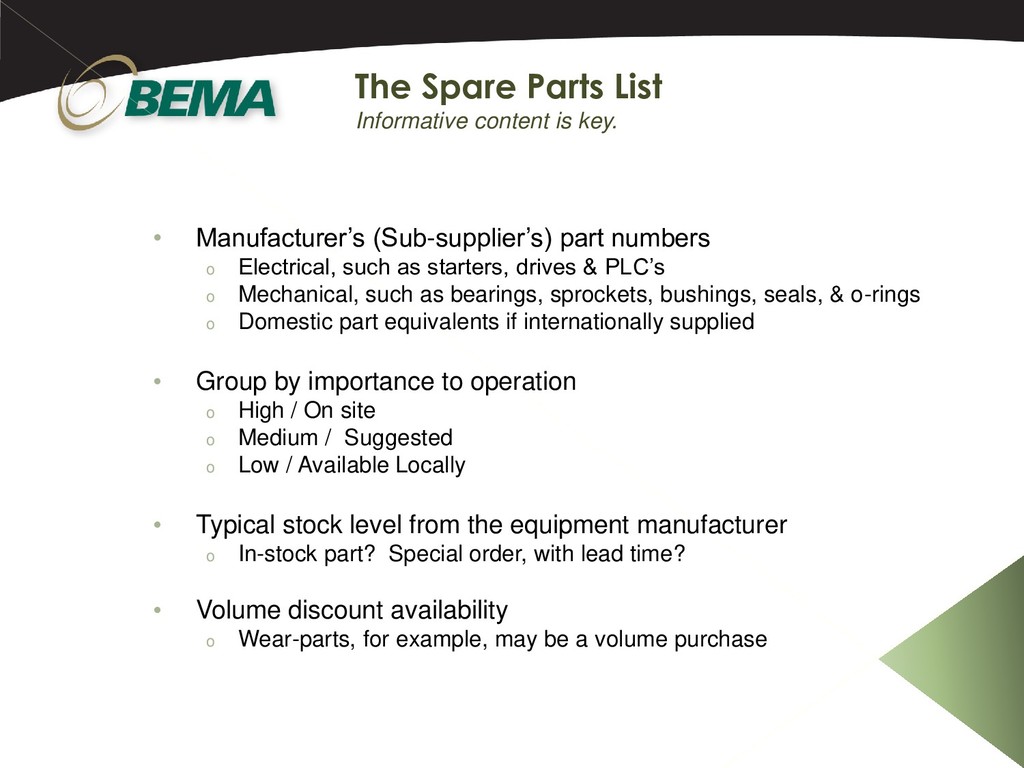
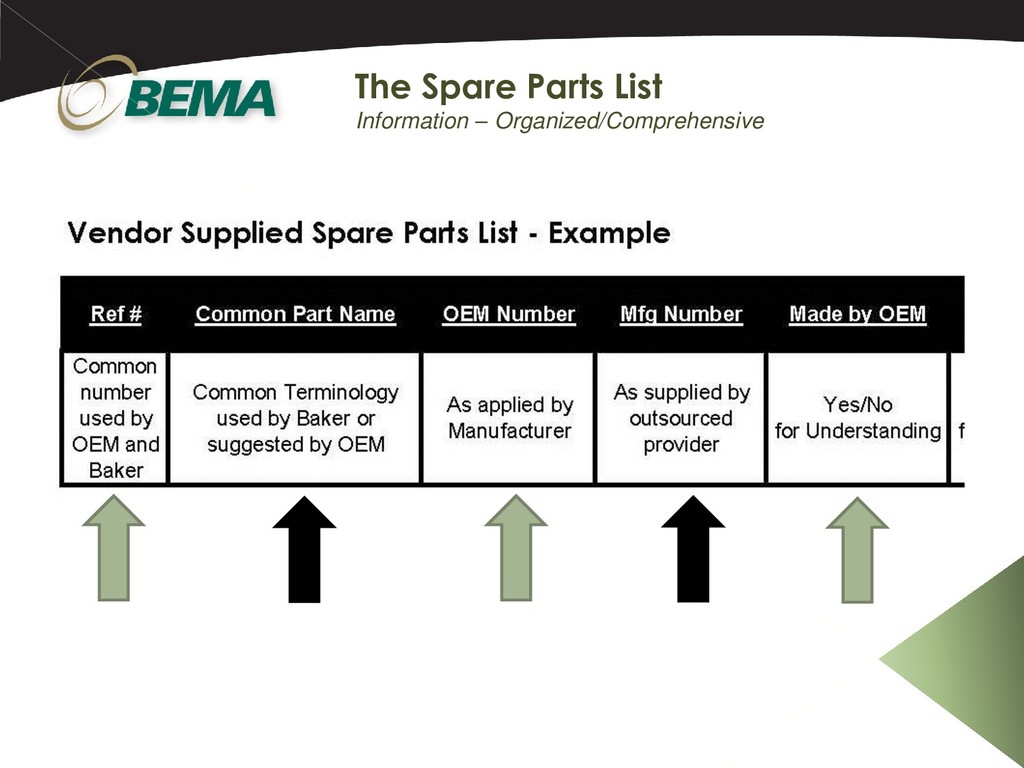
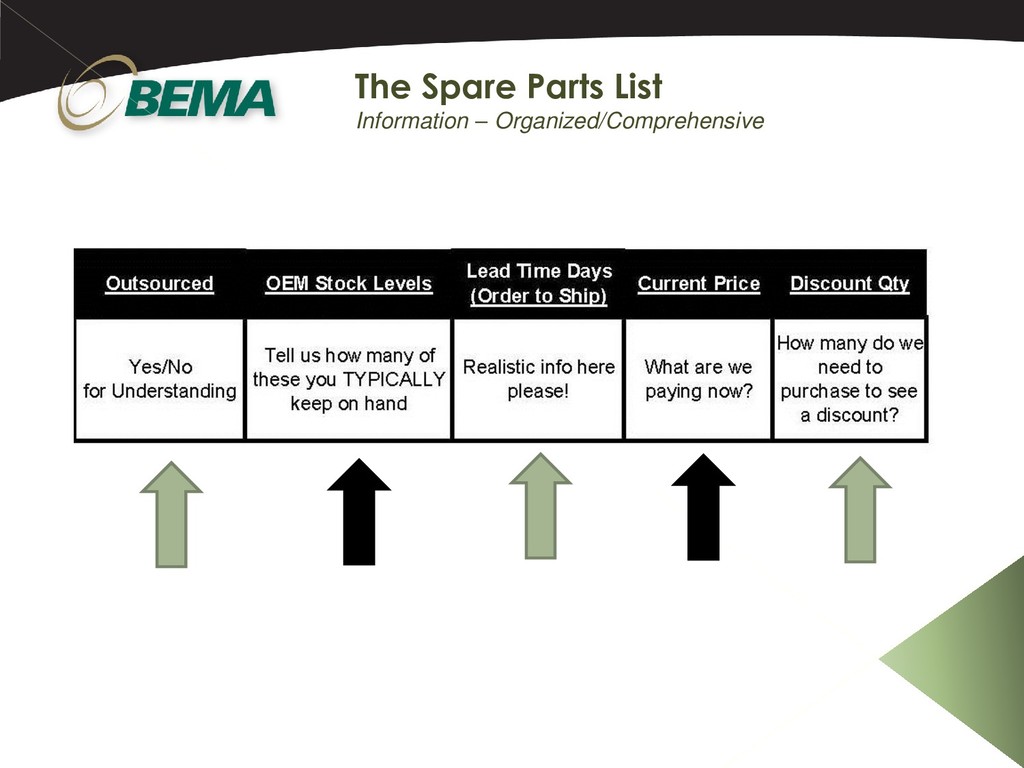
drives & PLC’s o Mechanical, such as bearings, sprockets, bushings, seals, & o-rings o Domestic part equivalents if internationally supplied • Group by importance to operation o High / On site o Medium / Suggested o Low / Available Locally • Typical stock level from the equipment manufacturer o In-stock part? Special order, with lead time? • Volume discount availability o Wear-parts, for example, may be a volume purchase The Spare Parts List Informative content is key.
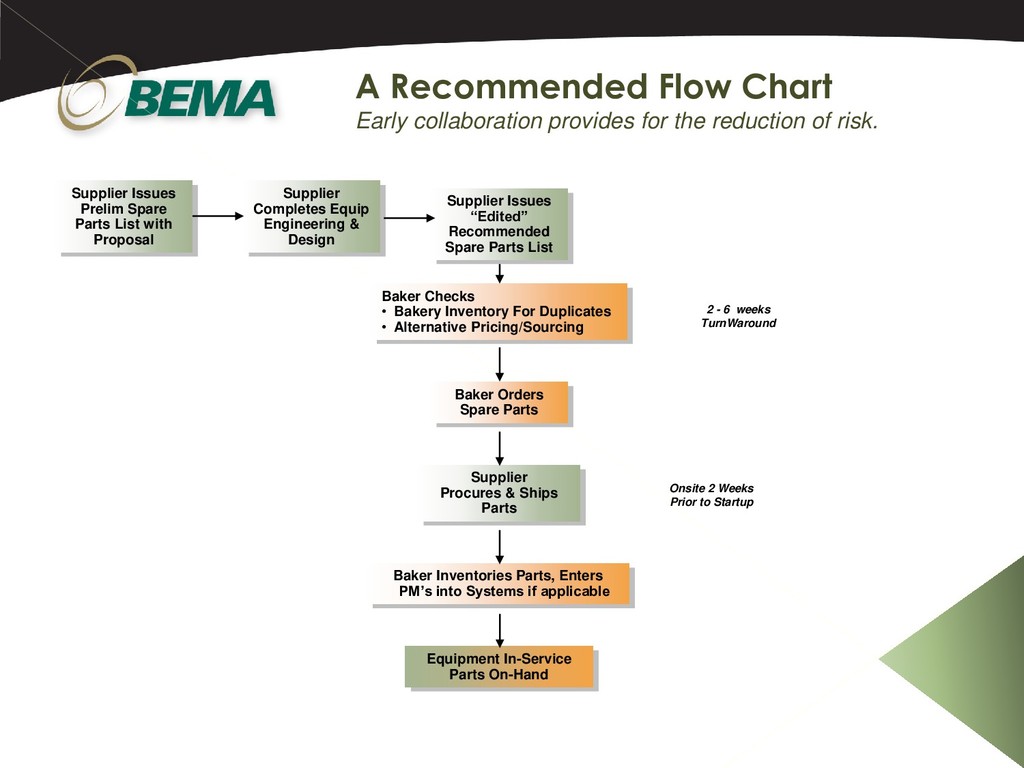
of risk. Supplier Issues “Edited” Recommended Spare Parts List Baker Checks • Bakery Inventory For Duplicates • Alternative Pricing/Sourcing Baker Orders Spare Parts Supplier Procures & Ships Parts Baker Inventories Parts, Enters PM’s into Systems if applicable Equipment In-Service Parts On-Hand Supplier Issues Prelim Spare Parts List with Proposal Supplier Completes Equip Engineering & Design 2 - 6 weeks TurnWaround Onsite 2 Weeks Prior to Startup
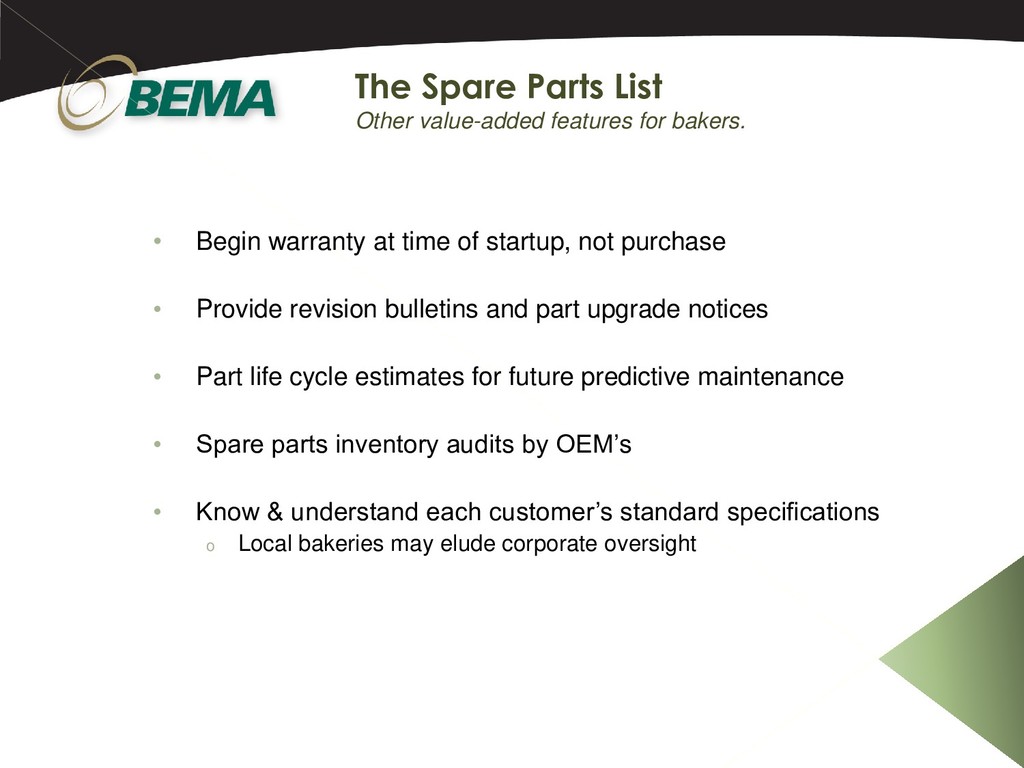
Provide revision bulletins and part upgrade notices • Part life cycle estimates for future predictive maintenance • Spare parts inventory audits by OEM’s • Know & understand each customer’s standard specifications o Local bakeries may elude corporate oversight The Spare Parts List Other value-added features for bakers.
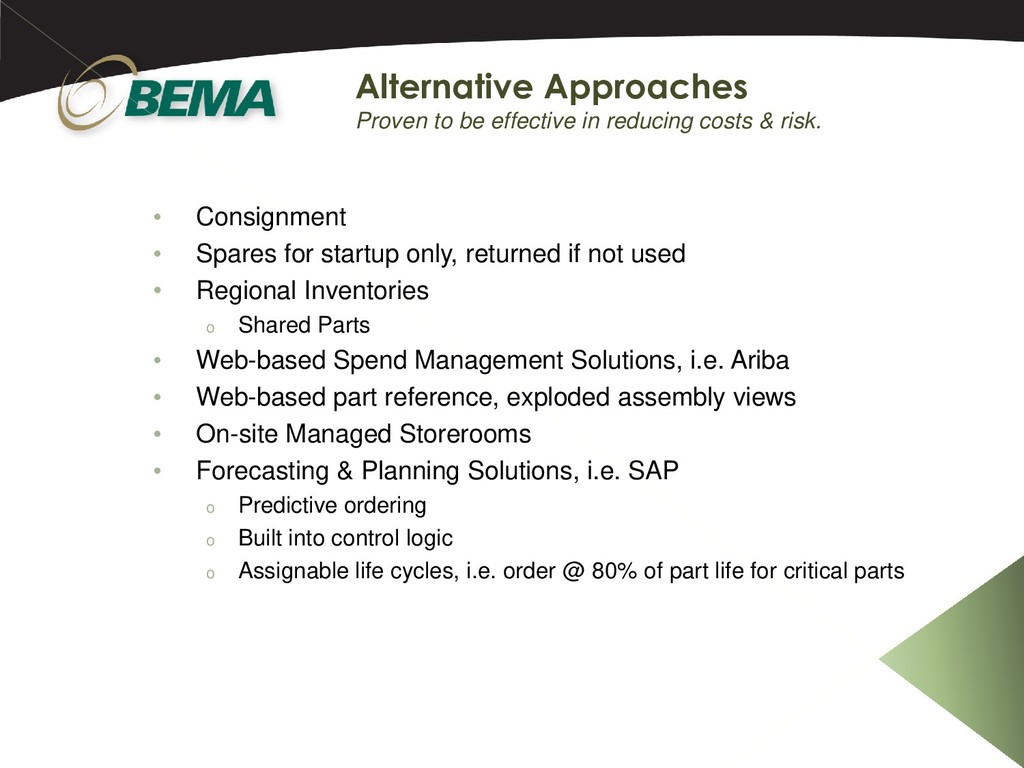
used • Regional Inventories o Shared Parts • Web-based Spend Management Solutions, i.e. Ariba • Web-based part reference, exploded assembly views • On-site Managed Storerooms • Forecasting & Planning Solutions, i.e. SAP o Predictive ordering o Built into control logic o Assignable life cycles, i.e. order @ 80% of part life for critical parts Alternative Approaches Proven to be effective in reducing costs & risk.
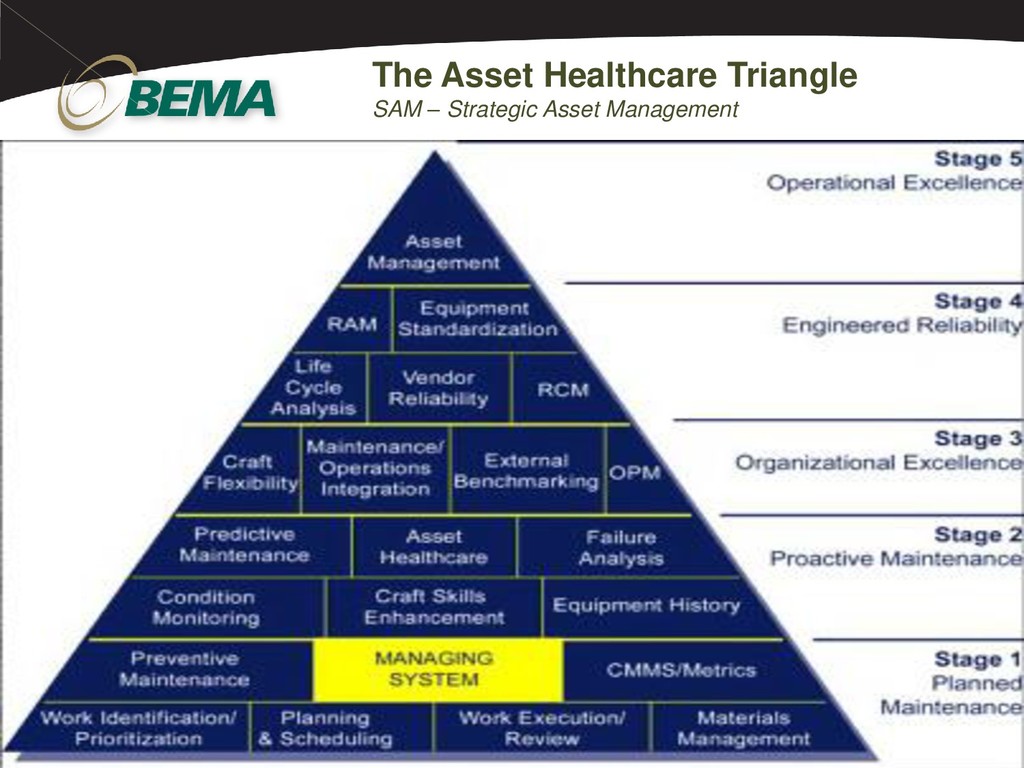
infant mortality of components and the random losses of machine parts, which are the leading failure mode affecting equipment reliability. • Often these losses are caused by human intervention through time based “Preventive Maintenance” tasks and the simple act of production cycles. • We must move from reactionary maintenance to predictive maintenance (part life cycles) and meantime between failure analysis. • The total cost for carrying an item in inventory may be as high as 30 – 40% of the value of the item per year. • Predictive Maintenance saves everyone money. The Asset Healthcare Triangle SAM – Strategic Asset Management