Was in Operations Team from 2011-2015 • Formalized incident response and ticketing process • Wrote automation tools to manage a rapidly-growing fleet (now ~15000) • Implemented Kanban process in 2015 to track work-in-progress • Currently tech lead for Tools Team, people manager for Tier2 Operations
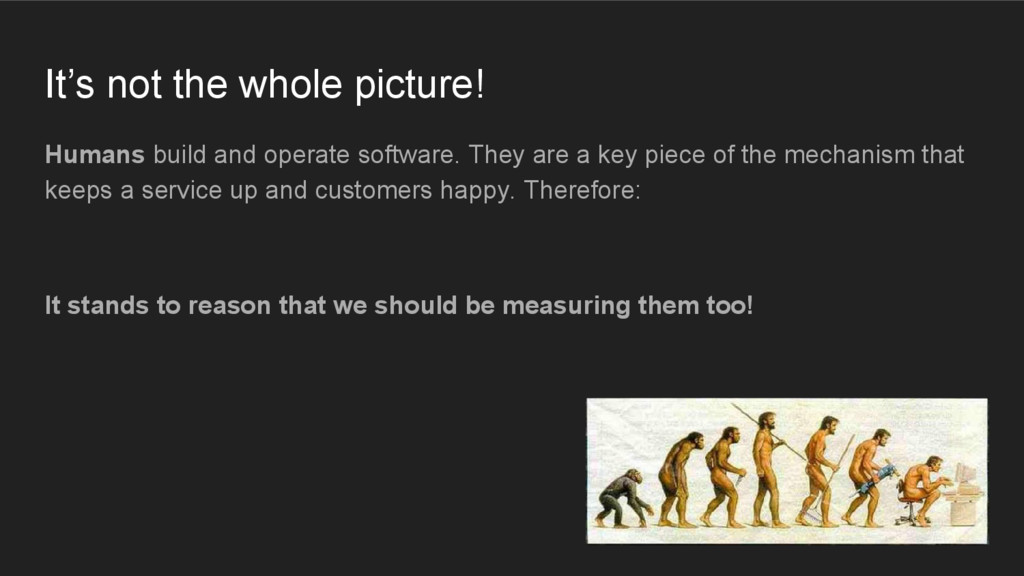
They are a key piece of the mechanism that keeps a service up and customers happy. Therefore: It stands to reason that we should be measuring them too!
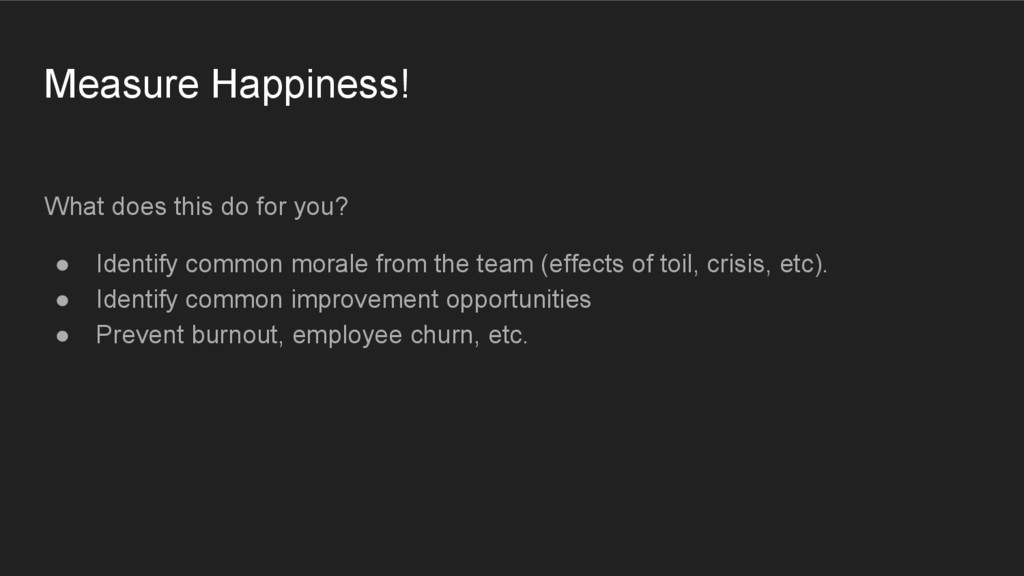
trying to keep your team engaged, happy, and retained, such metrics can enable you to: • be proactive about quality-of-life issues (alerts fatigue, toil, etc) • make team status transparent to the rest of the company • make justification for funding for more staffing/resources • identify opportunities for process improvement
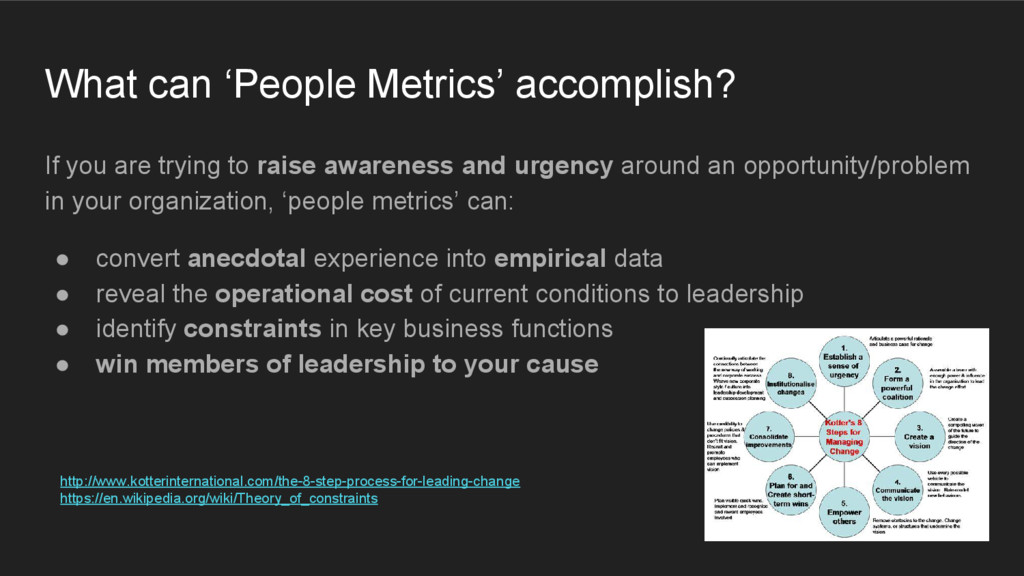
raise awareness and urgency around an opportunity/problem in your organization, ‘people metrics’ can: • convert anecdotal experience into empirical data • reveal the operational cost of current conditions to leadership • identify constraints in key business functions • win members of leadership to your cause http://www.kotterinternational.com/the-8-step-process-for-leading-change https://en.wikipedia.org/wiki/Theory_of_constraints
isn’t going to work. From Eli Goldratt’s The Goal: “The goal of an organization is to increase throughput while reducing both the inventory and operating expense.” YOU HAVE TO COMMUNICATE WITH LEADERSHIP IN THOSE TERMS!
more effectively? “Working on Team X stinks. We’re always firefighting and doing tickets.” OR “40% of Team X’s time is spent on incident response, and 30% is spent on manual tasks that the business needs. That is 70% of their time not spent on making improvements to the product or streamlining current processes.”
Project posits that there are four types of work in IT Operations. I argue the same is true for development teams too! • Business Projects: new features • Internal Projects: cleaning up tech debt, investment in CI/CD • Operational Change: releasing, provisioning, configuring • Unplanned Work: outages, firefighting, etc. If we somehow measure the quantity and percentage of each type of work over time, the business can know where their money is being spent and ensure the max return-on-investment.
do you do with such data? Of course you want to keep unplanned work to a minimum. For an Dev Team, you want maximum time spent on business projects (writing features). Business > internal > ops change > unplanned. For an Ops Team, you want maximum time spent on internal projects (to keep the service online and issues resolved as efficiently as possible). Internal > business > ops change > unplanned.
team needs to be dedicated to ticket duty and oncall, there is a serious problem with firefighting and a lack of automation.” - Tom Limoncelli, The Practice of Cloud System Administration, Volume 2
of time spent towards the upkeep of your service. It’s time not writing code or making improvements. Google SRE Team caps this metric at 50%. When exceeded, it overflows to the engineers.
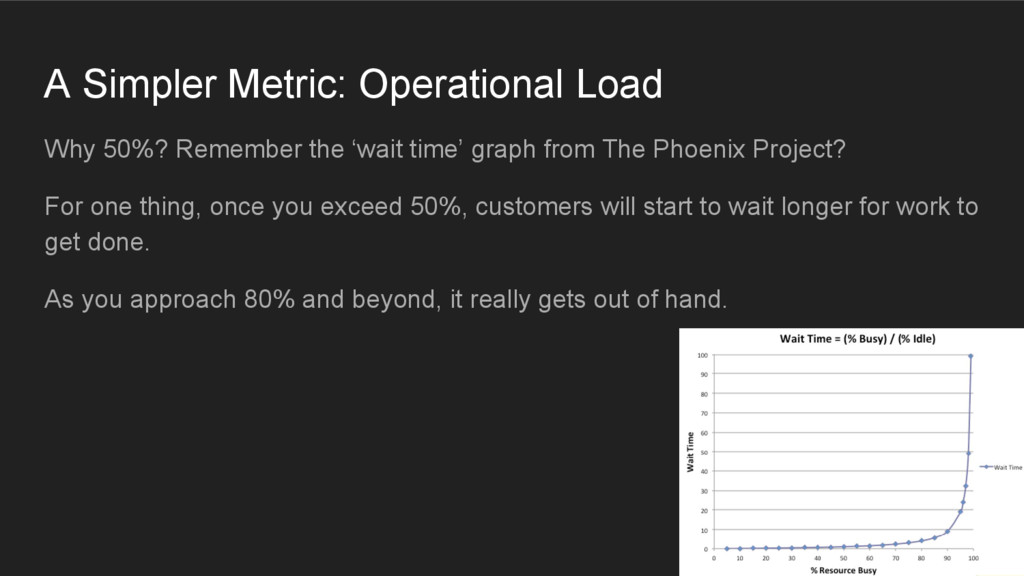
time’ graph from The Phoenix Project? For one thing, once you exceed 50%, customers will start to wait longer for work to get done. As you approach 80% and beyond, it really gets out of hand.
service. I mean ‘idle time’. Slack means that your team can be responsive to bursts of unplanned work without a business impact. Slack means opportunities to improve skillsets and team morale. The 20’th century management style of keeping slack lean/nonexistent doesn't work (that creates constraints!) Flow of work can be inconsistent. Be prepared!
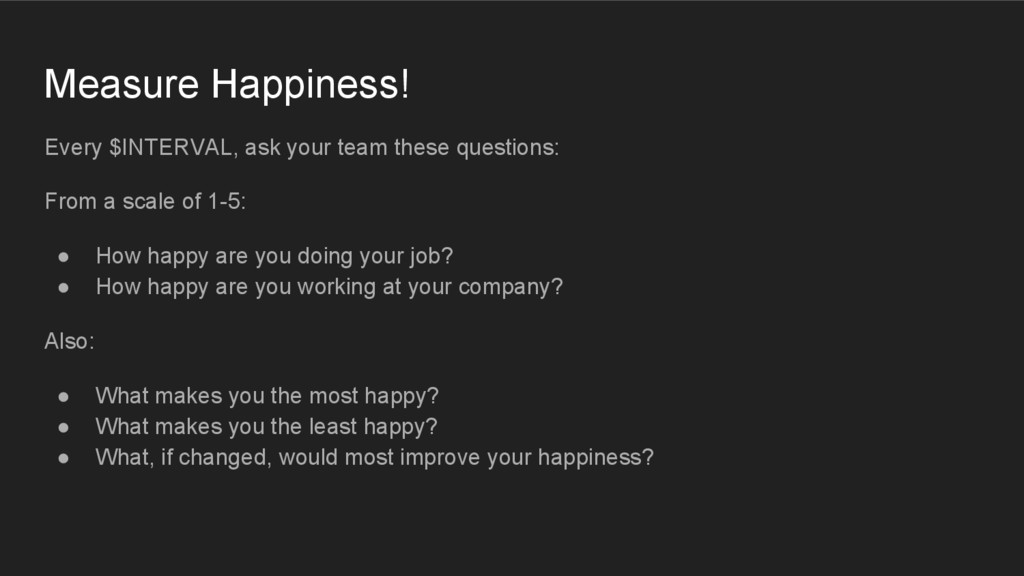
a scale of 1-5: • How happy are you doing your job? • How happy are you working at your company? Also: • What makes you the most happy? • What makes you the least happy? • What, if changed, would most improve your happiness?
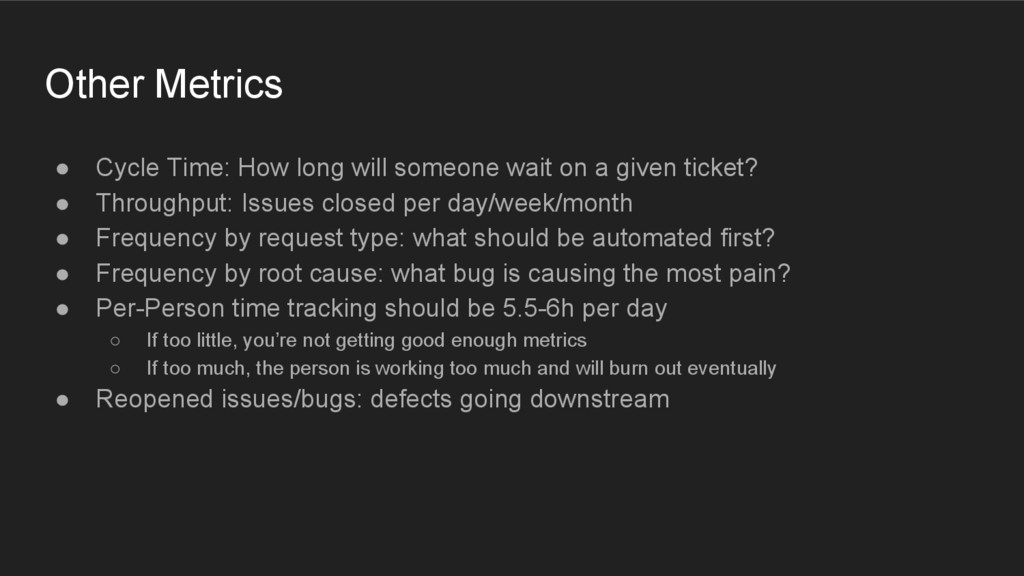
on a given ticket? • Throughput: Issues closed per day/week/month • Frequency by request type: what should be automated first? • Frequency by root cause: what bug is causing the most pain? • Per-Person time tracking should be 5.5-6h per day ◦ If too little, you’re not getting good enough metrics ◦ If too much, the person is working too much and will burn out eventually • Reopened issues/bugs: defects going downstream
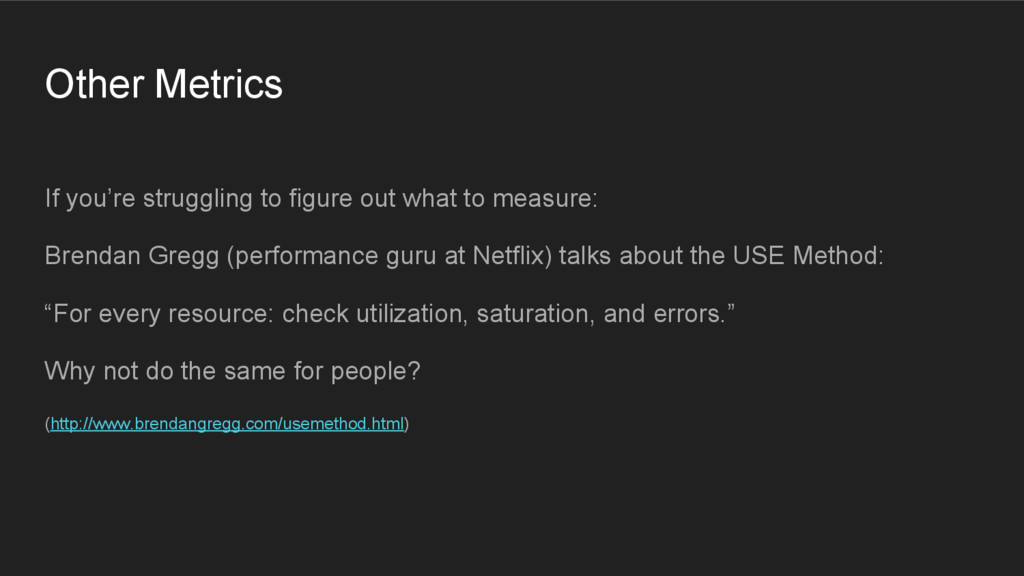
measure: Brendan Gregg (performance guru at Netflix) talks about the USE Method: “For every resource: check utilization, saturation, and errors.” Why not do the same for people? (http://www.brendangregg.com/usemethod.html)
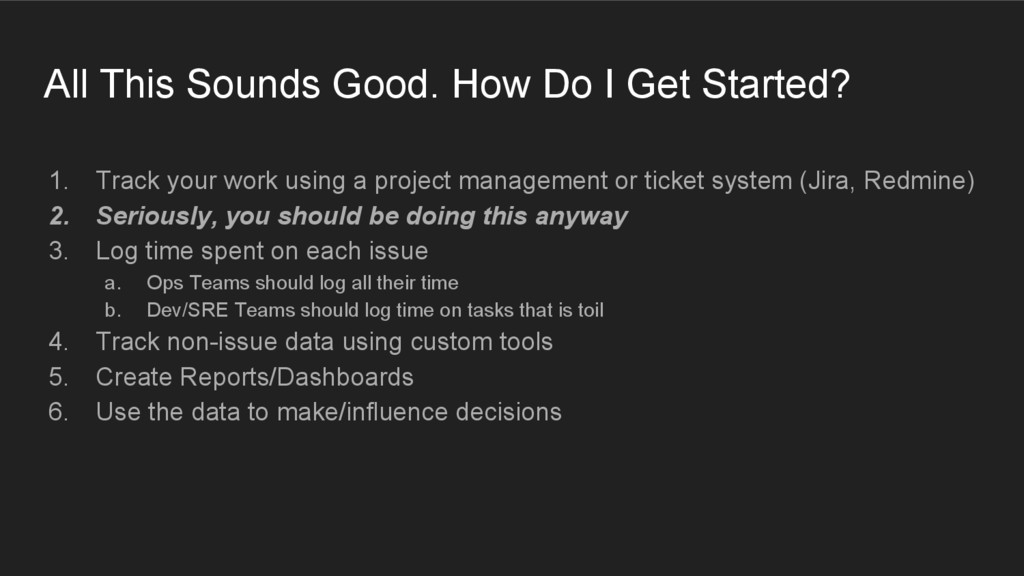
Track your work using a project management or ticket system (Jira, Redmine) 2. Seriously, you should be doing this anyway 3. Log time spent on each issue a. Ops Teams should log all their time b. Dev/SRE Teams should log time on tasks that is toil 4. Track non-issue data using custom tools 5. Create Reports/Dashboards 6. Use the data to make/influence decisions
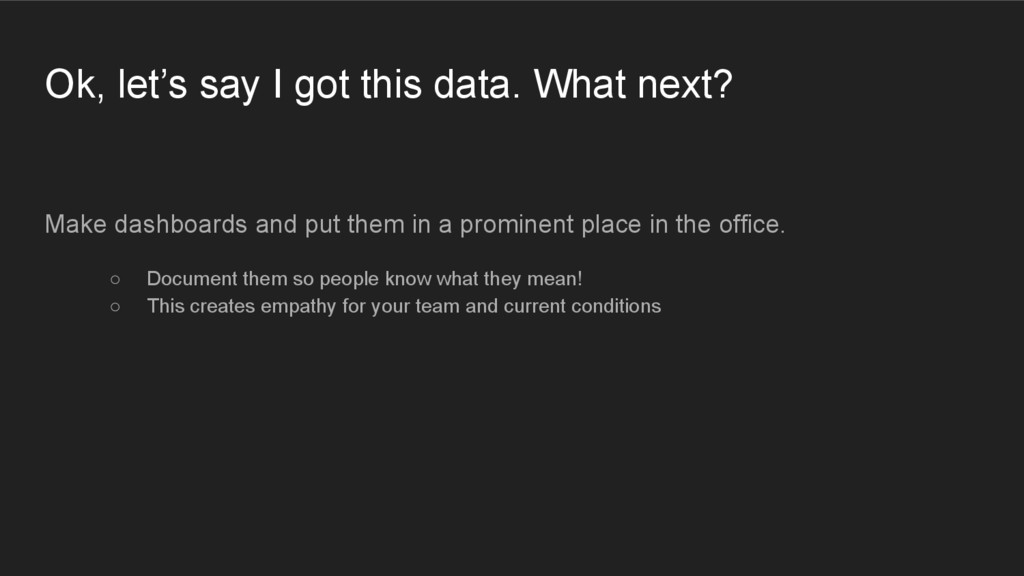
dashboards and put them in a prominent place in the office. ◦ Document them so people know what they mean! ◦ This creates empathy for your team and current conditions
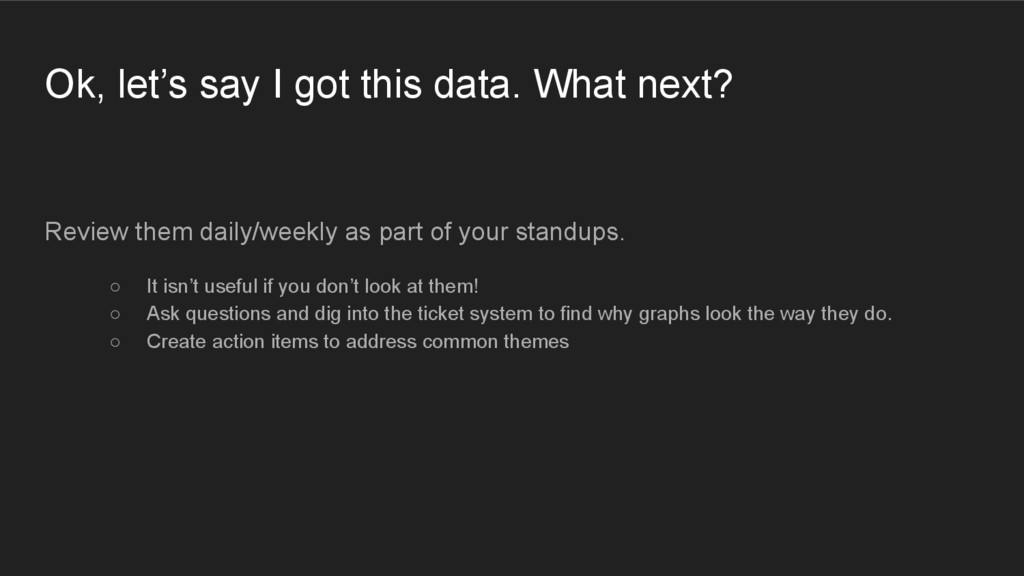
them daily/weekly as part of your standups. ◦ It isn’t useful if you don’t look at them! ◦ Ask questions and dig into the ticket system to find why graphs look the way they do. ◦ Create action items to address common themes
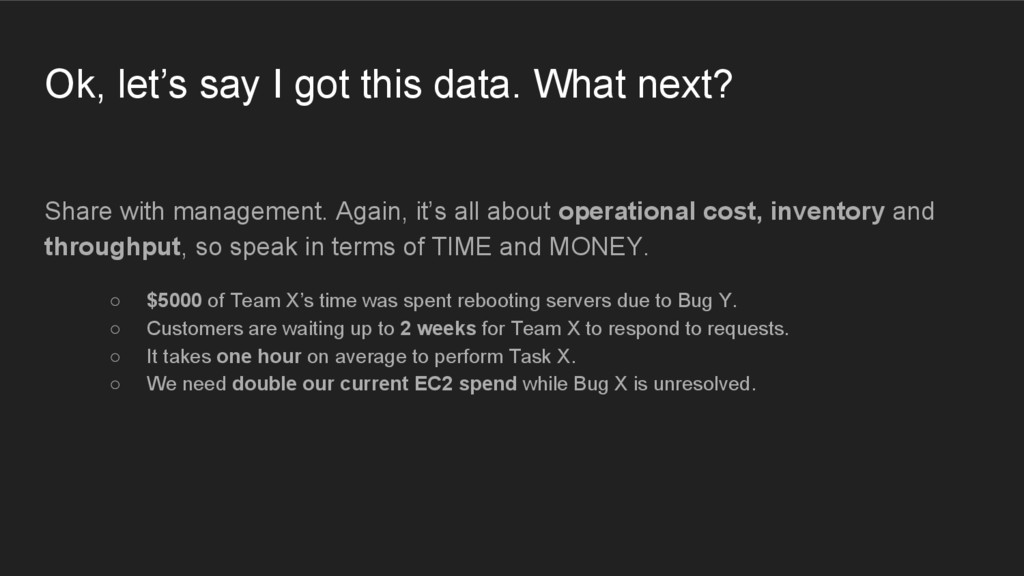
with management. Again, it’s all about operational cost, inventory and throughput, so speak in terms of TIME and MONEY. ◦ $5000 of Team X’s time was spent rebooting servers due to Bug Y. ◦ Customers are waiting up to 2 weeks for Team X to respond to requests. ◦ It takes one hour on average to perform Task X. ◦ We need double our current EC2 spend while Bug X is unresolved.
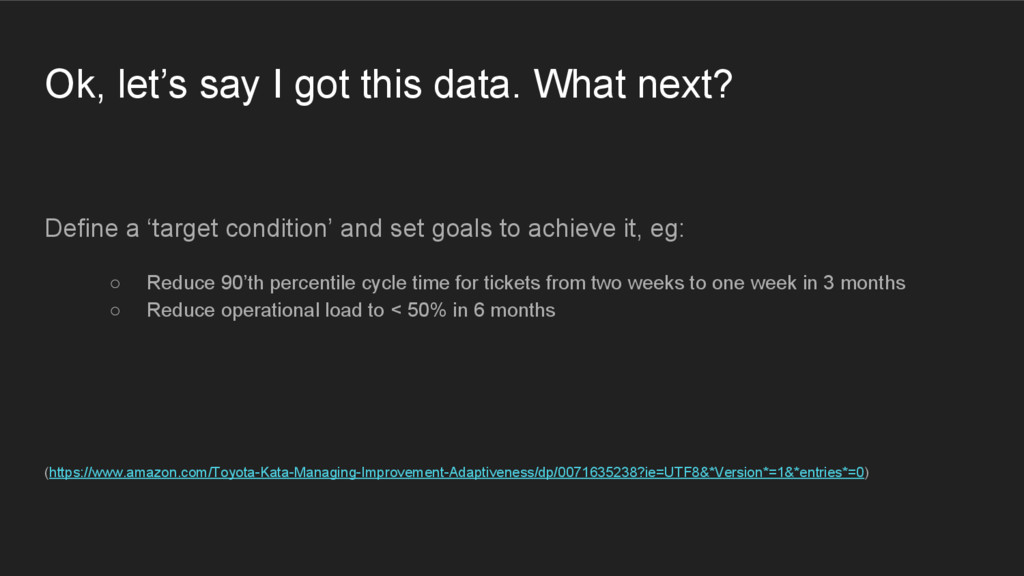
a ‘target condition’ and set goals to achieve it, eg: ◦ Reduce 90’th percentile cycle time for tickets from two weeks to one week in 3 months ◦ Reduce operational load to < 50% in 6 months (https://www.amazon.com/Toyota-Kata-Managing-Improvement-Adaptiveness/dp/0071635238?ie=UTF8&*Version*=1&*entries*=0)
spent.. • Create a custom field called ‘Work Type’ with values ‘Business’, ‘Internal’, ‘Ops Change’, and ‘Unplanned’. • The tables that you care about are: ◦ ‘worklog’: time tracking events ◦ ‘customfieldvalue’: maps custom field values to issues • If you look for entries in the work log where worklog.issueid is equal to customfieldvalue.ISSUE and look for a specific customfieldvalue. CUSTOMFIELD.. you can sum up the results for a given worktype and generate your own metrics.. hint hint nudge nudge . (https://developer.atlassian.com/jiradev/jira-platform/jira-architecture/database-schema/database-custom-fields)
![Thank You! Amin Astaneh [email protected] twitter: @aastaneh freenode: amin](https://files.speakerdeck.com/presentations/a8db22793e044bb5b87444e59c6da832/slide_30.jpg)