Upgrade to Pro — share decks privately, control downloads, hide ads and more …

Key Metrics to Release Better Software Faster

Key Metrics to Release Better Software Faster

Asad Ali (@AsadThoughts) from Dynatrace shares a number of metrics that can be used to gauge the effectiveness of your software delivery pipeline.

Presented at the June 2016 Boston DevOps meetup.

http://www.meetup.com/Boston-Devops/events/231351549/

Boston DevOps

June 22, 2016
Tweet

More Decks by Boston DevOps

Other Decks in Technology

Transcript

  1. Asad Ali @AsadThoughts Key Metrics to Release Better Software Faster

    - More on http://blog.dynatrace.com - Dynatrace Free Trial: http://bit.ly/dttrial
  2. Waterfall -> Agile: 3 Years 1 Deployment per Month EVERYONE

    ca do Co ti uous Delive y EVERY MANUAL TE“TER DOE“ AUTOMATION!
  3. Utmost Goal: Minimize Cycle Time feature cycle time time This

    is when you create value! minimize You
  4. High Performers Are More Agile 30x 8,000x more frequent deployments

    faster lead times than their peers Source: Puppet Labs 2013 State Of DevOps: http://puppetlabs.com/2013-state-of-devops-infographic
  5. High Performers Are More Reliable 2x 12x the change success

    rate faster mean time to recover (MTTR) Source: Puppet Labs 2013 State Of DevOps: http://puppetlabs.com/2013-state-of-devops-infographic
  6. Mobile Landing Page of Super Bowl Ad 434 Resources in

    total on that page: 0 JPEGs, 75 PNGs, 50 GIFs, … Total size of ~ 20MB
  7. Test Environment Production Environment Hibernate, Classloading, XML – The Key

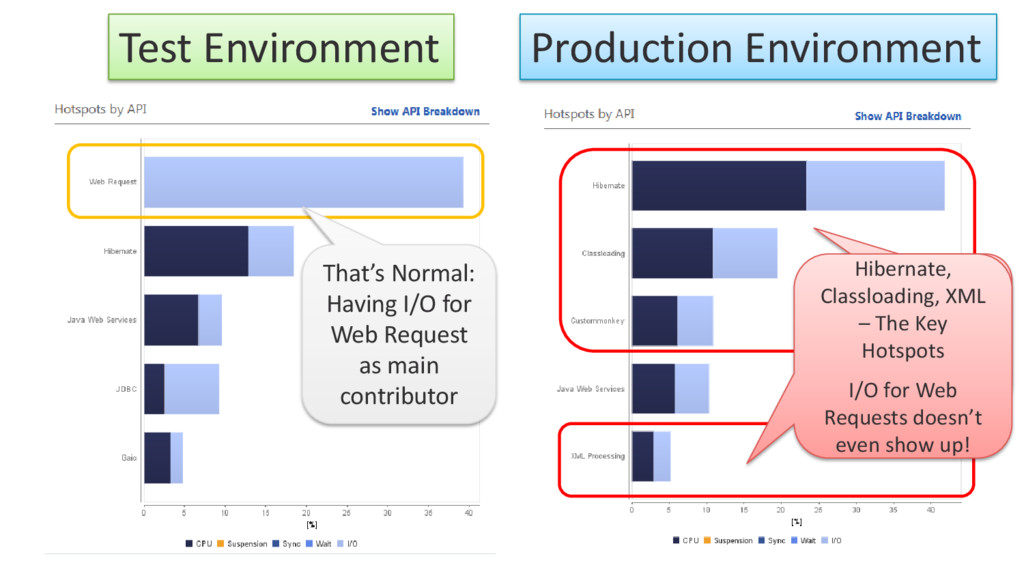
    Hotspots Hibernate, Classloading, XML – The Key Hotspots I/O for Web Re uests does ’t even show up! That’s No al: Having I/O for Web Request as main contributor
  8. Top Methods related to XML Processing Classloading is triggered through

    CustomMonnkey and the Xalan Parser Classloading is triggered through CustomMonkey and the Xalan Parser
  9. SQL Executions Finding: EVERY SQL statement is executed on ITS

    OWN Connection! Tip: Look at GetConnection
  10. SQL Executions #1: Same SQL is executed 67! times #2:

    NO PREPARATION because everything executed on new Connection
  11. •# Resources •Size of Resources •Page Size •# Functional Errors

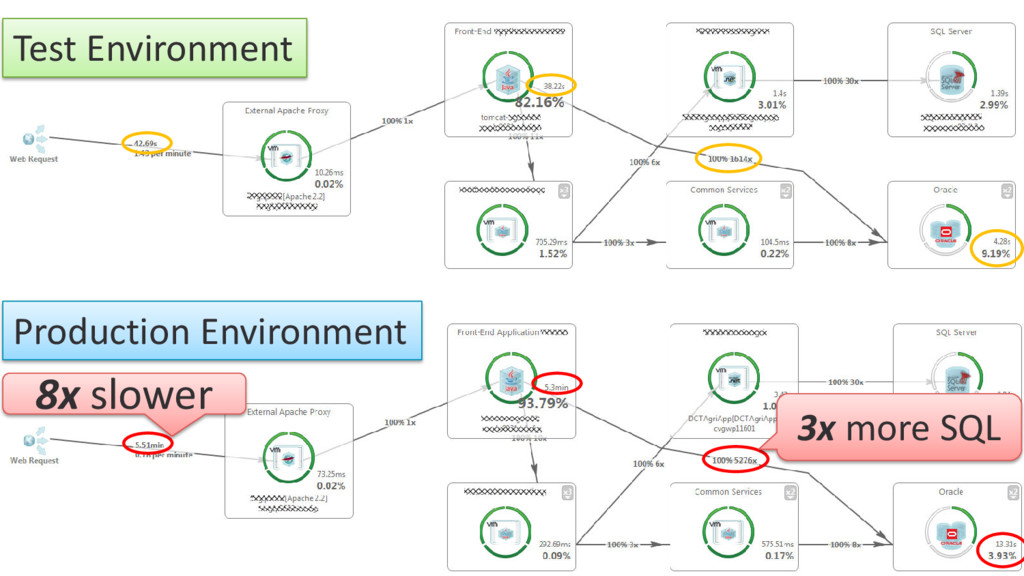
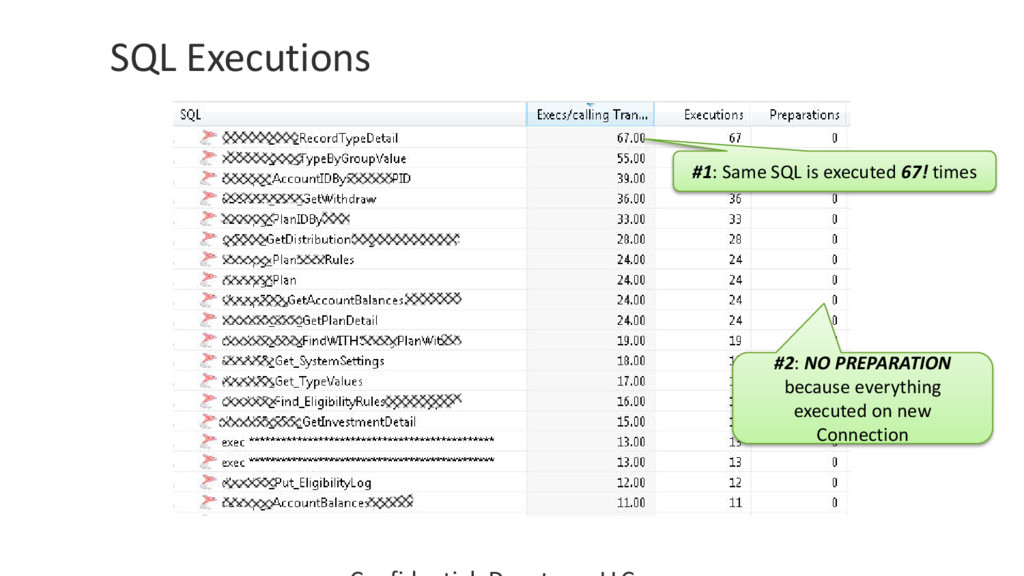
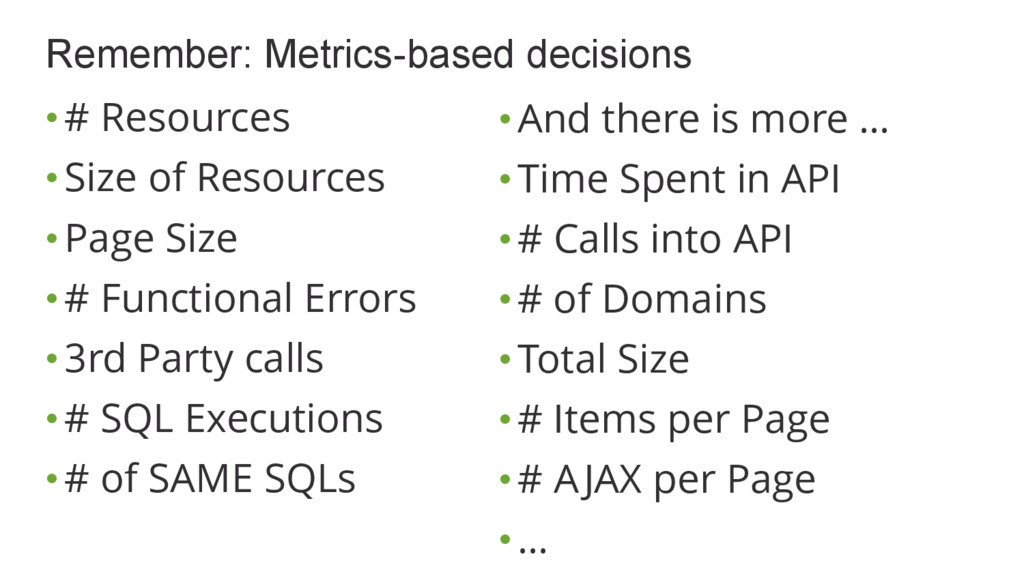
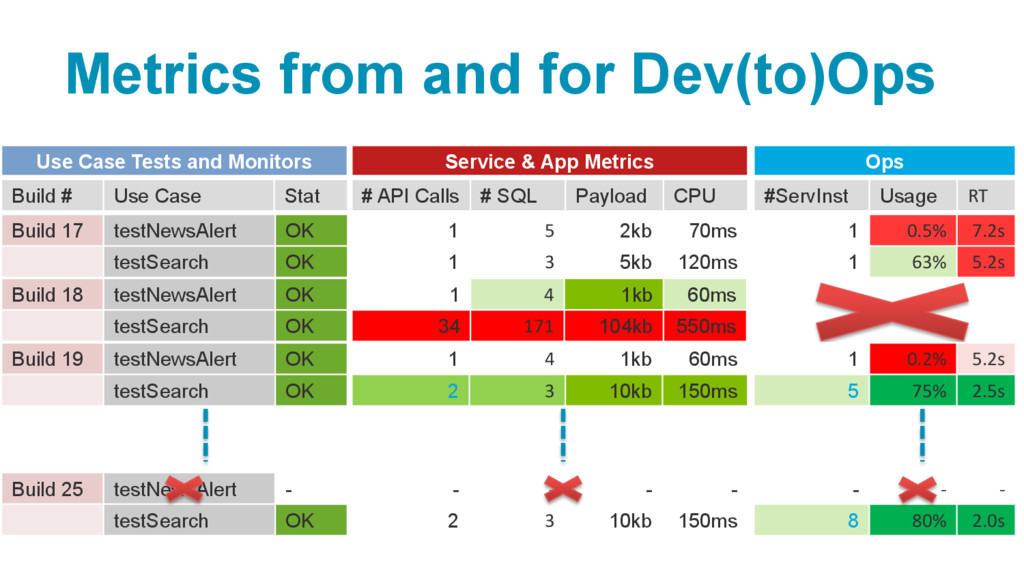
    •3rd Party calls •# SQL Executions •# of SAME SQLs Remember: Metrics-based decisions •And there is more … •Time Spent in API •# Calls into API •# of Domains •Total Size •# Items per Page •# AJAX per Page •…
  12. Build 17 testNewsAlert OK testSearch OK Build # Use Case

    Stat # API Calls # SQL Payload CPU 1 5 2kb 70ms 1 3 5kb 120ms Use Case Tests and Monitors Service & App Metrics Build 19 testNewsAlert OK testSearch OK Build 18 testNewsAlert OK testSearch OK 1 4 1kb 60ms 34 171 104kb 550ms Ops #ServInst Usage RT 1 0.5% 7.2s 1 63% 5.2s 1 4 1kb 60ms 2 3 10kb 150ms 1 0.2% 5.2s 5 75% 2.5s Build 25 testNewsAlert - testSearch OK - - - - 2 3 10kb 150ms - - - 8 80% 2.0s Metrics from and for Dev(to)Ops
  13. #1: Analyzing every Unit, Integration & REST API test #2:

    Key Architectural Metrics for each test #3: Detecting regression based on measure per Checkin Stop Bad Builds in CI