two vehicles • Rapidly spread to Germany, Austria, Netherlands, and then most of Europe • French Canadian clubs began in mid-nineties • Most US car sharing programs were formed in the last 6 years History of modern car sharing
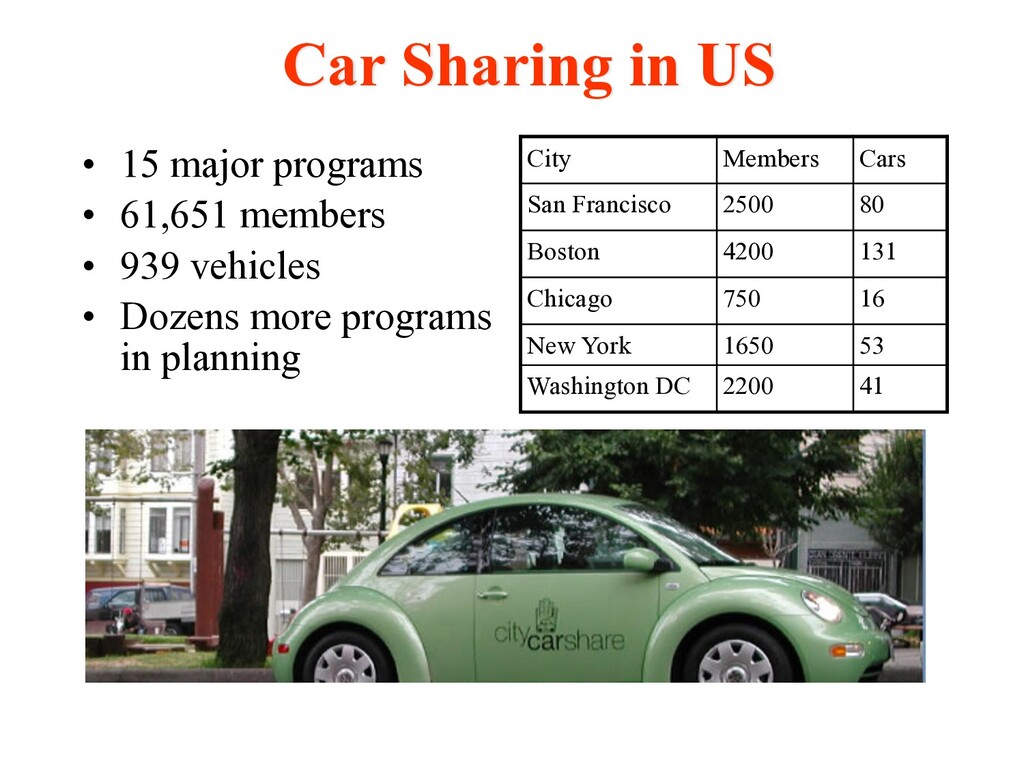
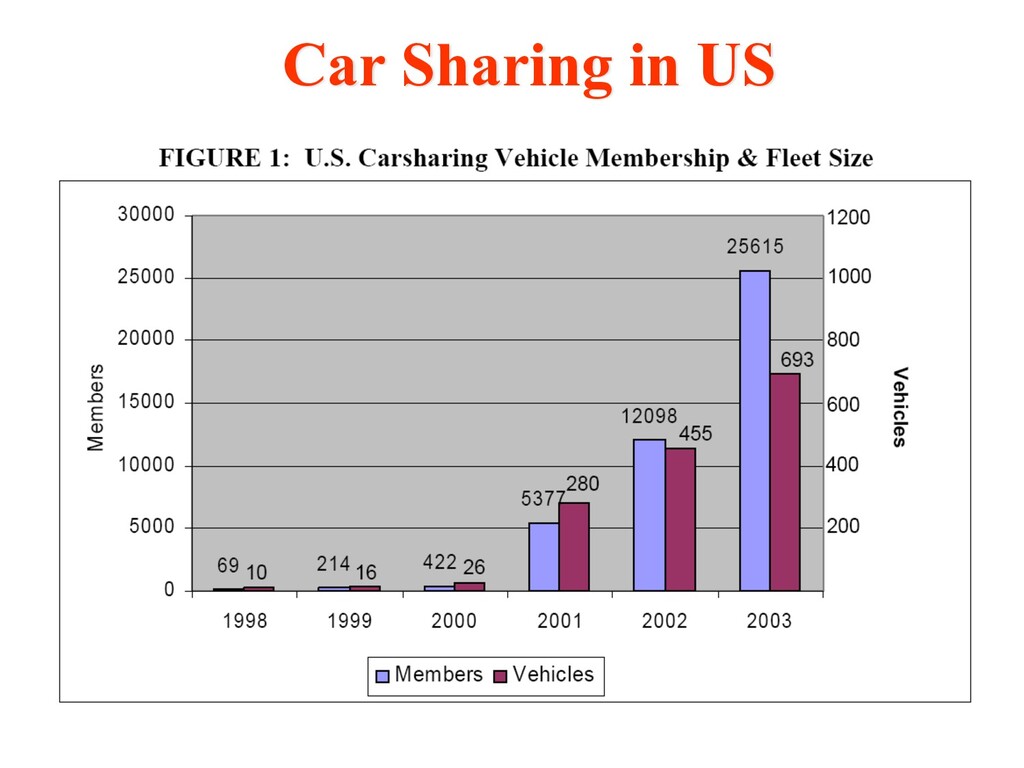
• Dozens more programs in planning Car Sharing in US City Members Cars San Francisco 2500 80 Boston 4200 131 Chicago 750 16 New York 1650 53 Washington DC 2200 41
availability online • Keyless entry to all vehicles • Onboard computer tracks mileage and time • Automatic billing by Credit Card Car Sharing Technology
Per Hour Other San Francisco (Non Profit) $30 $300 $10 $0.44 $4.00 Half Price Hourly after 10 PM New York (Zip Car) $25 $100 $4.16 $0.20 $8.50- $10.50 Each reservation includes 125 free miles Quebec City $0 $418 $2.30- $23.00 $0.12- $0.23 $1.22- $1.63 Various Plans involve higher monthly fees and lower per mile fees Berlin $65- $195 $325- $975 $0 $0.36 $10.40 Lower rates for 24 hour reservations possible London $0 $188 $28 $0.32 $5.25 Free hourly after midnight
rentals like traditional car rental – Encourages longer reservations and overnight use • Set number of miles built into reservation – Easier to estimate the cost of trips – Less incentive to reduce VMT • Reduced evening hourly rates – Encourages use during off peak times Car Sharing Policies
cities • Attracted by cost savings and environmental/ social implications • Car sharing is a lifestyle choice • Many use as a backup car to allow a 2-3 car household to drop one car. Car Sharing Customers
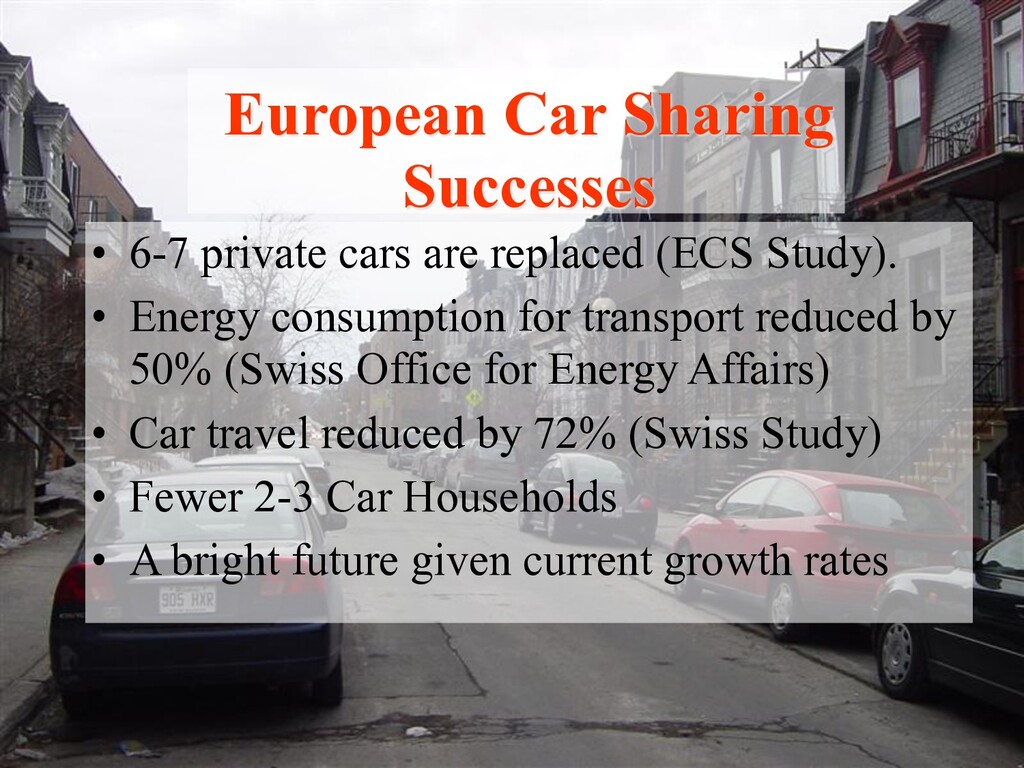
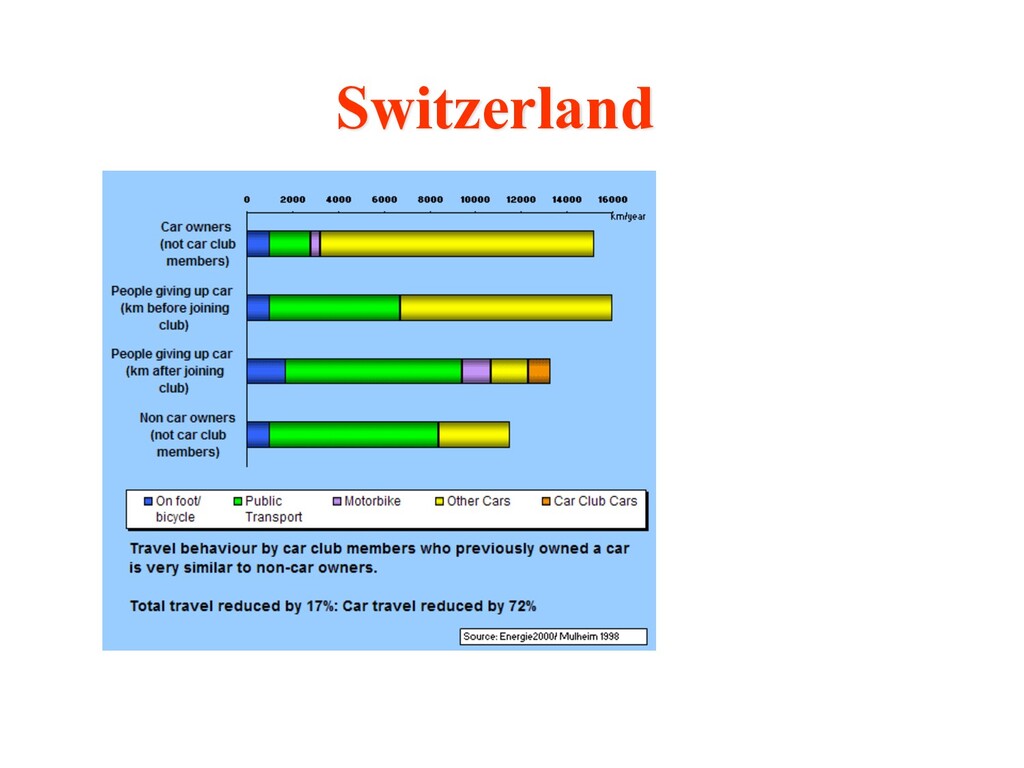
consumption for transport reduced by 50% (Swiss Office for Energy Affairs) • Car travel reduced by 72% (Swiss Study) • Fewer 2-3 Car Households • A bright future given current growth rates European Car Sharing Successes
higher in Europe so car sharing costs can be higher and still be competitive • Partnerships – Transit agencies promote car sharing by locating cars near or in transit facilities and promoting car sharing clubs on transit vehicles Differences
network including transit, intercity rail, walking/biking and taxis. – European programs partner with these agencies • Car locations are accessible – Walk, bike or use transit to access cars – Many agencies negotiate free or reduced parking rates for car sharing vehicles with local governments Lessons for the US
of their trips, or else they will own a car • Partnerships – Partnering with other car sharing agencies allows members to use cars in a variety of cities, reducing intercity driving and vehicle use in other cities. Car Sharing Requirements