Upgrade to Pro — share decks privately, control downloads, hide ads and more …

Progress and challenges in the Global Yield Gap Atlas

CGIAR-CSI
September 23, 2014
16

Progress and challenges in the Global Yield Gap Atlas

CGIAR-CSI

September 23, 2014
Tweet

Transcript

  1. Why yield gap analysis? ▪ Currently not possible to provide

    reliable answers to critical questions of policy makers and R&D organizations: ! ▪ What is the food production potential for a region or country if farmers adopted best management practices? ▪ Will it be possible for country X to be self-sufficient in food production by 2030 or 2050? ▪ When and where can we predict crop yields to stagnate because they reach biophysical yield ceilings? ▪ What are the causes of yield gaps and how to overcome them? ▪ What are the regions to target experimentation and what are extrapolation domains?
  2. Global Yield Gap Atlas: vision and goal ▪ Comprehensive, graphically

    intuitive, public: www.yieldgap.org ! ▪ Widely used by policy makers, researchers, students, and industry ! ▪ Transparent, robust and agronomically relevant protocol ! ▪ Bottom-up approach based on actual (point-based) data for weather, cropping systems and soils • up-scaled to national and regional levels ! !
  3. Yield gap analysis: protocol Climate zones Crop-specific harvested areas Weather

    station buffer zones Soil types and cropping systems Crop model simulations Actual yields Yield gaps
  4. Spatial framework and upscaling ! Ewert, van Ittersum et al.,

    2011. Agriculture, Ecosystems & Environment 142, 6-17.
  5. Van Wart et al., 2013. Field Crops Research 143, 44-55.

    Climate zonation • Minimize climatic heterogeneity while minimizing number of zones for data col • Based on combination of 3 parameters: - Growing degree days - Aridity index - Temperature seasonality • 10 x 10 x 3 = 300 potential zones, ~240 zones in cropped areas globally • Compared with other AEZ schemes (van Wart et al., 2013) • Current climate for now…. www.yieldgap.org
  6. Challenges! Climate zones Crop-specific harvested areas Weather station buffer zones

    Soil types and cropping systems Crop model simulations Actual yields Yield gaps
  7. Crop specific harvested areas ▪ SPAM (2000, 2005) ▪ Experts

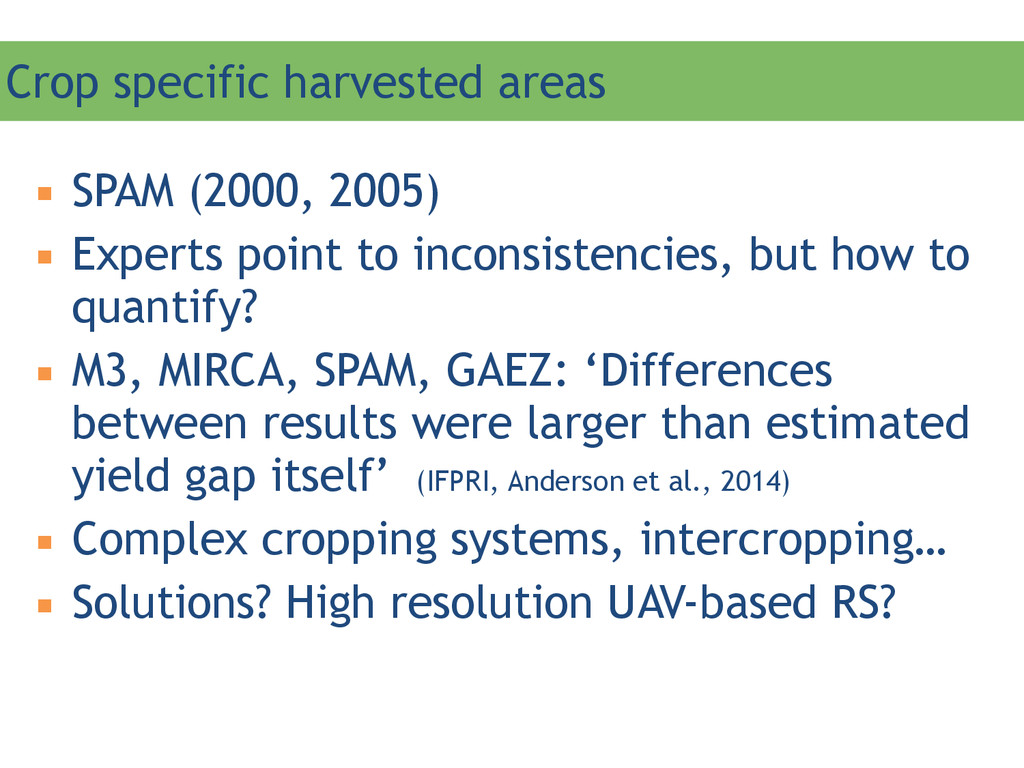
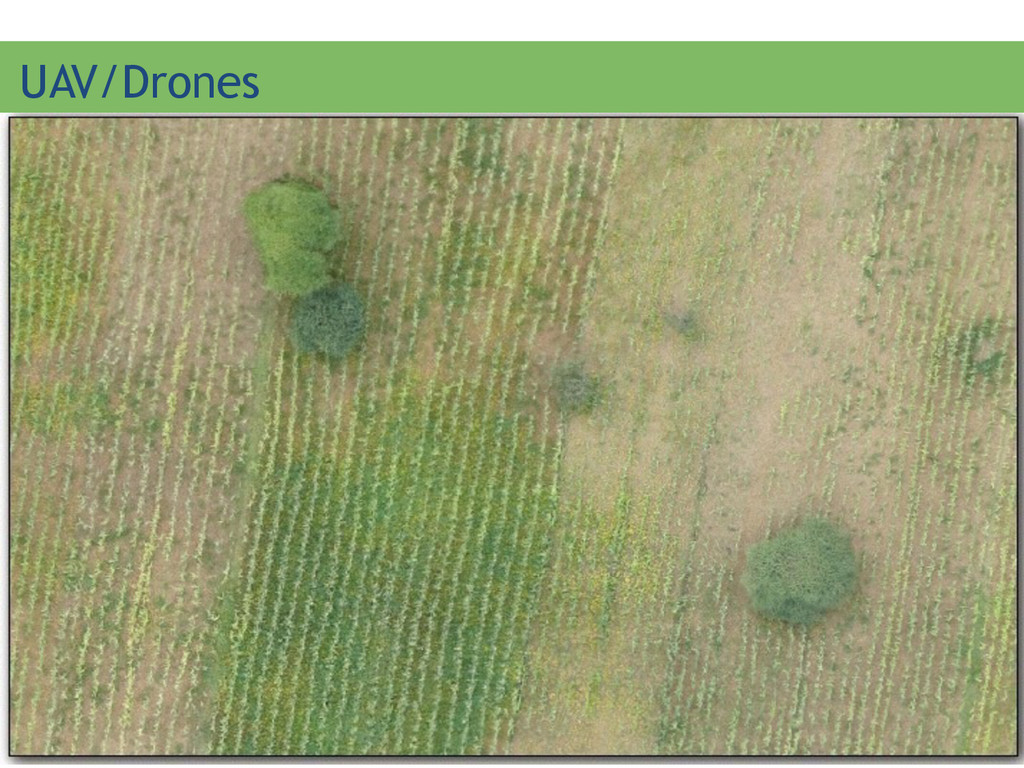
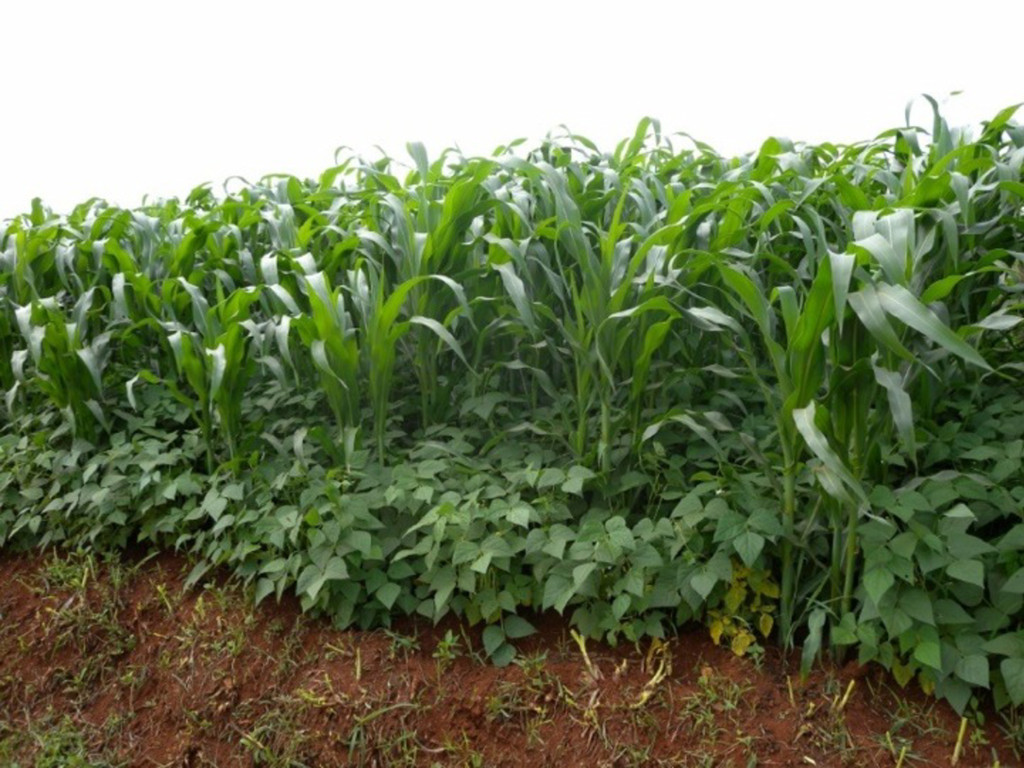
    point to inconsistencies, but how to quantify? ▪ M3, MIRCA, SPAM, GAEZ: ‘Differences between results were larger than estimated yield gap itself’ (IFPRI, Anderson et al., 2014) ▪ Complex cropping systems, intercropping… ▪ Solutions? High resolution UAV-based RS?
  8. Challenges! Climate zones Crop-specific harvested areas Weather station buffer zones

    Soil types and cropping systems Crop model simulations Actual yields Yield gaps
  9. Weather data for crop simulations ▪ First choice: Observed, daily,

    high quality, 10+ years • Tmin, Tmax, solar radiation, relative humidity, precipitation ▪ Acceptable: Observed, 3+ years of Tmin, Tmax • Missing data estimated by “propagation” ▪ Last resort: gridded data (NASA-POWER Agro-Climatic Data)
  10. Summary of a the comparison between NASA and observed daily

    weather data Good agreement Good correlation Poor agreement Good correlation Poor agreement Poor correlation NASA Solar radiation NASA Tmax, Tmin NASA relative humidity, rain • ‘Crude’ NASA radiation can be used for simulations, except at sites with complex topography • Good correlation between NASA vs. measured Tmax & Tmin but poor agreement. NASA temperature can be used for simulations after calibration against few years of measured data • Very poor agreement and correlation between NASA vs. measured relative humidity and precipitation humidity from Tdew, rainfall from TRMM Red dashed line: 1-to-1 line; solid black line: linear regression. Note that dots do not represent actual data! R2>0.82 ME: -1.0 to 1.1 MJ R2>0.82 ME= -3 to +2ºC R2<0.65 (RH) & 0.25 (rain) Measured weather data
  11. Simulations of yield potential based on propagated versus observed and

    gridded weather data (M) Maize (W) Wheat (R) Rice MarkSim weather generator NASA-POWER data Propagated weather data * OWD: Observed weather data * Each box plot represents the distribution of long- term average simulated yields based on the propagated weather files generated based on all possible subsets of 3 years of observed weather data used to calibrate NASA Tmax and Tmin Average long-term simulated yield based on observed weather data (Van Wart et al., submitted)
  12. Challenges! Climate zones Crop-specific harvested areas Weather station buffer zones

    Soil types and cropping systems Crop model simulations Actual yields Yield gaps
  13. Soil information ▪ Importance of soil depth for simulating Yw

    ! ! ! ! ! ▪ Little data on ‘effective soil depth’ or ‘root zone restriction’ e.g. hardpan, textural change, nutrient imbalance,…. ▪ Collaborating with AfSIS to improve on this (Hendriks et al., in prep)
  14. Interactive website: www.yieldgap.org • User friendly and transparent (open access

    to data and protocols used) • Range of visualization tools and data export possibilities THANKS!