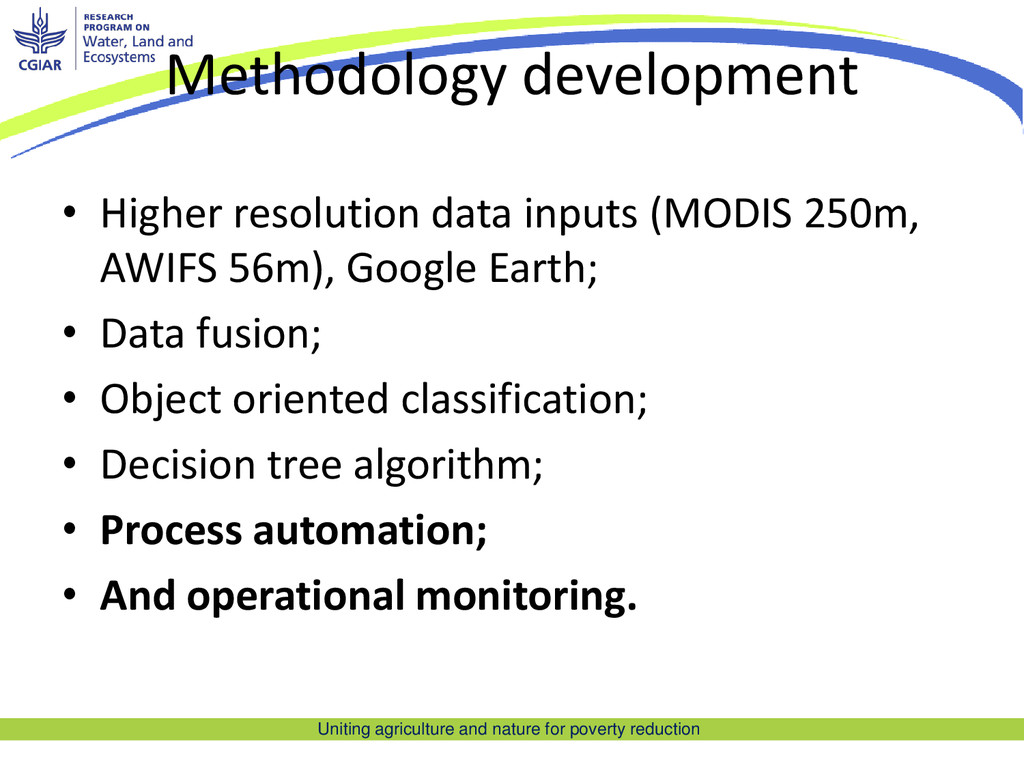
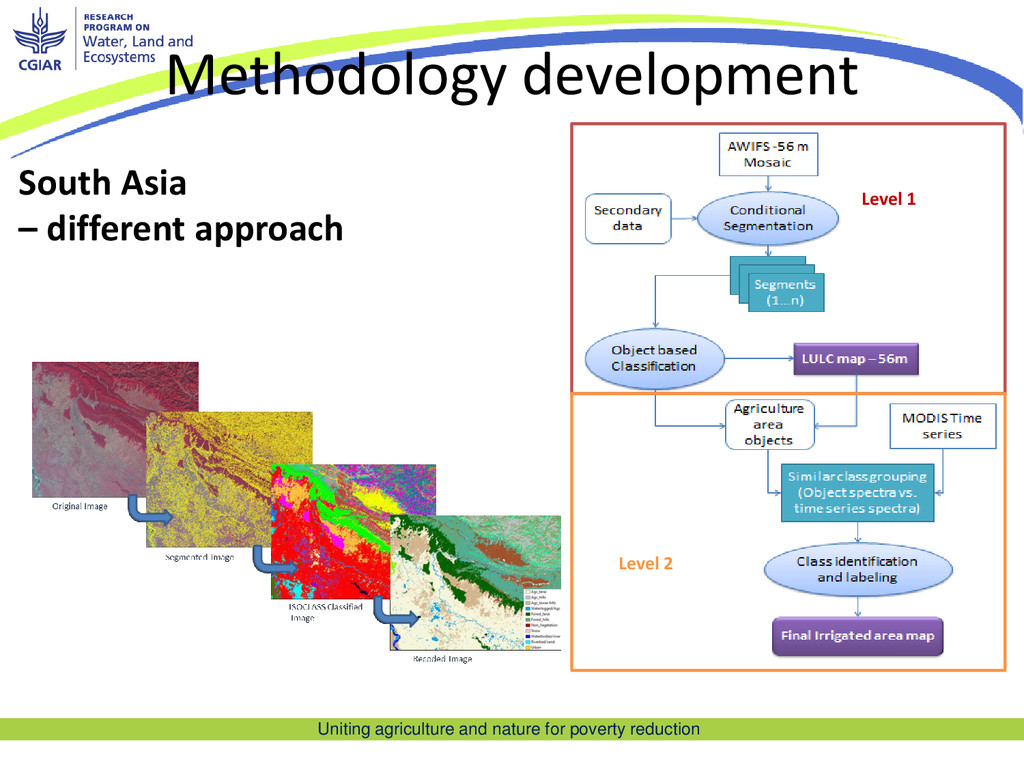
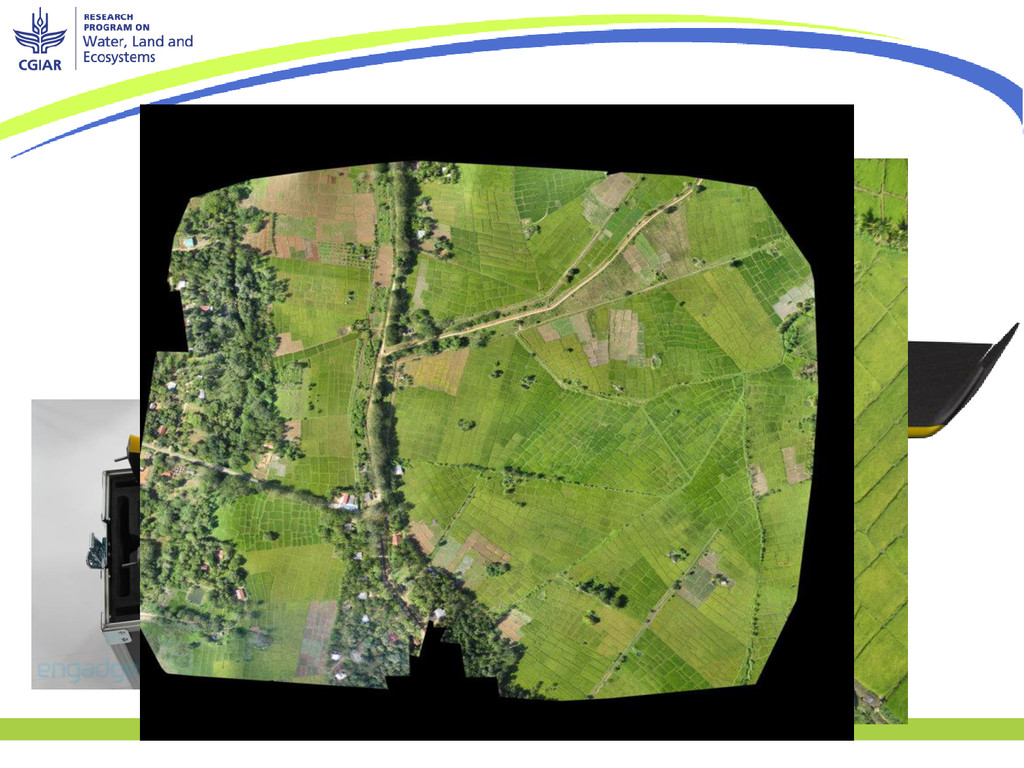
Higher resolution data inputs (MODIS 250m, AWIFS 56m), Google Earth; • Data fusion; • Object oriented classification; • Decision tree algorithm; • Process automation; • And operational monitoring.
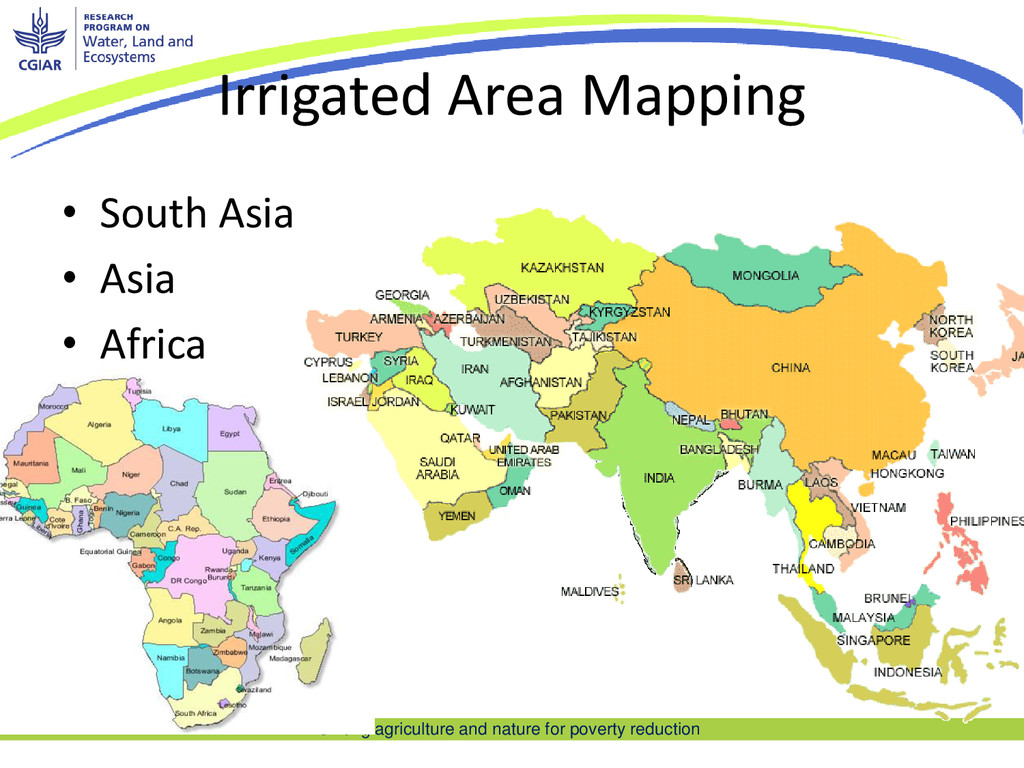
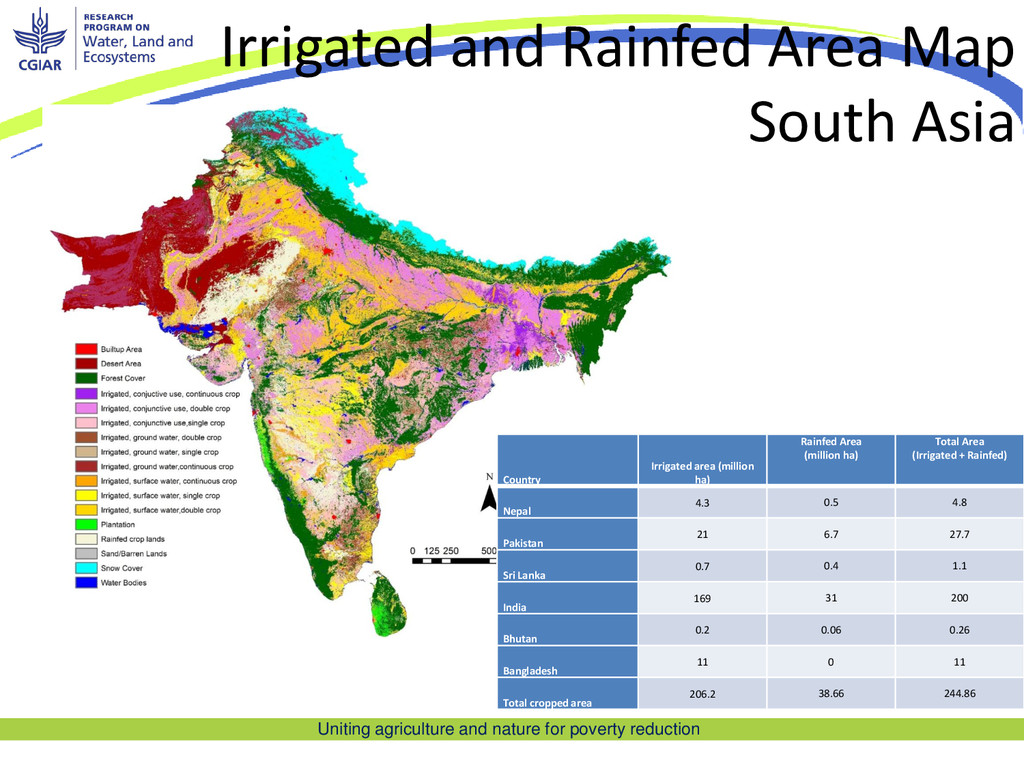
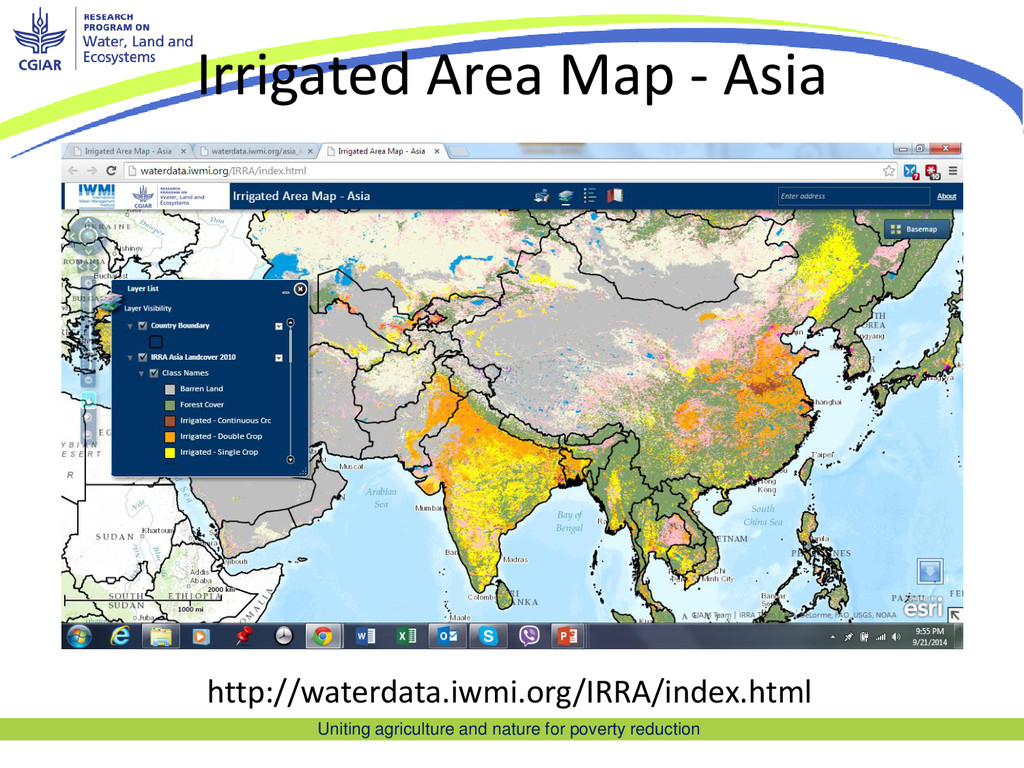
Area Map South Asia Country Irrigated area (million ha) Rainfed Area (million ha) Total Area (Irrigated + Rainfed) Nepal 4.3 0.5 4.8 Pakistan 21 6.7 27.7 Sri Lanka 0.7 0.4 1.1 India 169 31 200 Bhutan 0.2 0.06 0.26 Bangladesh 11 0 11 Total cropped area 206.2 38.66 244.86
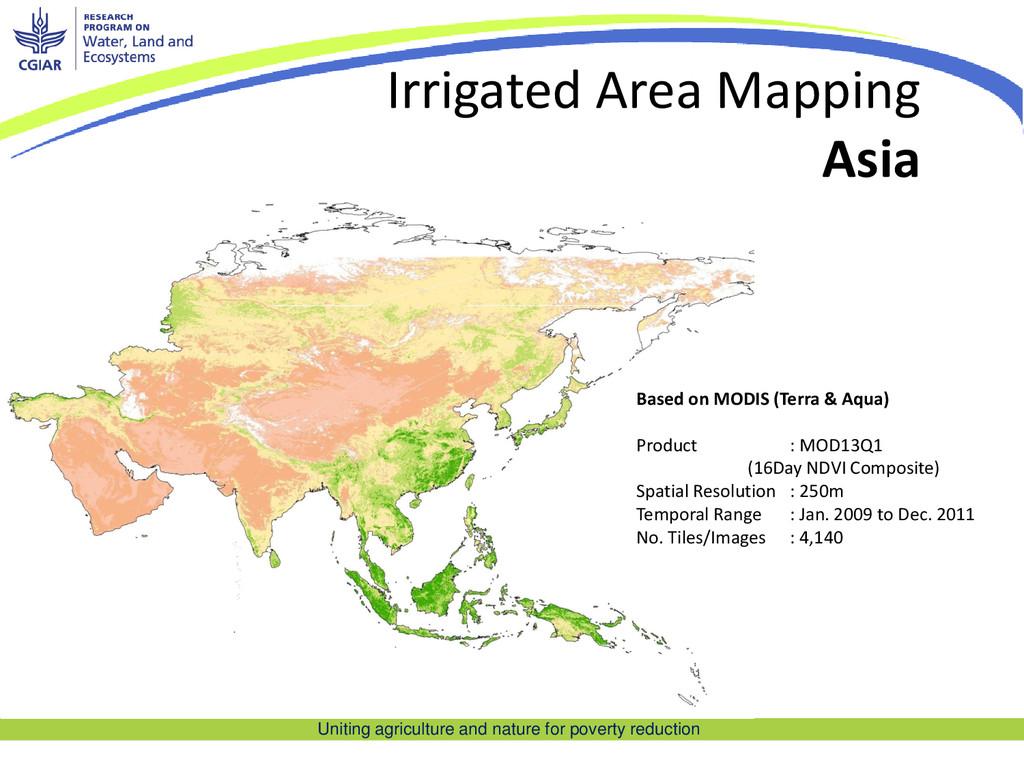
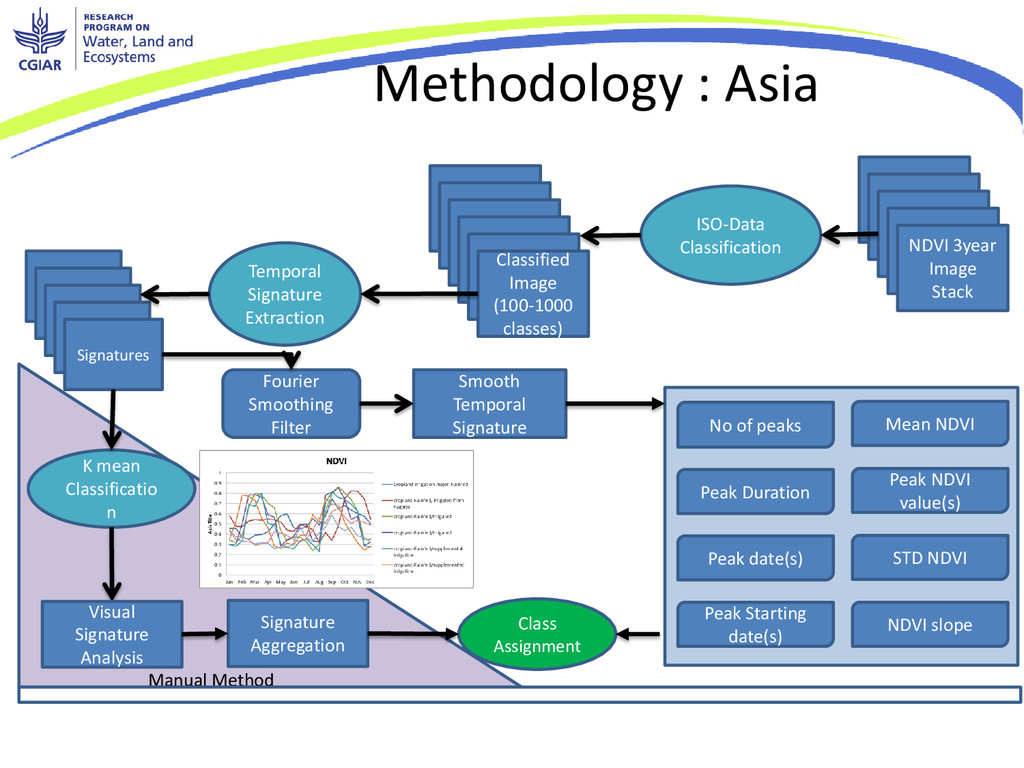
Asia Based on MODIS (Terra & Aqua) Product : MOD13Q1 (16Day NDVI Composite) Spatial Resolution : 250m Temporal Range : Jan. 2009 to Dec. 2011 No. Tiles/Images : 4,140
Image stack Image NDVI 3year Image Stack ISO-Data Classification (100-1000 class) (100-1000 class) (100-1000 class) (100-1000 class) (100-1000 class) Classified Image (100-1000 classes) Temporal Signature Extraction Signatur e text Signatur e text Signatur e text Signatur e text Signatures Signature Aggregation K mean Classificatio n Class Assignment Fourier Smoothing Filter Smooth Temporal Signature No of peaks Peak Duration Mean NDVI Peak Starting date(s) Peak date(s) NDVI slope STD NDVI Peak NDVI value(s) Visual Signature Analysis
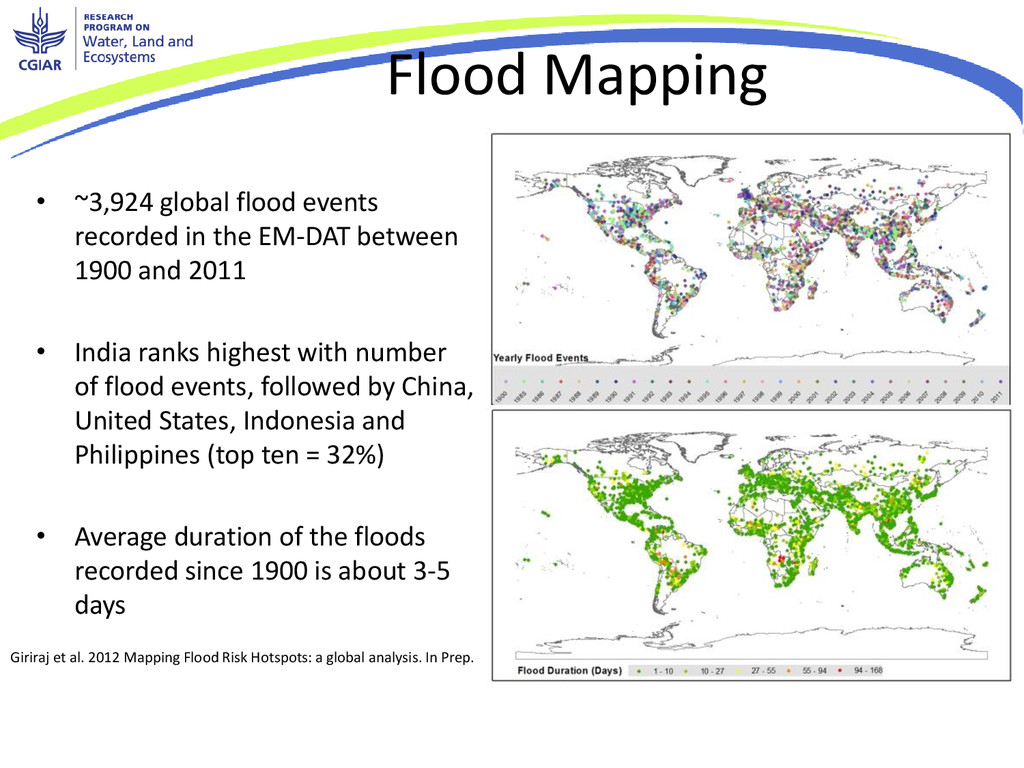
EM-DAT between 1900 and 2011 • India ranks highest with number of flood events, followed by China, United States, Indonesia and Philippines (top ten = 32%) • Average duration of the floods recorded since 1900 is about 3-5 days Giriraj et al. 2012 Mapping Flood Risk Hotspots: a global analysis. In Prep.
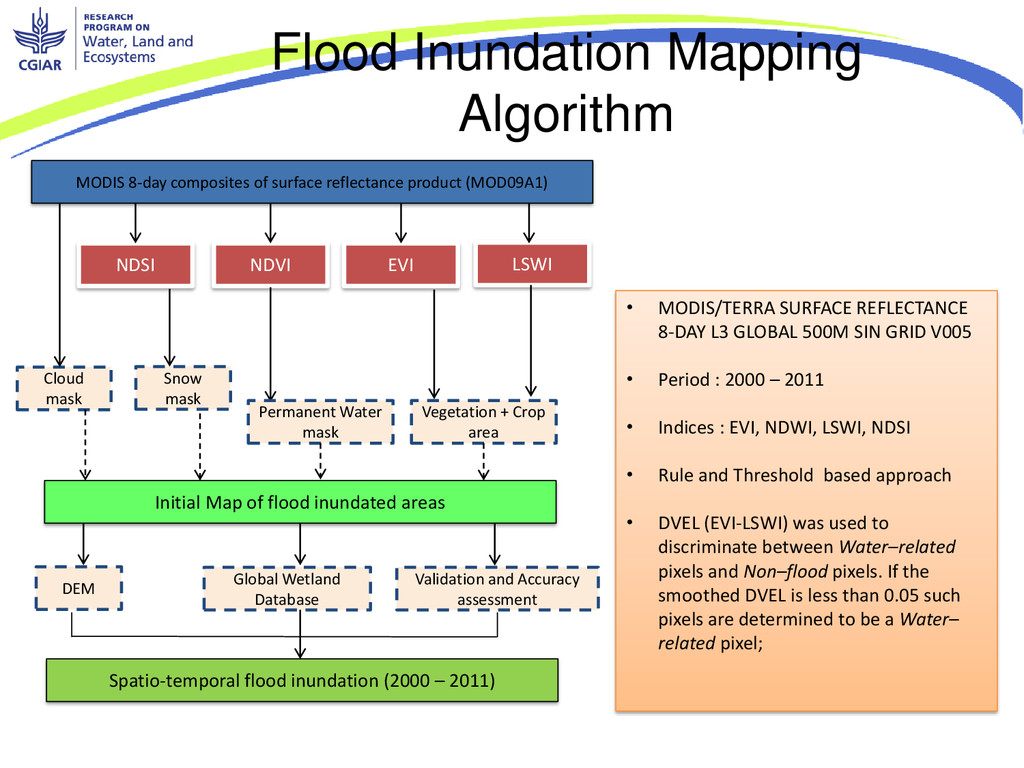
GLOBAL 500M SIN GRID V005 • Period : 2000 – 2011 • Indices : EVI, NDWI, LSWI, NDSI • Rule and Threshold based approach • DVEL (EVI-LSWI) was used to discriminate between Water–related pixels and Non–flood pixels. If the smoothed DVEL is less than 0.05 such pixels are determined to be a Water– related pixel; MODIS 8-day composites of surface reflectance product (MOD09A1) Initial Map of flood inundated areas Cloud mask NDSI NDVI EVI LSWI Snow mask Permanent Water mask Vegetation + Crop area DEM Global Wetland Database Validation and Accuracy assessment Spatio-temporal flood inundation (2000 – 2011)
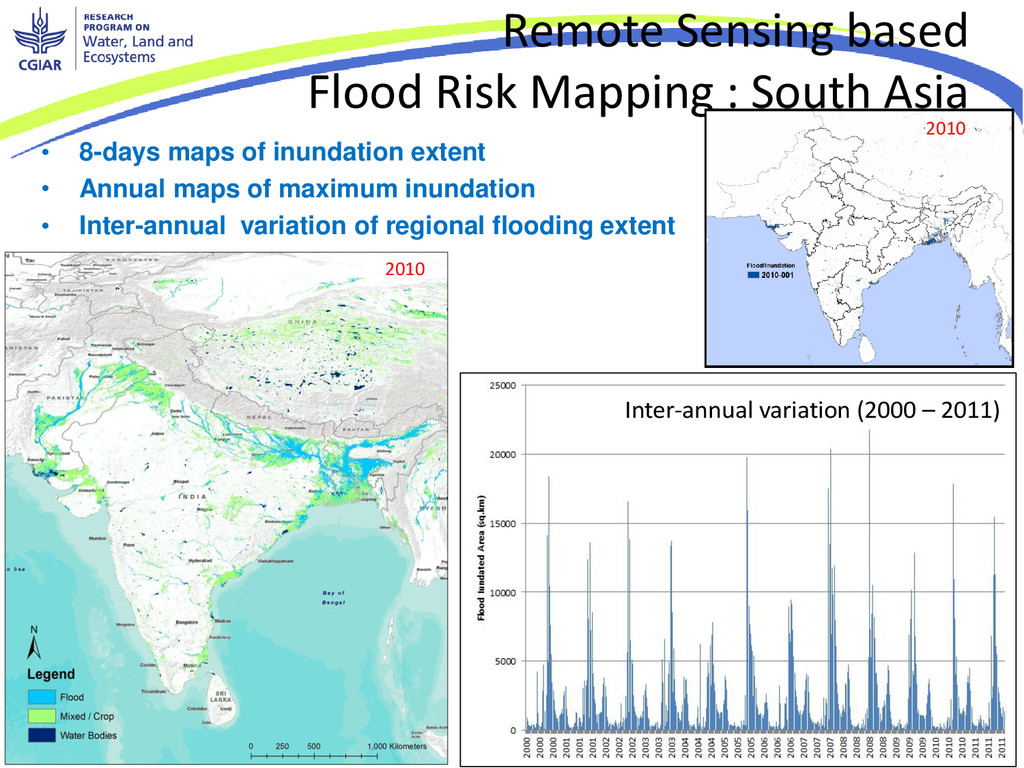
8-days maps of inundation extent • Annual maps of maximum inundation • Inter-annual variation of regional flooding extent Flood Mixed (Crop) Water bodies Inter-annual variation (2000 – 2011) Normal River 2010 2010
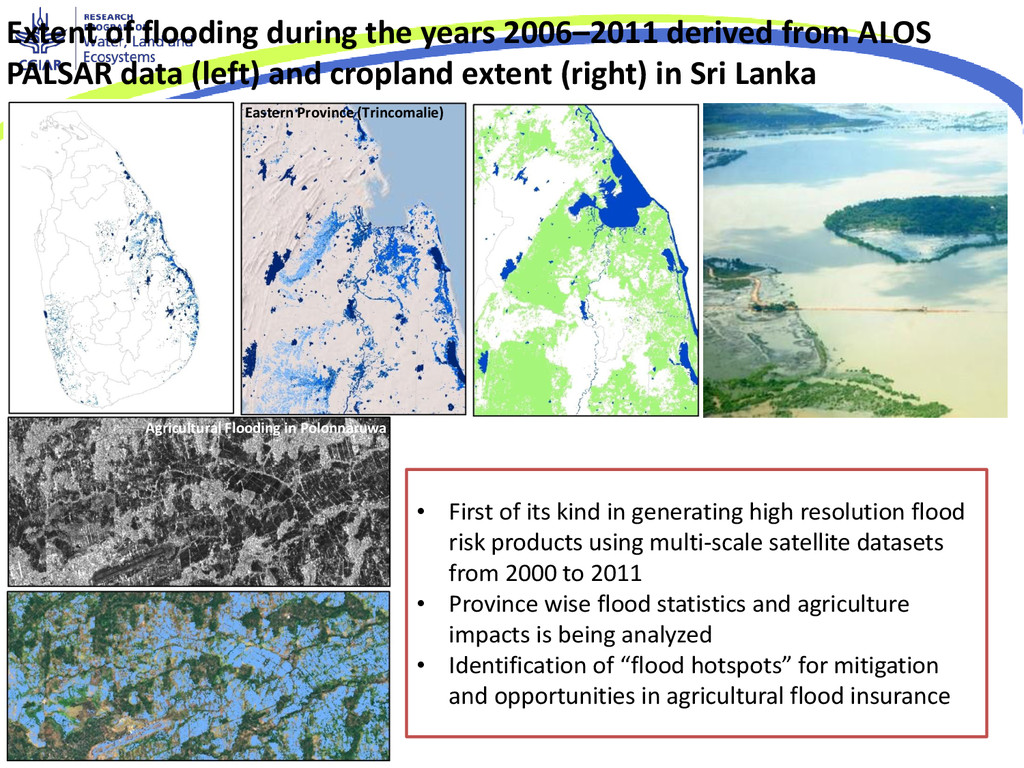
PALSAR data (left) and cropland extent (right) in Sri Lanka • First of its kind in generating high resolution flood risk products using multi-scale satellite datasets from 2000 to 2011 • Province wise flood statistics and agriculture impacts is being analyzed • Identification of “flood hotspots” for mitigation and opportunities in agricultural flood insurance Eastern Province (Trincomalie) Agricultural Flooding in Polonnaruwa
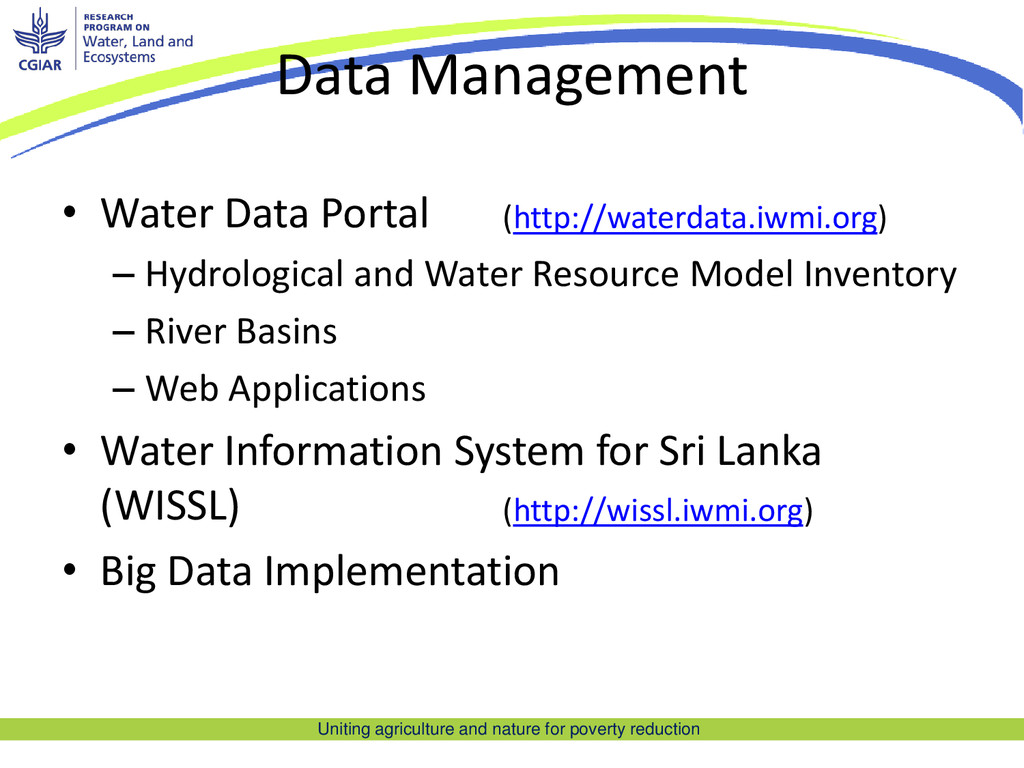
Water Data Portal – Hydrological and Water Resource Model Inventory – River Basins – Web Applications • Water Information System for Sri Lanka (WISSL) • Big Data Implementation (http://waterdata.iwmi.org) (http://wissl.iwmi.org)