discover memory usage of my application in Android −http://stackoverflow.com/questions/2298208/how-to-discover- memory-usage-of-my-application-in-android/ • Note that memory usage on modern operating systems like Linux is an extremely complicated and difficult to understand area. In fact the chances of you actually correctly interpreting whatever numbers you get is extremely low. (Pretty much every time I look at memory usage numbers with other engineers, there is always a long discussion about what they actually mean that only results in a vague conclusion.)
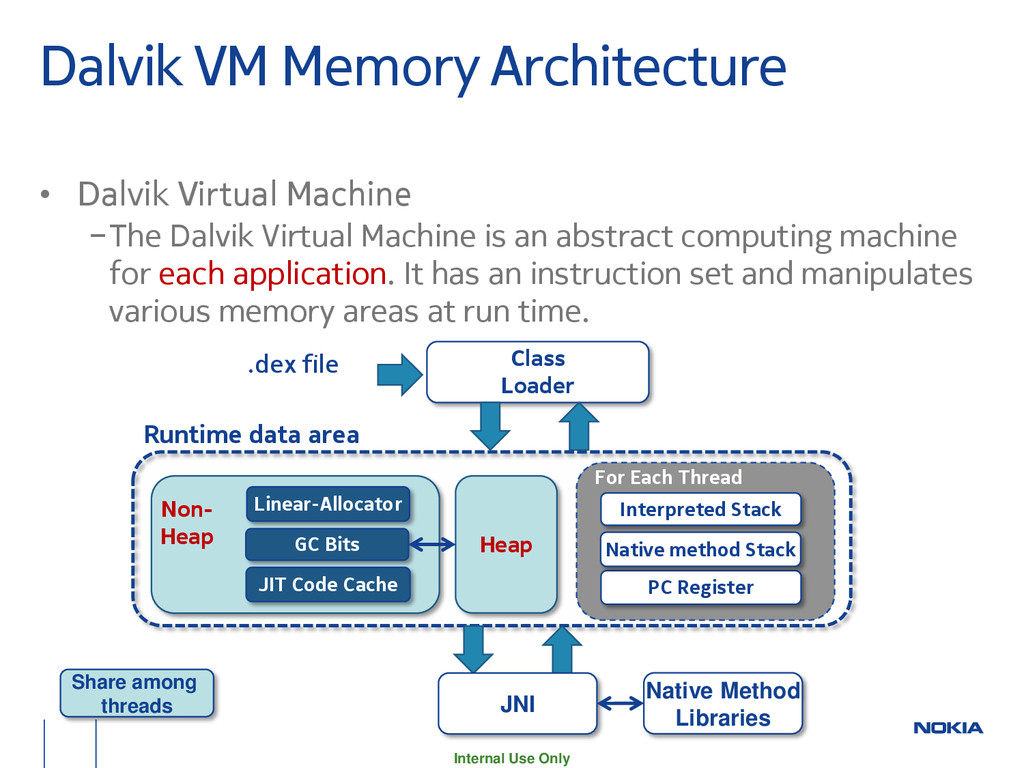
Machine −The Dalvik Virtual Machine is an abstract computing machine for each application. It has an instruction set and manipulates various memory areas at run time. Heap Interpreted Stack PC Register Non- Heap .dex file Class Loader JNI Native Method Libraries GC Bits Share among threads Linear-Allocator JIT Code Cache For Each Thread Native method Stack Runtime data area
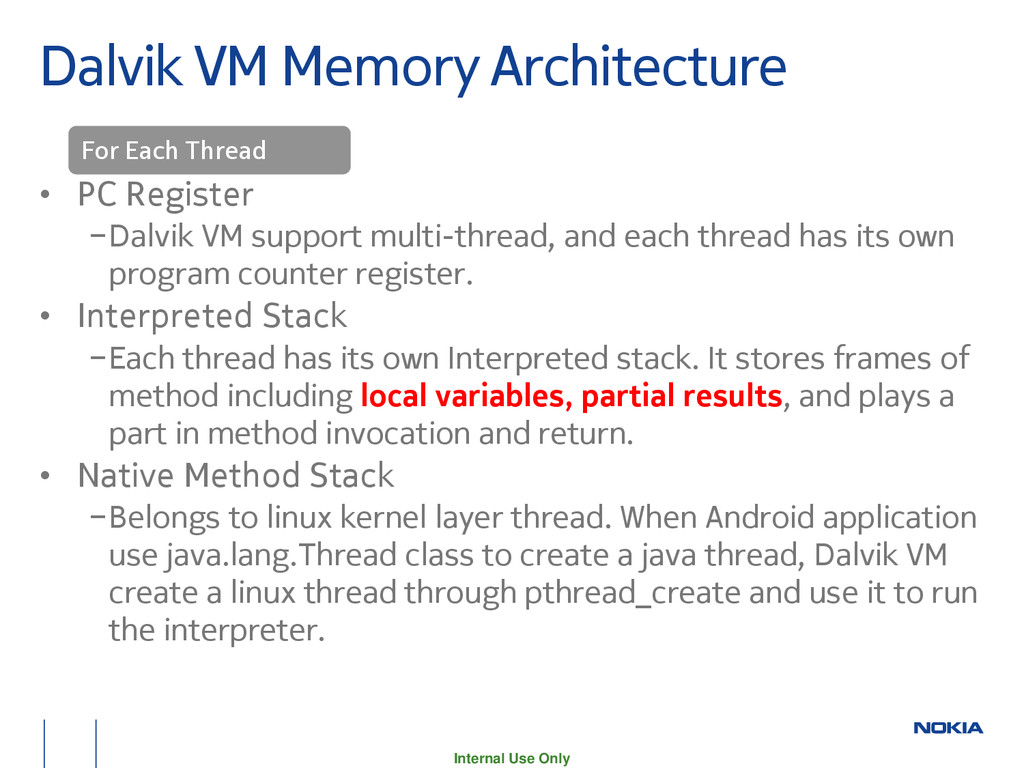
−Dalvik VM support multi-thread, and each thread has its own program counter register. • Interpreted Stack −Each thread has its own Interpreted stack. It stores frames of method including local variables, partial results, and plays a part in method invocation and return. • Native Method Stack −Belongs to linux kernel layer thread. When Android application use java.lang.Thread class to create a java thread, Dalvik VM create a linux thread through pthread_create and use it to run the interpreter. For Each Thread
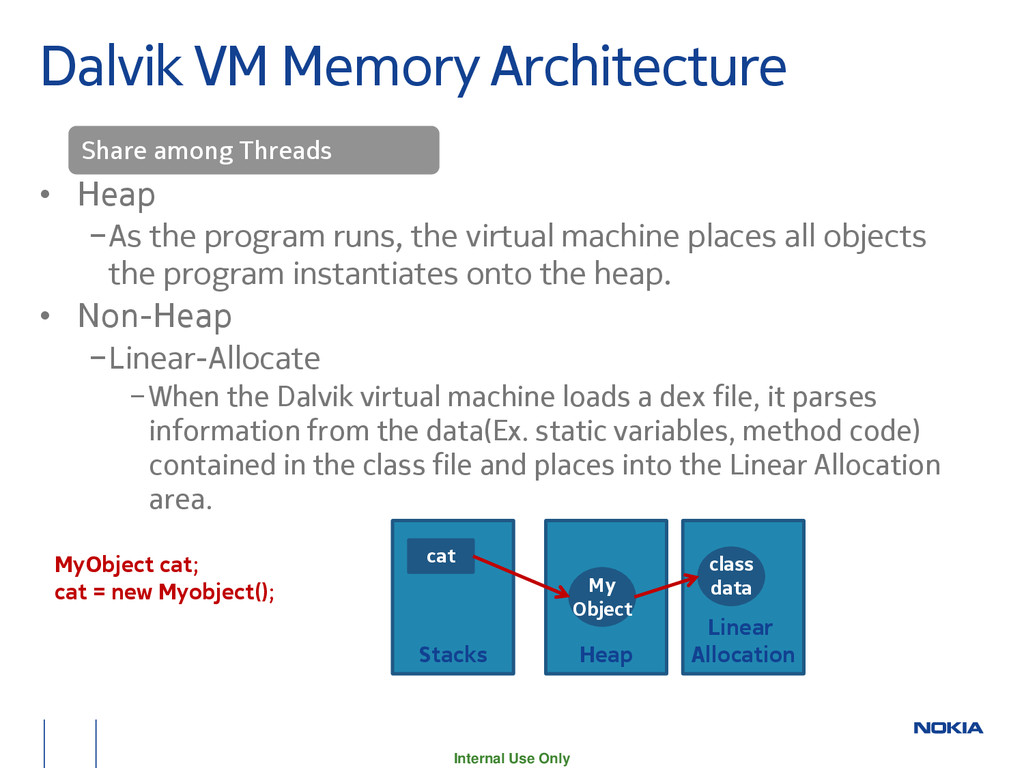
the program runs, the virtual machine places all objects the program instantiates onto the heap. • Non-Heap −Linear-Allocate −When the Dalvik virtual machine loads a dex file, it parses information from the data(Ex. static variables, method code) contained in the class file and places into the Linear Allocation area. Linear Allocation Heap class data My Object Stacks cat MyObject cat; cat = new Myobject(); Share among Threads
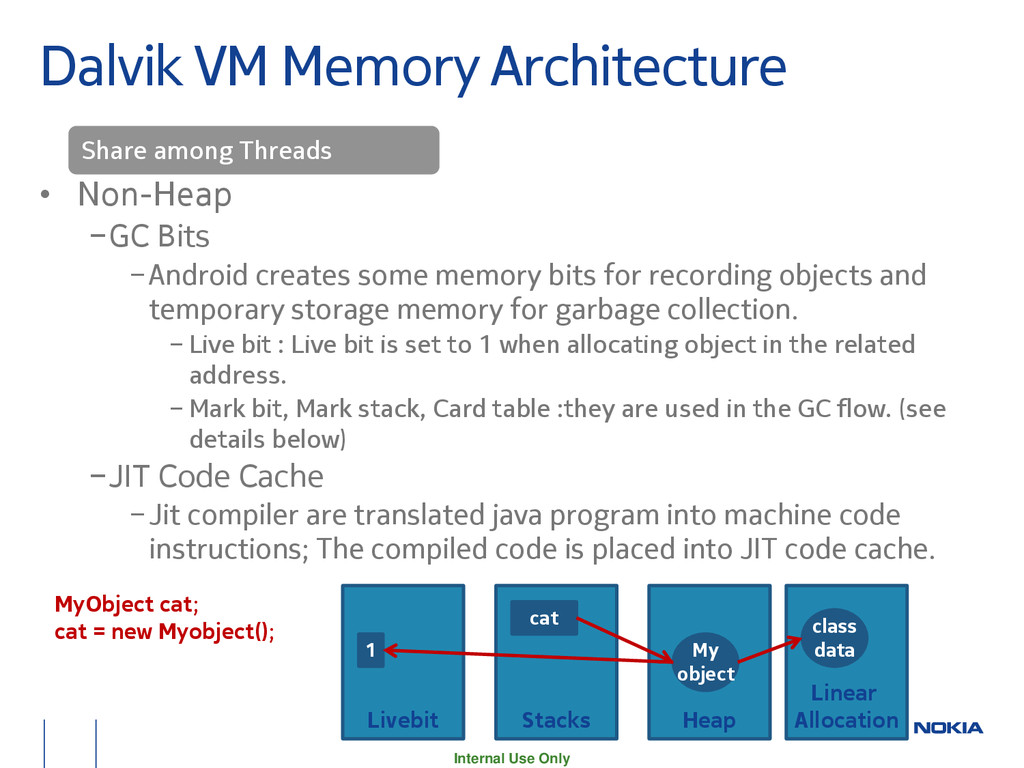
Bits −Android creates some memory bits for recording objects and temporary storage memory for garbage collection. − Live bit : Live bit is set to 1 when allocating object in the related address. − Mark bit, Mark stack, Card table :they are used in the GC flow. (see details below) −JIT Code Cache −Jit compiler are translated java program into machine code instructions; The compiled code is placed into JIT code cache. Linear Allocation Heap class data My object Stacks cat MyObject cat; cat = new Myobject(); Livebit 1 Share among Threads
−The basic principles of garbage collection are: −Find data objects in a program that cannot be accessed in the future. −Reclaim the resources from those objects. −Benefits : certain categories of bugs are reduced: −Dangling pointer bugs, which occur when a piece of memory is freed while there are still pointers to it. −Double free bugs, which occur when the program tries to free a region of memory that has already been freed, and perhaps already been allocated again. −Certain kinds of memory leaks, in which a program fails to free memory occupied by objects that have actually become unreachable, which leads to memory exhaustion.
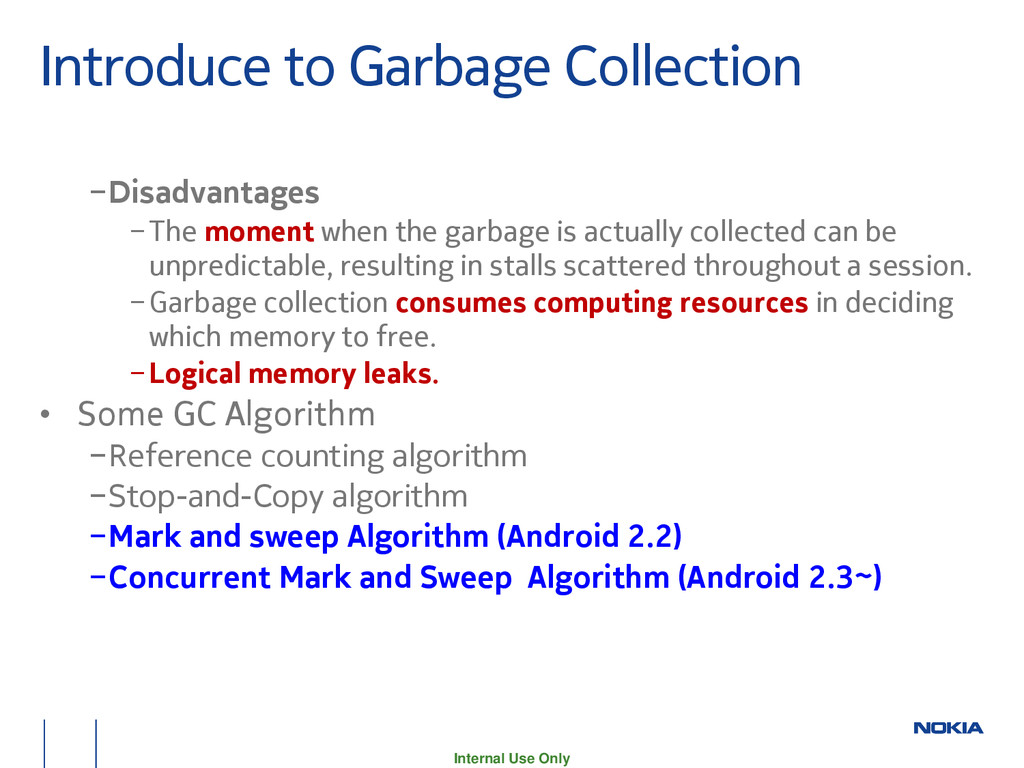
when the garbage is actually collected can be unpredictable, resulting in stalls scattered throughout a session. −Garbage collection consumes computing resources in deciding which memory to free. −Logical memory leaks. • Some GC Algorithm −Reference counting algorithm −Stop-and-Copy algorithm −Mark and sweep Algorithm (Android 2.2) −Concurrent Mark and Sweep Algorithm (Android 2.3~)
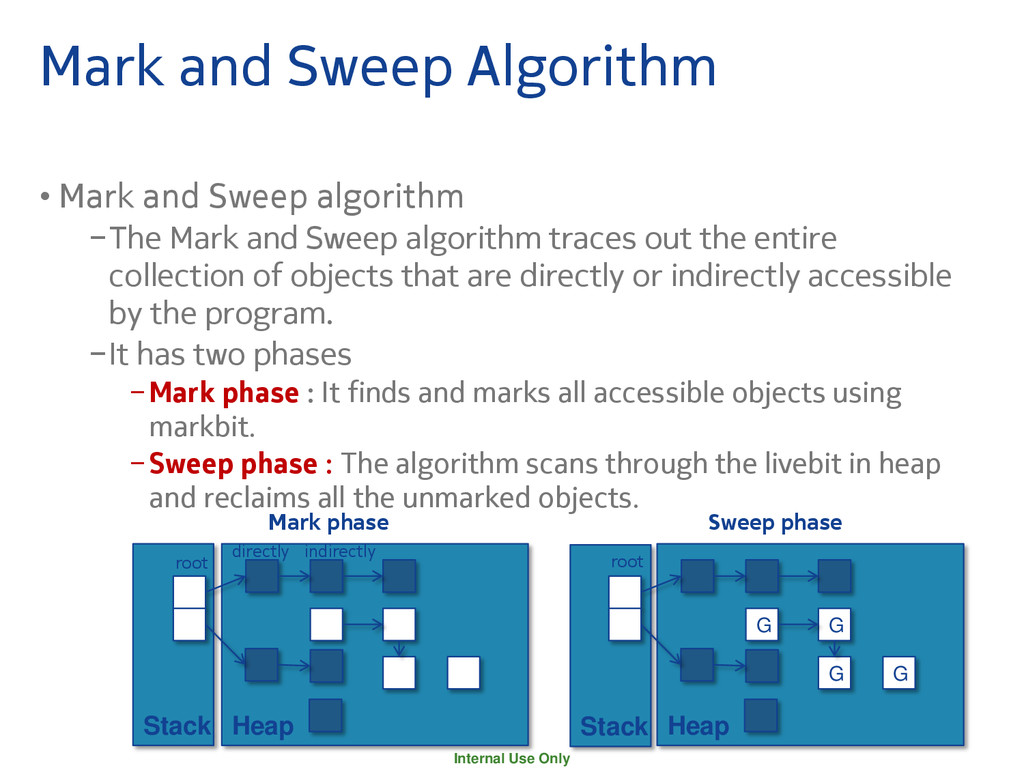
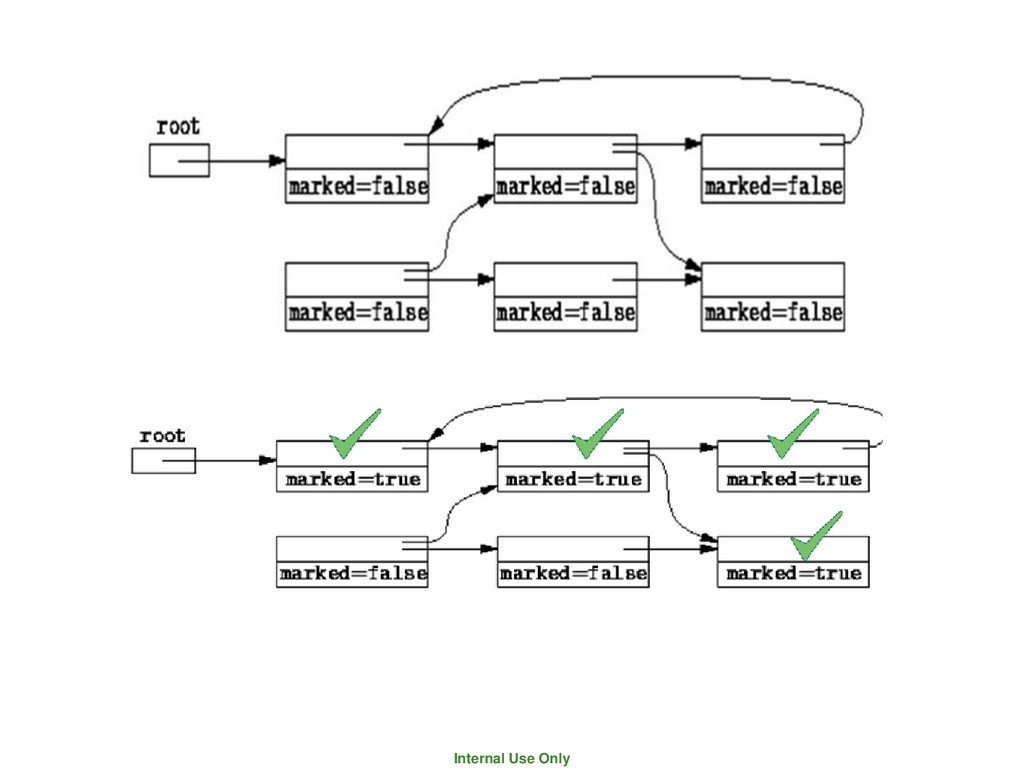
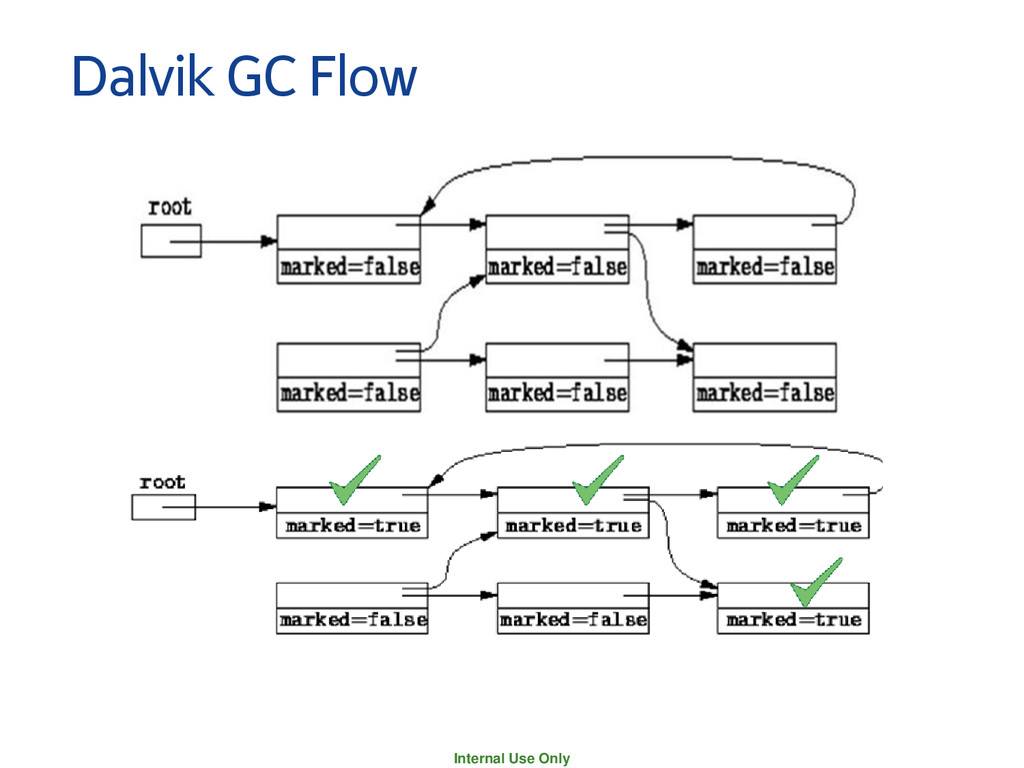
Sweep algorithm −The Mark and Sweep algorithm traces out the entire collection of objects that are directly or indirectly accessible by the program. −It has two phases −Mark phase : It finds and marks all accessible objects using markbit. −Sweep phase : The algorithm scans through the livebit in heap and reclaims all the unmarked objects. Stack Stack Heap Heap G G G G root root directly indirectly Mark phase Sweep phase
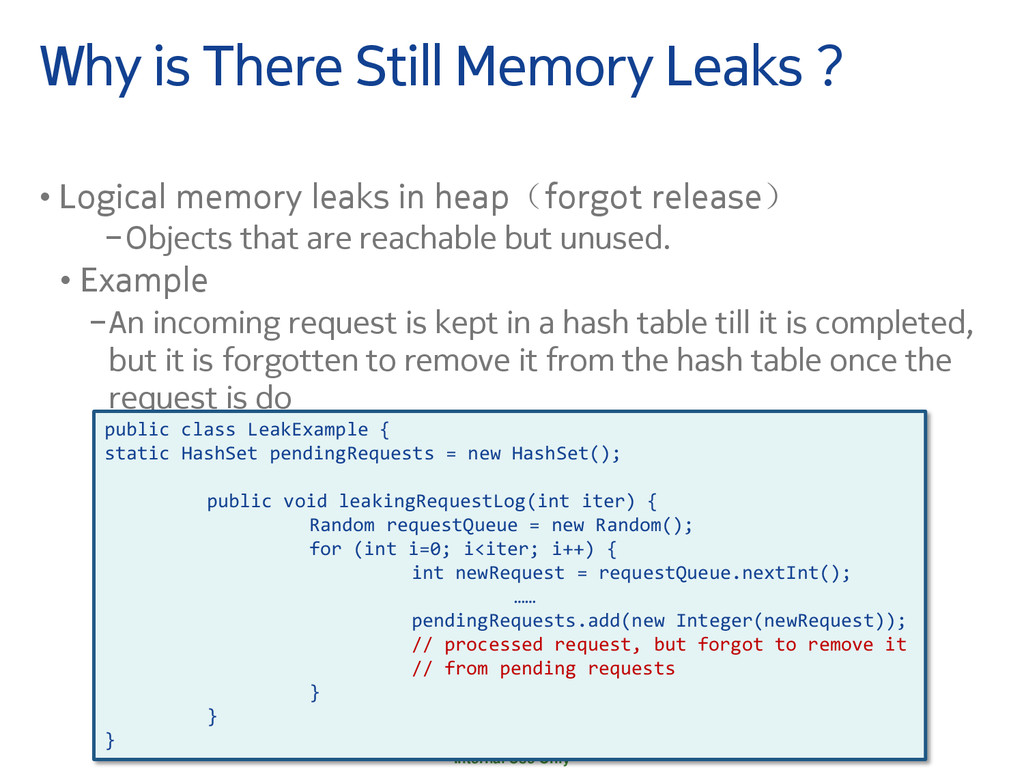
• Logical memory leaks in heap(forgot release) −Objects that are reachable but unused. • Example −An incoming request is kept in a hash table till it is completed, but it is forgotten to remove it from the hash table once the request is do public class LeakExample { static HashSet pendingRequests = new HashSet(); public void leakingRequestLog(int iter) { Random requestQueue = new Random(); for (int i=0; i<iter; i++) { int newRequest = requestQueue.nextInt(); …… pendingRequests.add(new Integer(newRequest)); // processed request, but forgot to remove it // from pending requests } } }
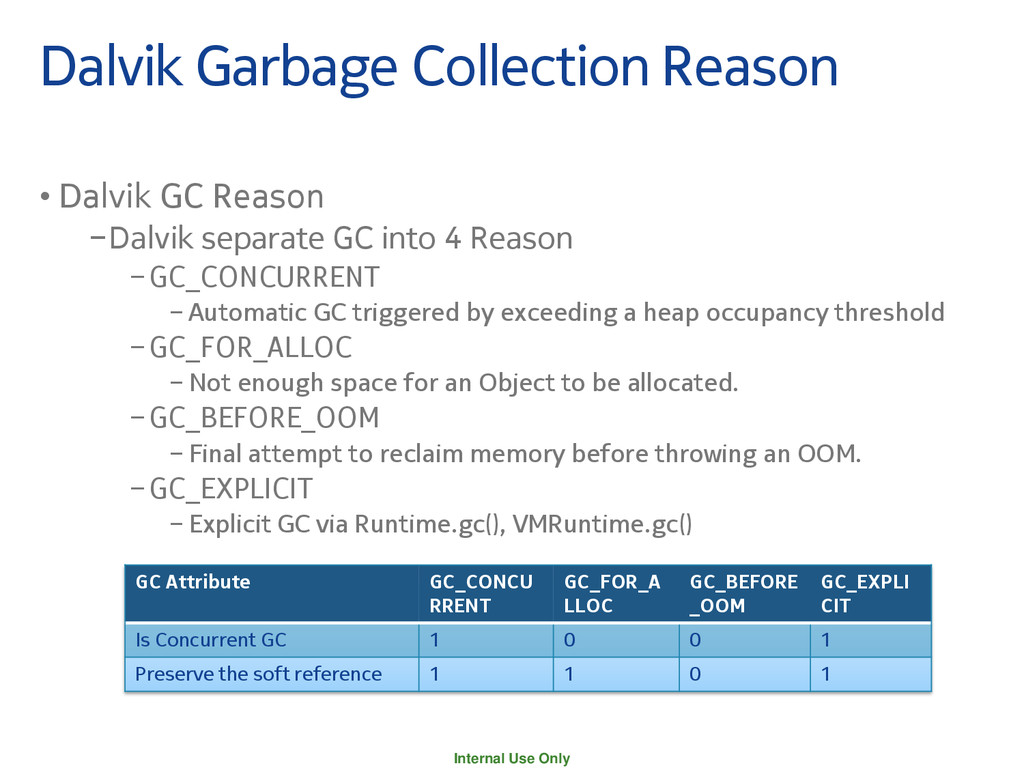
into 4 Reason −GC_CONCURRENT − Automatic GC triggered by exceeding a heap occupancy threshold −GC_FOR_ALLOC − Not enough space for an Object to be allocated. −GC_BEFORE_OOM − Final attempt to reclaim memory before throwing an OOM. −GC_EXPLICIT − Explicit GC via Runtime.gc(), VMRuntime.gc() GC Attribute GC_CONCU RRENT GC_FOR_A LLOC GC_BEFORE _OOM GC_EXPLI CIT Is Concurrent GC 1 0 0 1 Preserve the soft reference 1 1 0 1 Dalvik Garbage Collection Reason
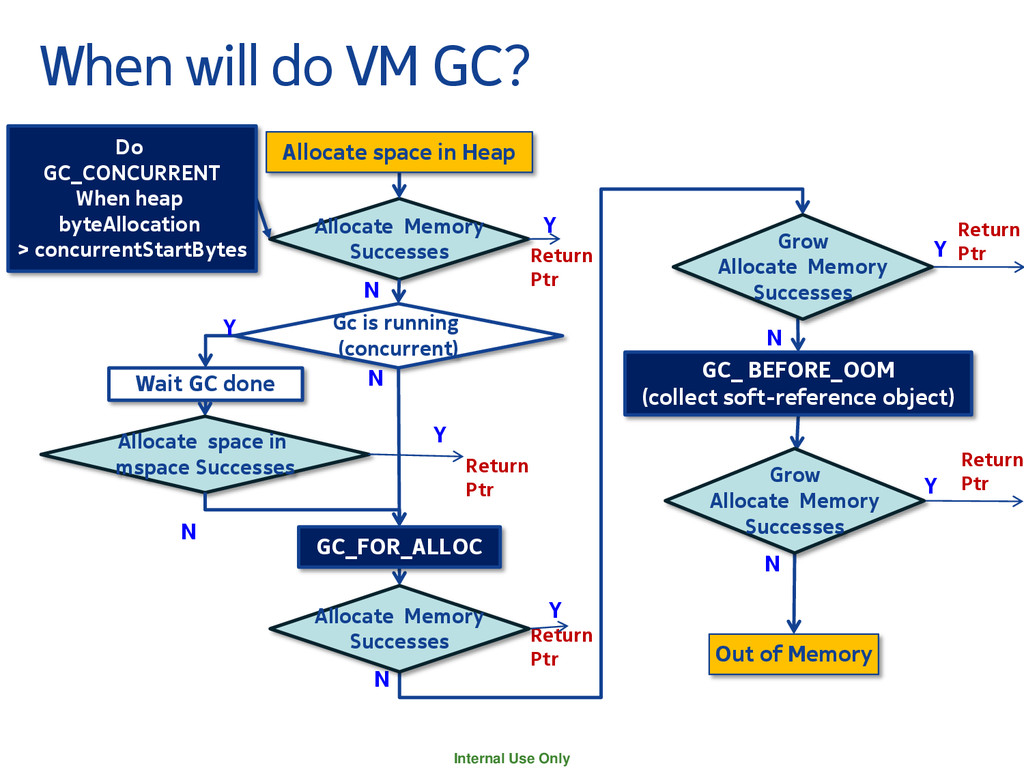
Allocate Memory Successes N Y Gc is running (concurrent) N N N Y N Out of Memory Wait GC done Y N GC_FOR_ALLOC GC_ BEFORE_OOM (collect soft-reference object) Allocate space in Heap Do GC_CONCURRENT When heap byteAllocation > concurrentStartBytes Return Ptr Return Ptr Y Return Ptr Y Y Allocate space in mspace Successes Allocate Memory Successes Grow Allocate Memory Successes Grow Allocate Memory Successes Return Ptr
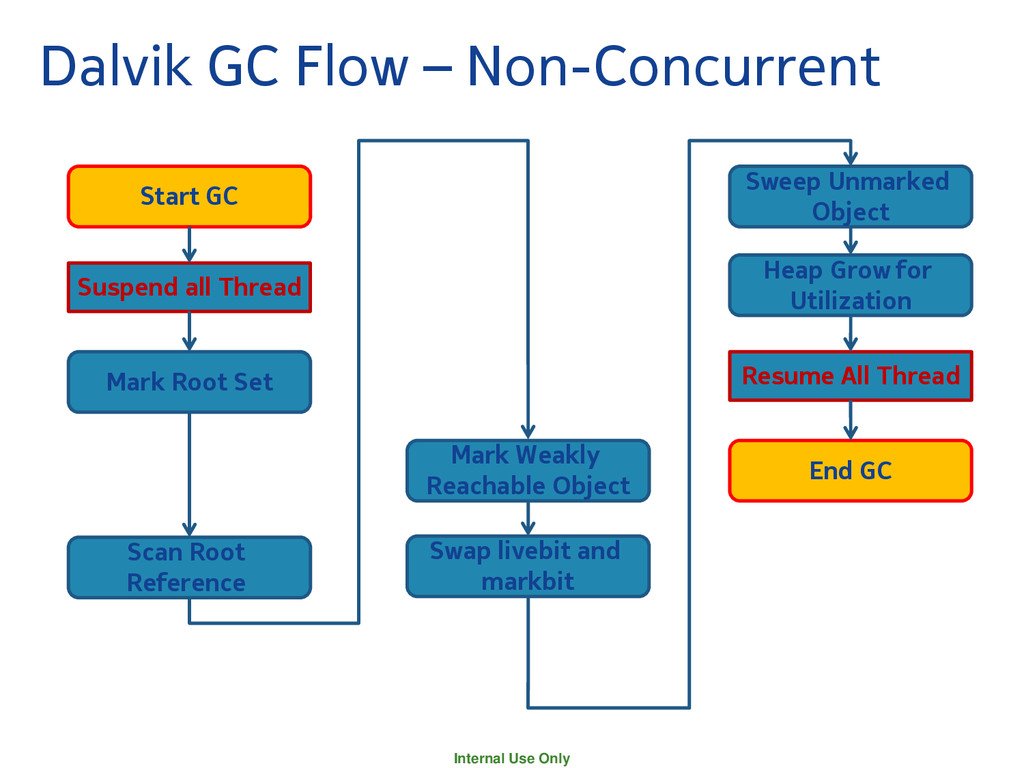
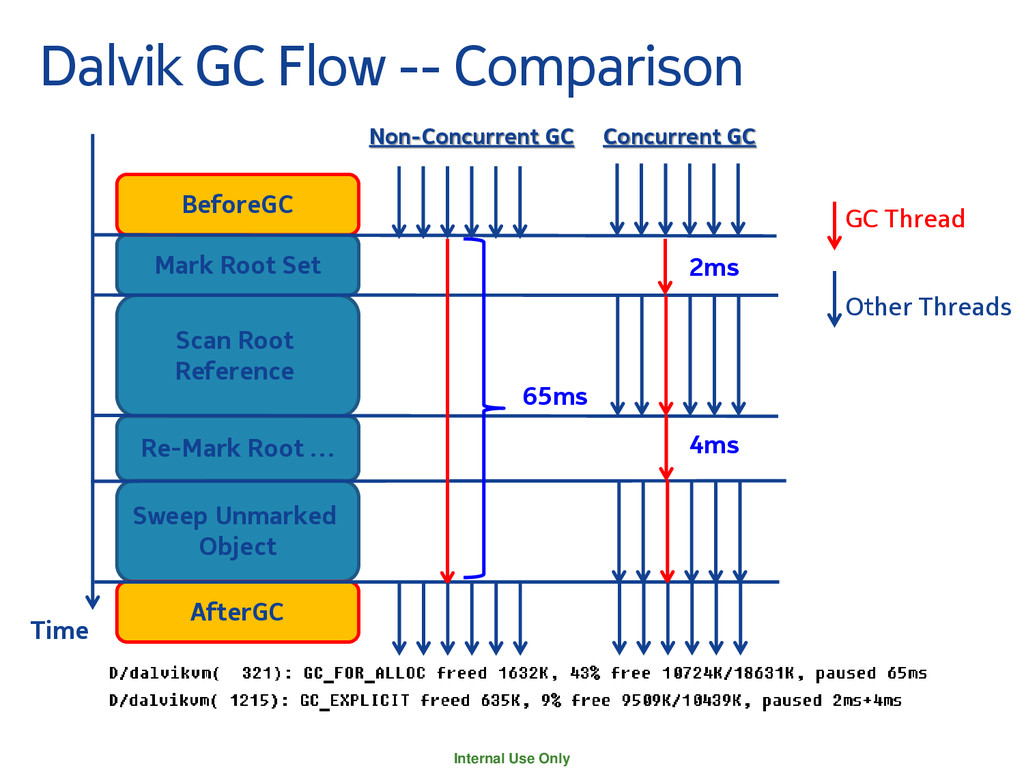
Sweep Unmarked Object Suspend all Thread Mark Root Set Scan Root Reference Mark Weakly Reachable Object Swap livebit and markbit Heap Grow for Utilization End GC Resume All Thread
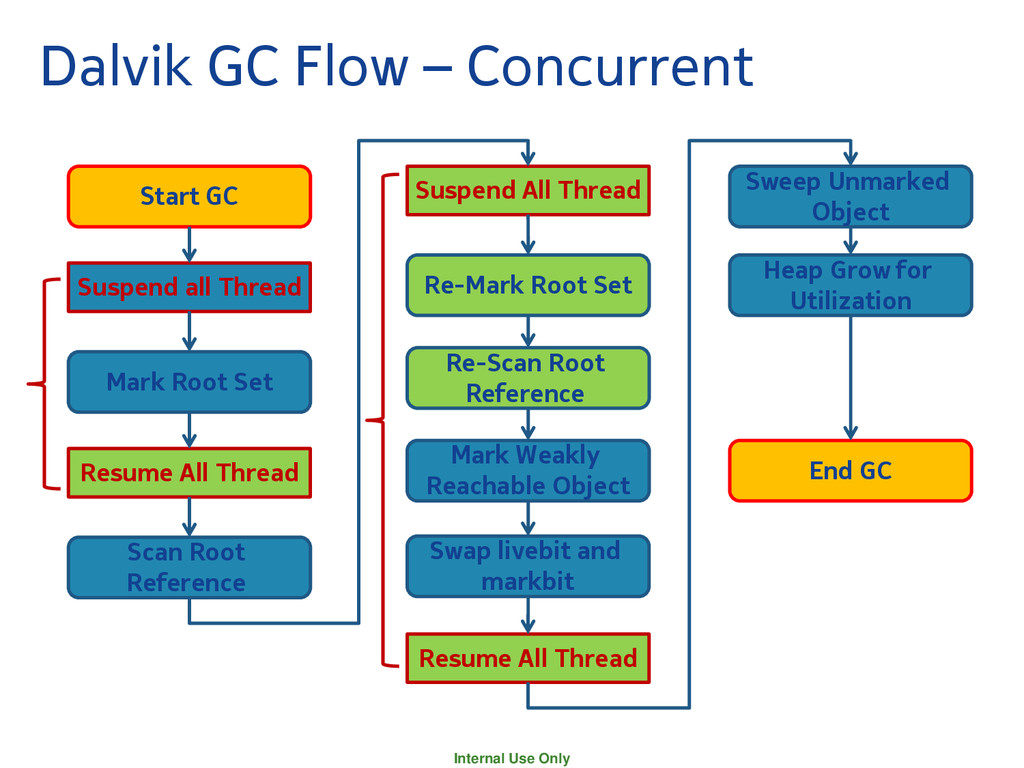
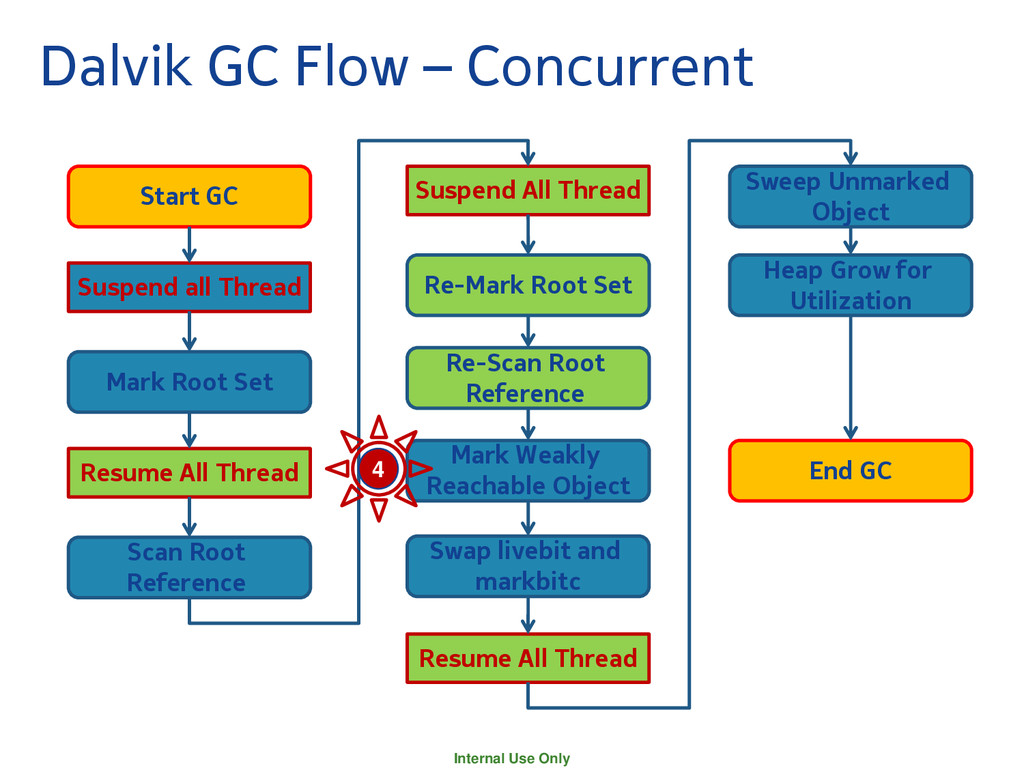
Sweep Unmarked Object Suspend all Thread Mark Root Set Resume All Thread Scan Root Reference Resume All Thread Re-Mark Root Set Suspend All Thread Re-Scan Root Reference Mark Weakly Reachable Object Swap livebit and markbit Heap Grow for Utilization End GC
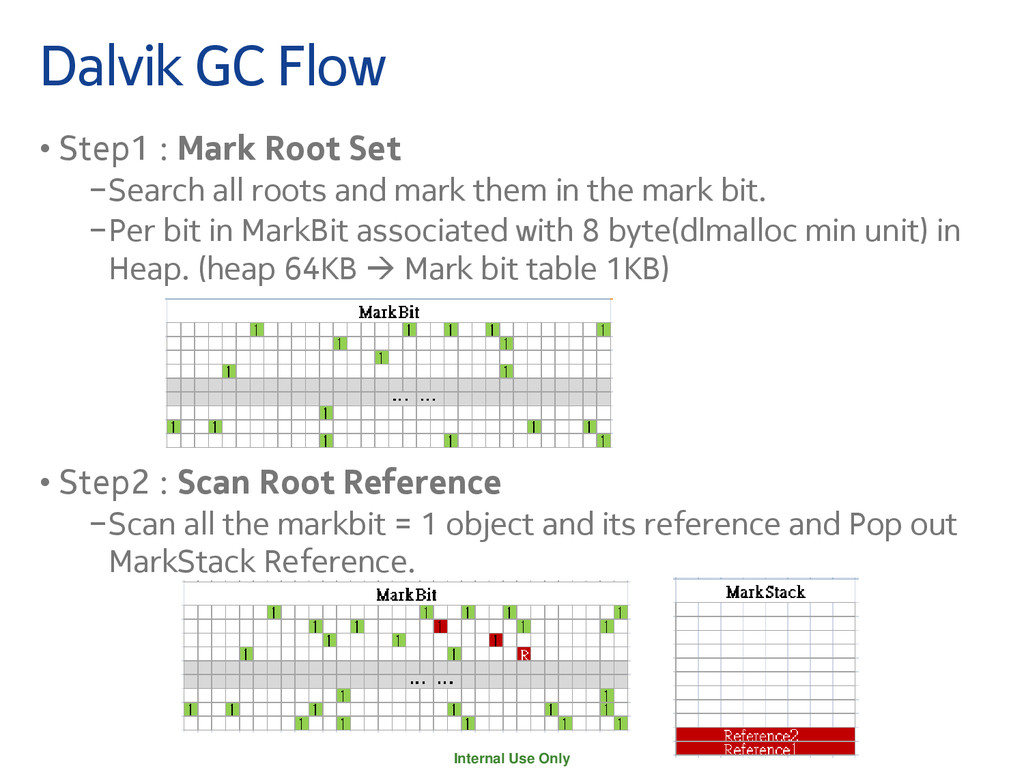
Root Set −Search all roots and mark them in the mark bit. −Per bit in MarkBit associated with 8 byte(dlmalloc min unit) in Heap. (heap 64KB Mark bit table 1KB) • Step2 : Scan Root Reference −Scan all the markbit = 1 object and its reference and Pop out MarkStack Reference.
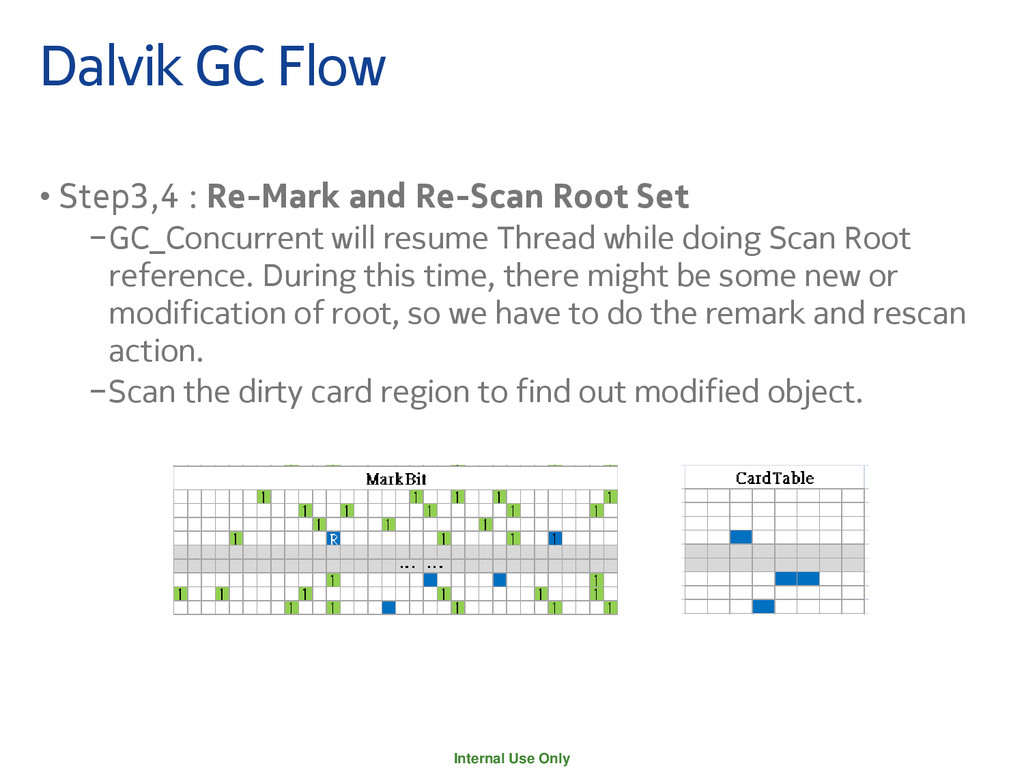
and Re-Scan Root Set −GC_Concurrent will resume Thread while doing Scan Root reference. During this time, there might be some new or modification of root, so we have to do the remark and rescan action. −Scan the dirty card region to find out modified object.
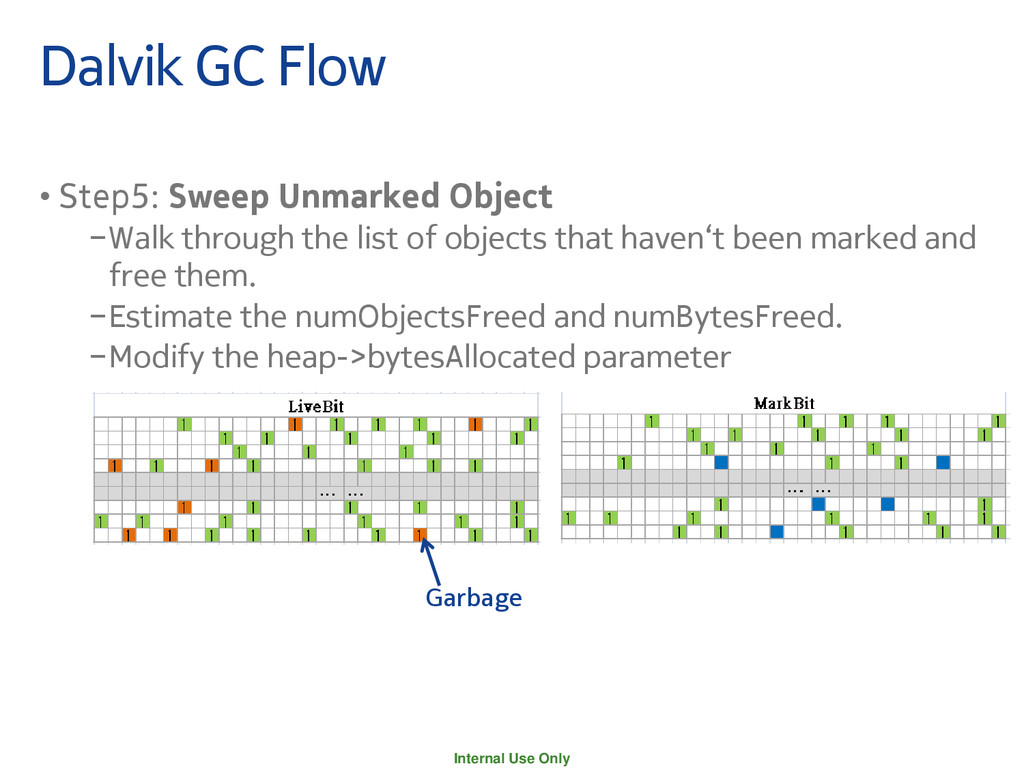
Object −Walk through the list of objects that haven‘t been marked and free them. −Estimate the numObjectsFreed and numBytesFreed. −Modify the heap->bytesAllocated parameter Garbage
Sweep Unmarked Object Suspend all Thread Mark Root Set Resume All Thread Scan Root Reference Resume All Thread Re-Mark Root Set Suspend All Thread Re-Scan Root Reference Mark Weakly Reachable Object Swap livebit and markbitc Heap Grow for Utilization End GC 4
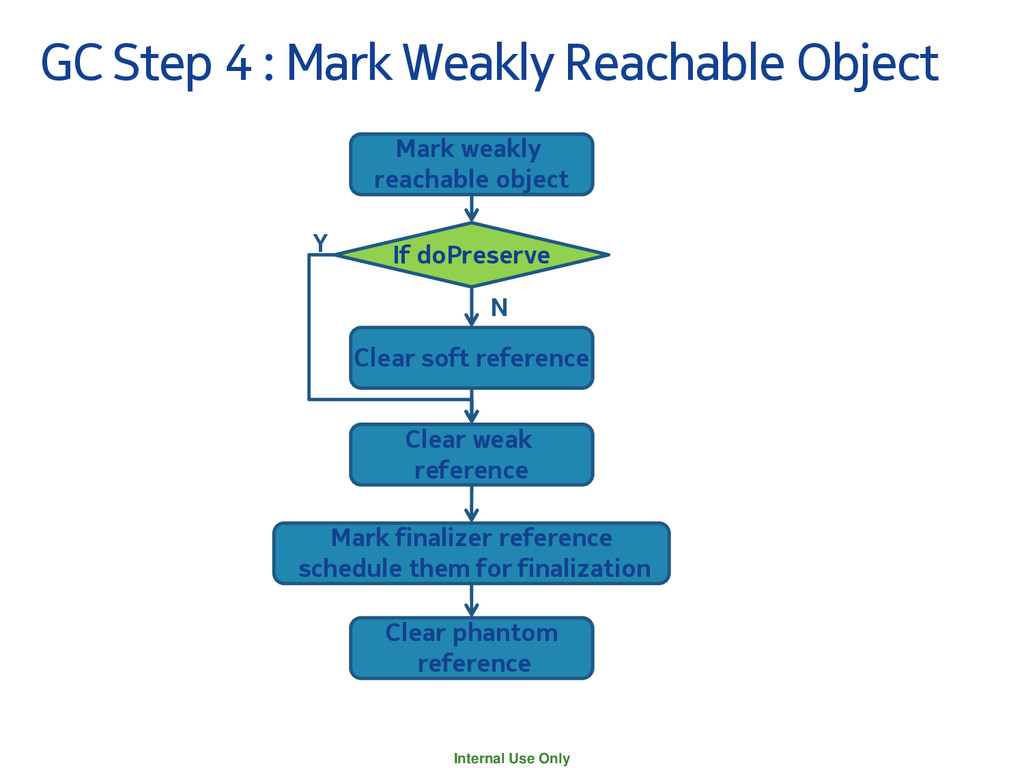
Object Mark weakly reachable object If doPreserve Clear soft reference Clear weak reference Mark finalizer reference schedule them for finalization Clear phantom reference Y N
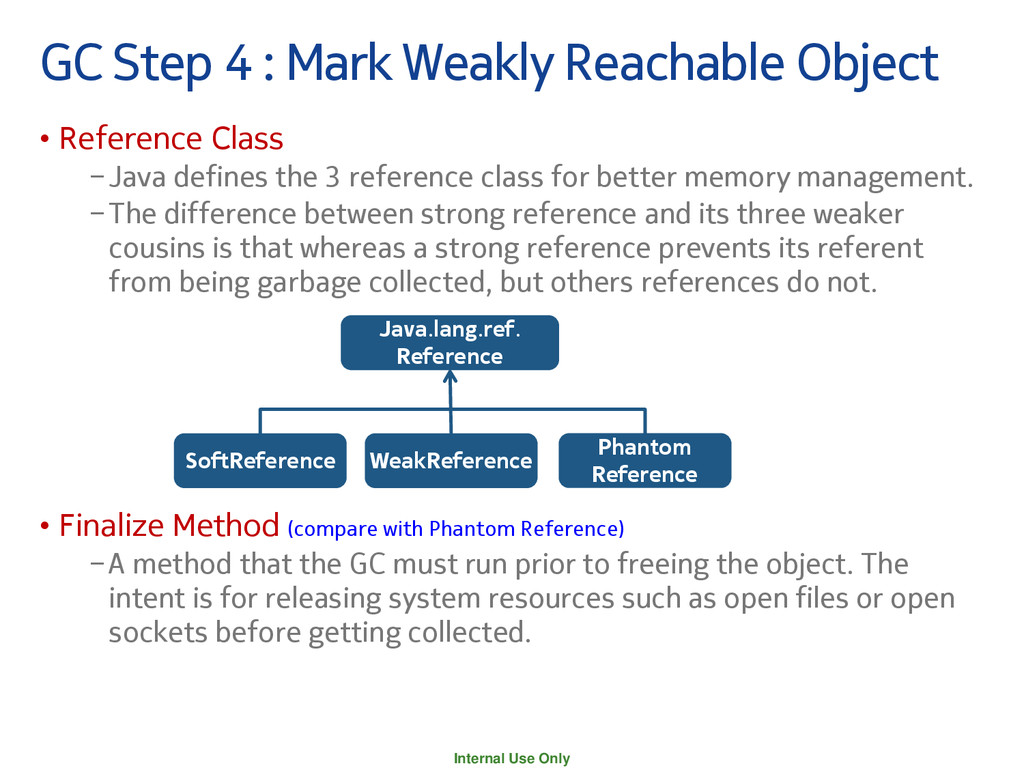
Object • Reference Class −Java defines the 3 reference class for better memory management. −The difference between strong reference and its three weaker cousins is that whereas a strong reference prevents its referent from being garbage collected, but others references do not. • Finalize Method (compare with Phantom Reference) −A method that the GC must run prior to freeing the object. The intent is for releasing system resources such as open files or open sockets before getting collected. Java.lang.ref. Reference SoftReference WeakReference Phantom Reference
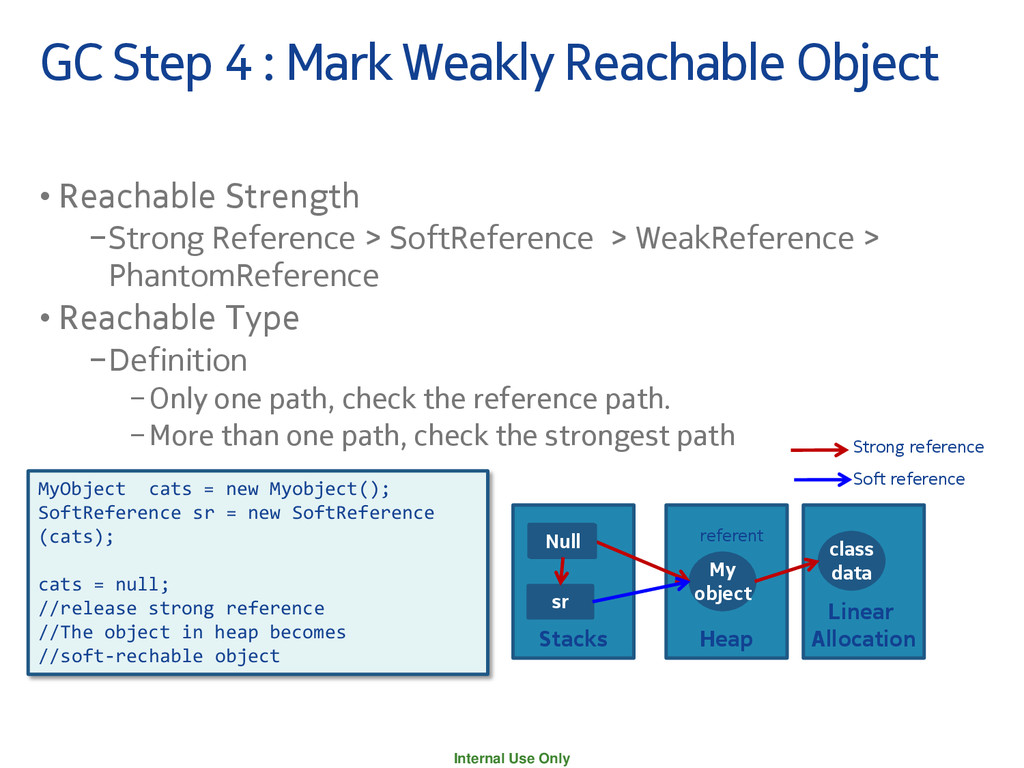
Object • Reachable Strength −Strong Reference > SoftReference > WeakReference > PhantomReference • Reachable Type −Definition −Only one path, check the reference path. −More than one path, check the strongest path Linear Allocation Heap class data My object Stacks cats Strong reference sr Soft reference referent MyObject cats = new Myobject(); SoftReference sr = new SoftReference (cats); cats = null; //release strong reference //The object in heap becomes //soft-rechable object Null
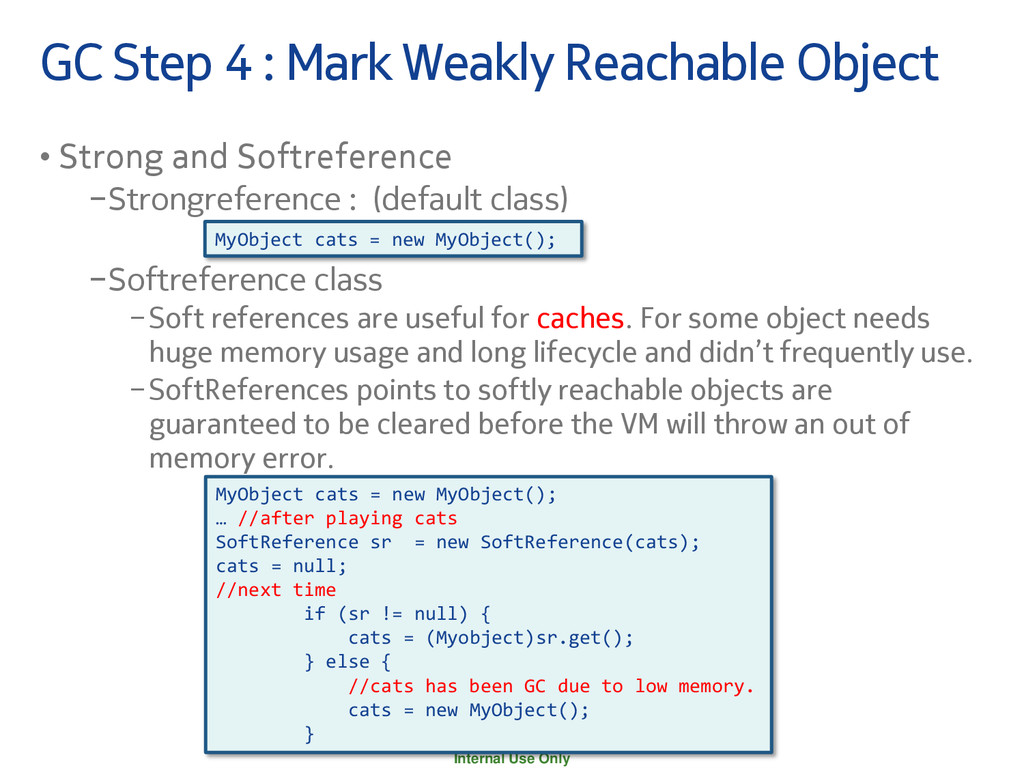
Object • Strong and Softreference −Strongreference : (default class) −Softreference class −Soft references are useful for caches. For some object needs huge memory usage and long lifecycle and didn’t frequently use. −SoftReferences points to softly reachable objects are guaranteed to be cleared before the VM will throw an out of memory error. MyObject cats = new MyObject(); MyObject cats = new MyObject(); … //after playing cats SoftReference sr = new SoftReference(cats); cats = null; //next time if (sr != null) { cats = (Myobject)sr.get(); } else { //cats has been GC due to low memory. cats = new MyObject(); }
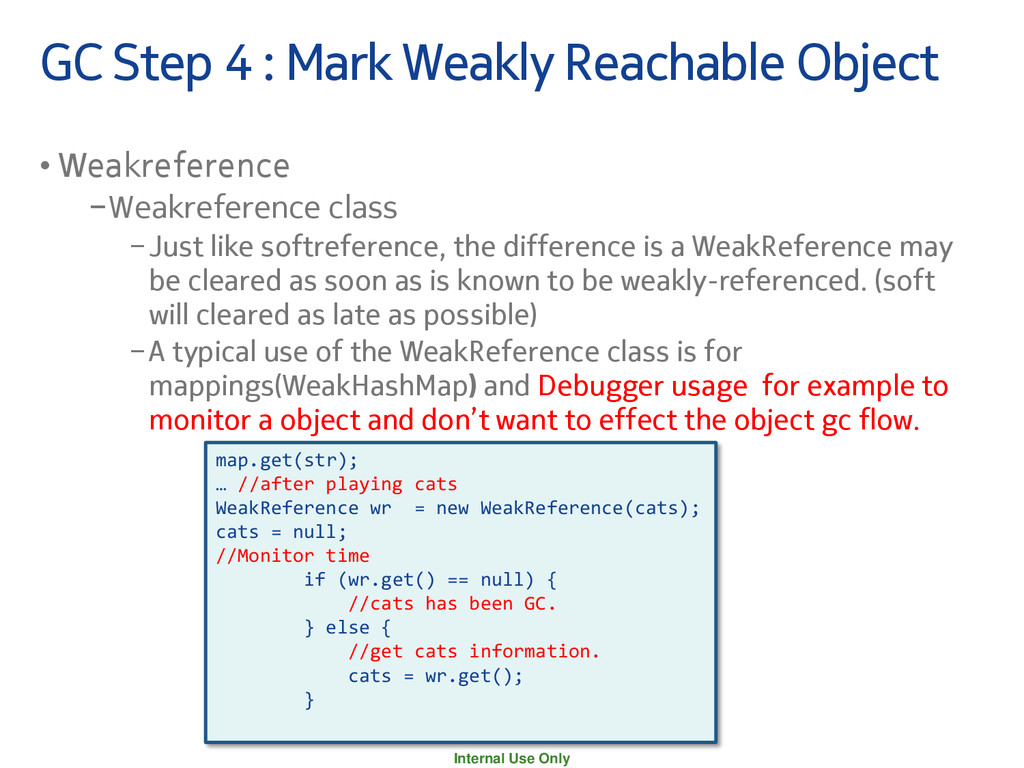
Object • Weakreference −Weakreference class −Just like softreference, the difference is a WeakReference may be cleared as soon as is known to be weakly-referenced. (soft will cleared as late as possible) −A typical use of the WeakReference class is for mappings(WeakHashMap) and Debugger usage for example to monitor a object and don’t want to effect the object gc flow. map.get(str); … //after playing cats WeakReference wr = new WeakReference(cats); cats = null; //Monitor time if (wr.get() == null) { //cats has been GC. } else { //get cats information. cats = wr.get(); }
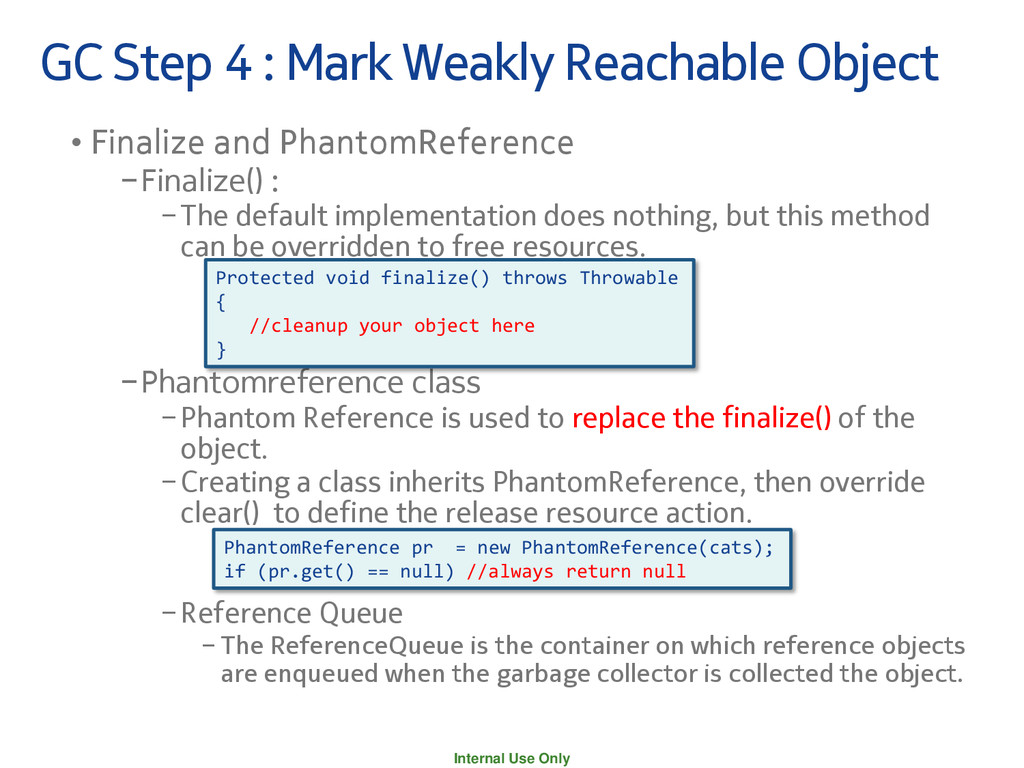
Object • Finalize and PhantomReference −Finalize() : −The default implementation does nothing, but this method can be overridden to free resources. −Phantomreference class −Phantom Reference is used to replace the finalize() of the object. −Creating a class inherits PhantomReference, then override clear() to define the release resource action. −Reference Queue − The ReferenceQueue is the container on which reference objects are enqueued when the garbage collector is collected the object. PhantomReference pr = new PhantomReference(cats); if (pr.get() == null) //always return null Protected void finalize() throws Throwable { //cleanup your object here }
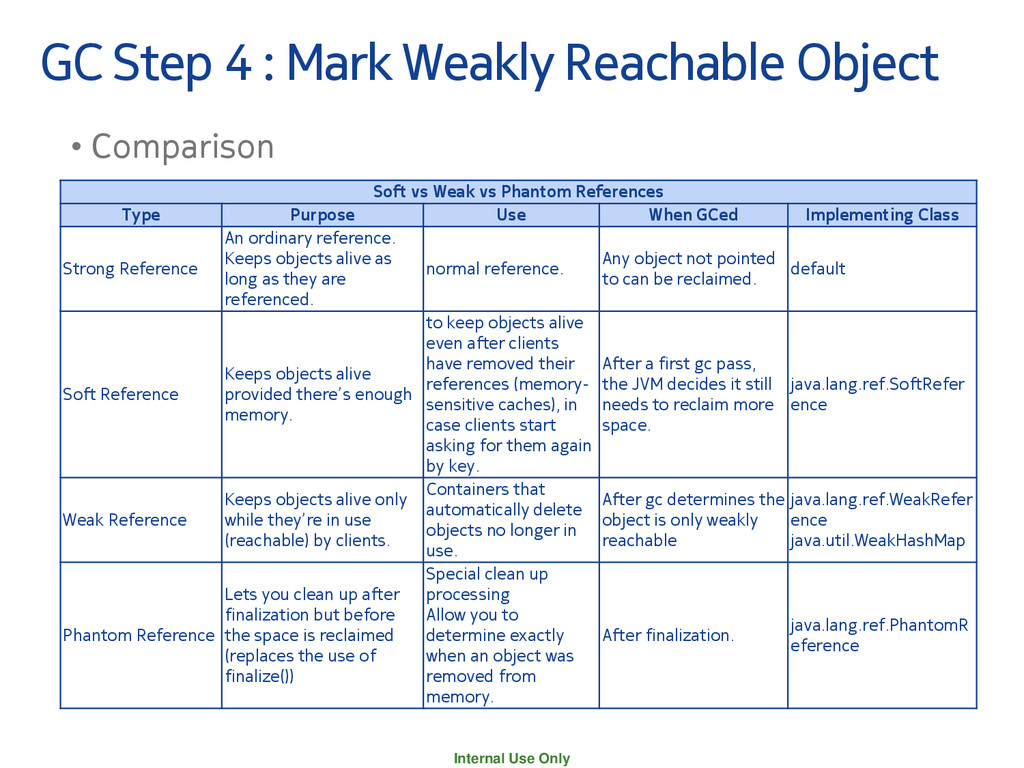
Object • Comparison Soft vs Weak vs Phantom References Type Purpose Use When GCed Implementing Class Strong Reference An ordinary reference. Keeps objects alive as long as they are referenced. normal reference. Any object not pointed to can be reclaimed. default Soft Reference Keeps objects alive provided there’s enough memory. to keep objects alive even after clients have removed their references (memory- sensitive caches), in case clients start asking for them again by key. After a first gc pass, the JVM decides it still needs to reclaim more space. java.lang.ref.SoftRefer ence Weak Reference Keeps objects alive only while they’re in use (reachable) by clients. Containers that automatically delete objects no longer in use. After gc determines the object is only weakly reachable java.lang.ref.WeakRefer ence java.util.WeakHashMap Phantom Reference Lets you clean up after finalization but before the space is reclaimed (replaces the use of finalize()) Special clean up processing Allow you to determine exactly when an object was removed from memory. After finalization. java.lang.ref.PhantomR eference
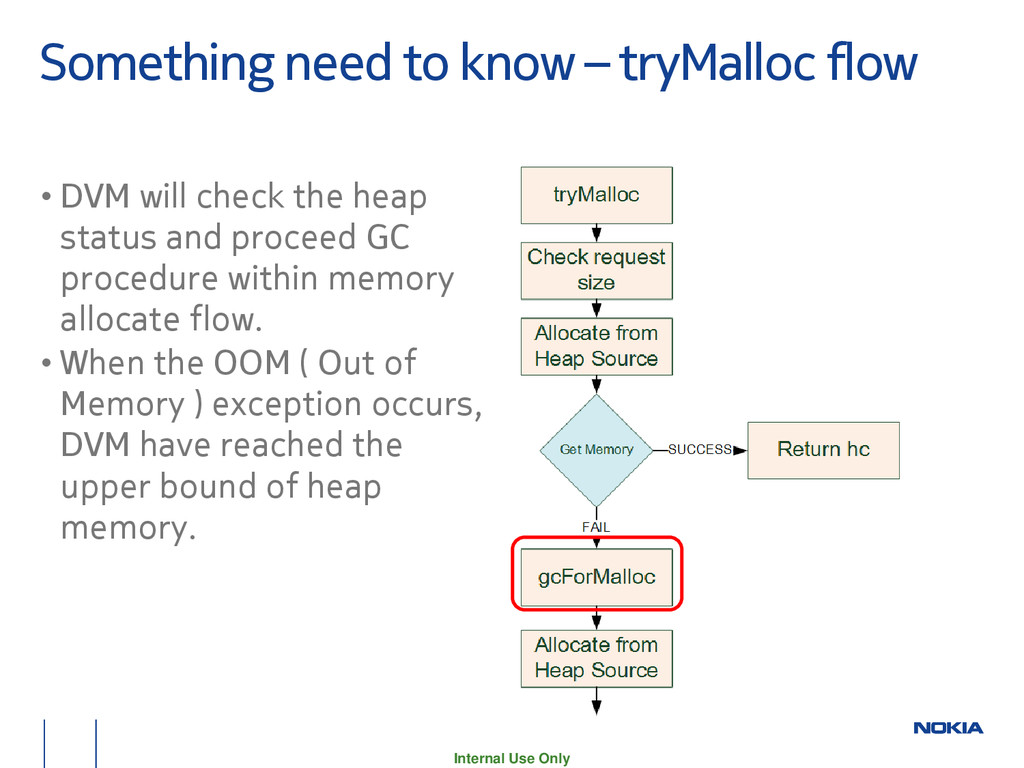
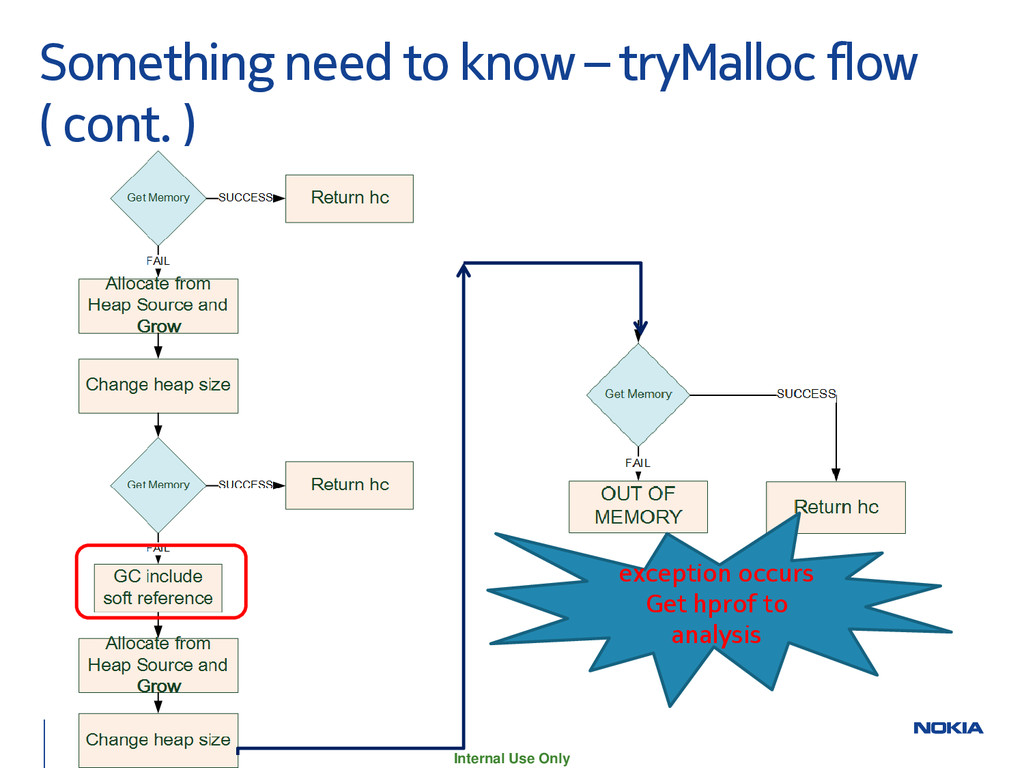
• DVM will check the heap status and proceed GC procedure within memory allocate flow. • When the OOM ( Out of Memory ) exception occurs, DVM have reached the upper bound of heap memory.
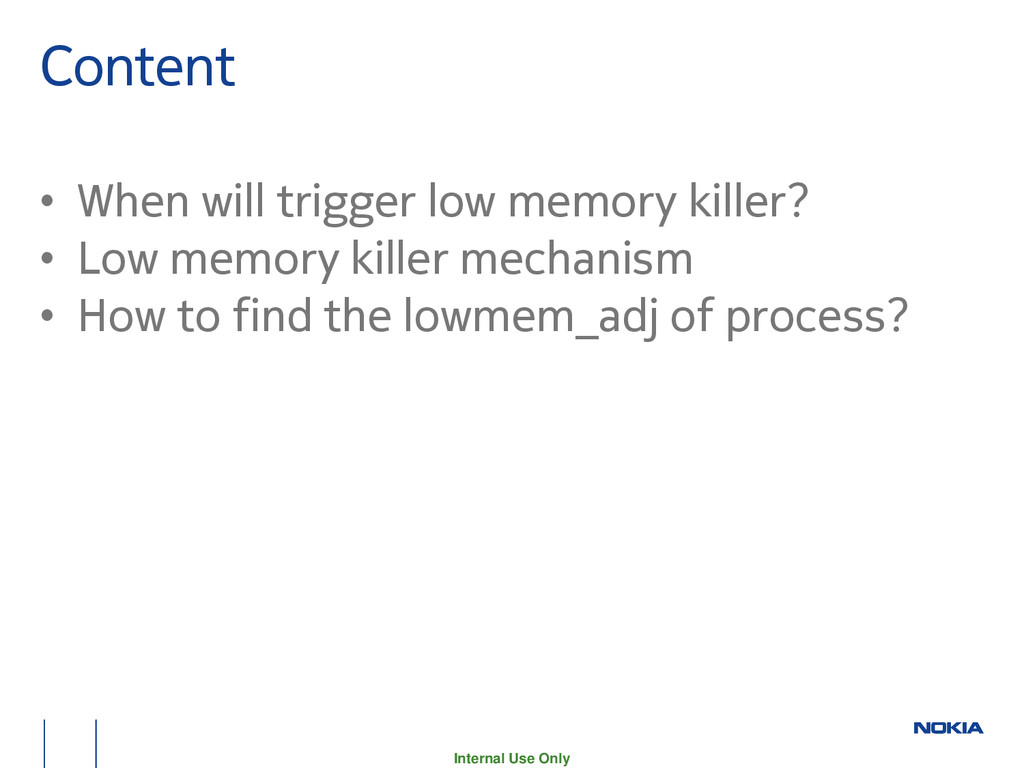
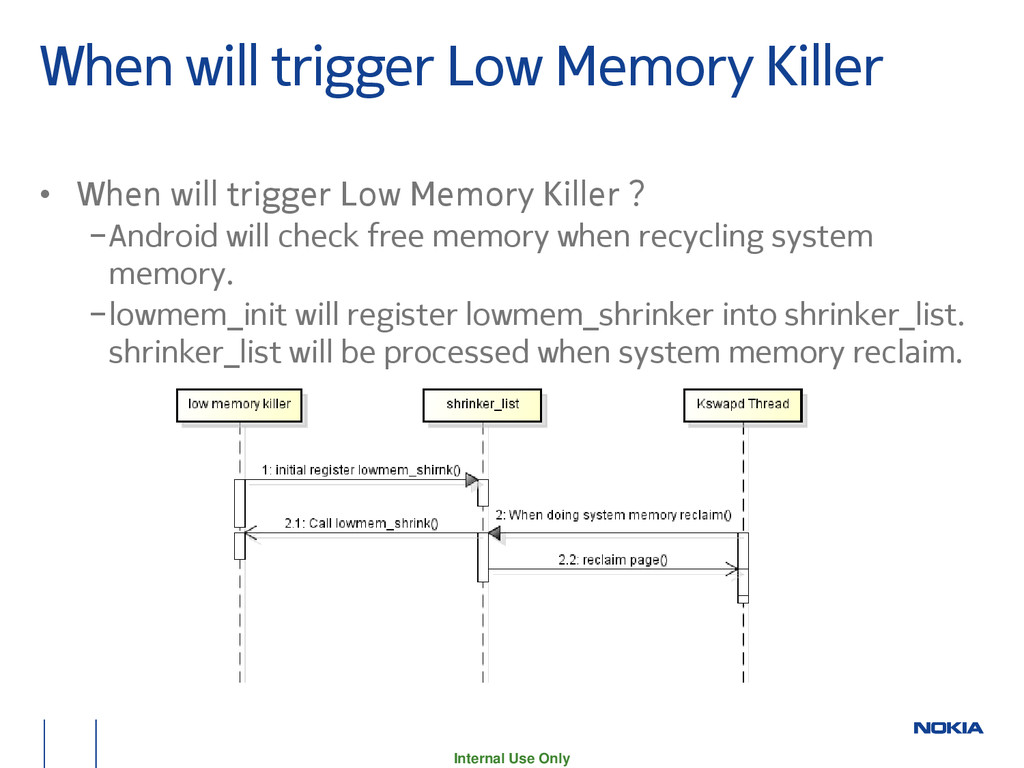
When will trigger Low Memory Killer ? −Android will check free memory when recycling system memory. −lowmem_init will register lowmem_shrinker into shrinker_list. shrinker_list will be processed when system memory reclaim.
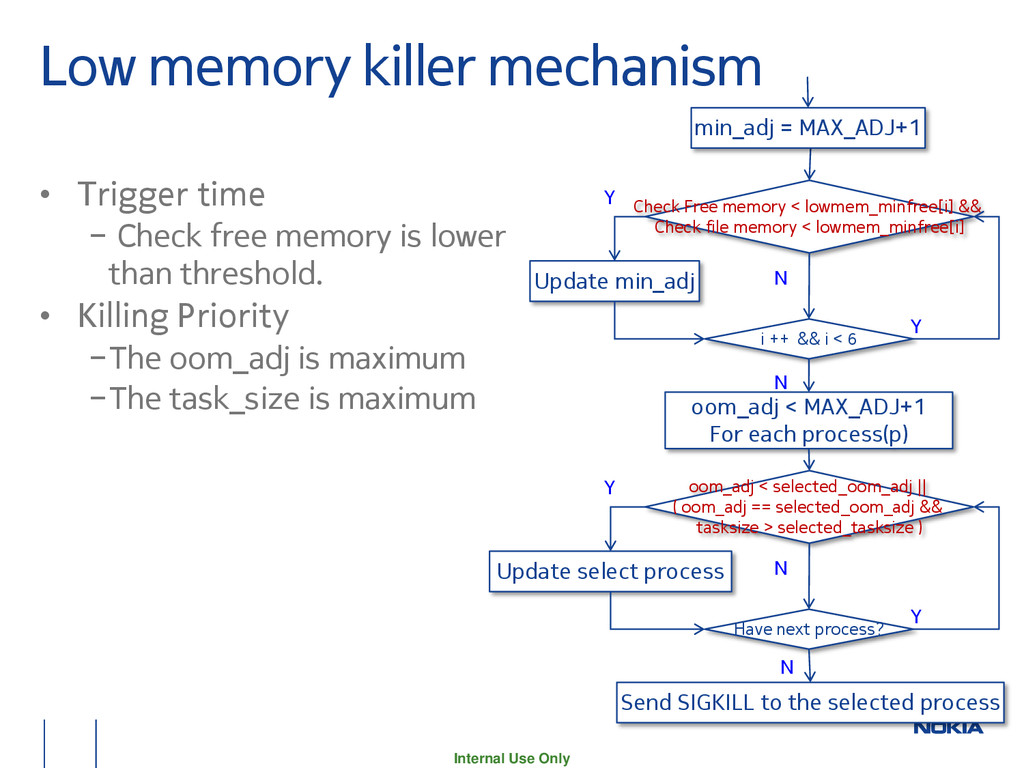
− Check free memory is lower than threshold. • Killing Priority −The oom_adj is maximum −The task_size is maximum Check Free memory < lowmem_minfree[i] && Check file memory < lowmem_minfree[i] N Y Update min_adj min_adj = MAX_ADJ+1 i ++ && i < 6 Y N oom_adj < MAX_ADJ+1 For each process(p) oom_adj < selected_oom_adj || ( oom_adj == selected_oom_adj && tasksize > selected_tasksize ) N Y Update select process Have next process? Y N Send SIGKILL to the selected process
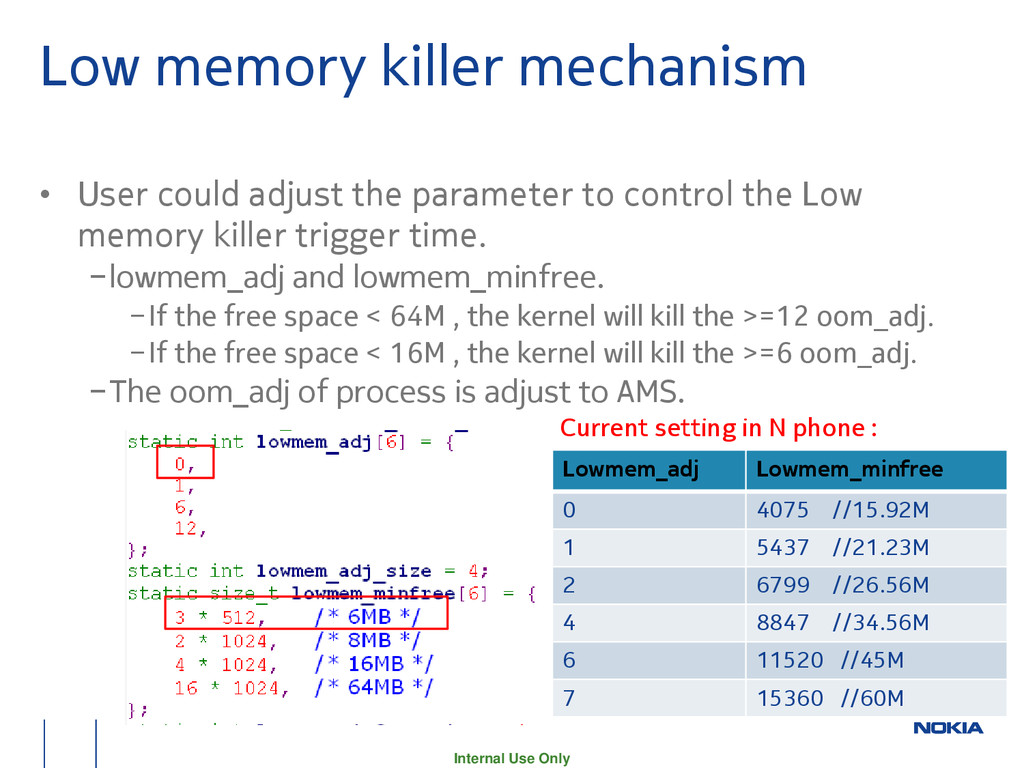
adjust the parameter to control the Low memory killer trigger time. −lowmem_adj and lowmem_minfree. −If the free space < 64M , the kernel will kill the >=12 oom_adj. −If the free space < 16M , the kernel will kill the >=6 oom_adj. −The oom_adj of process is adjust to AMS. Current setting in N phone : Lowmem_adj Lowmem_minfree 0 4075 //15.92M 1 5437 //21.23M 2 6799 //26.56M 4 8847 //34.56M 6 11520 //45M 7 15360 //60M
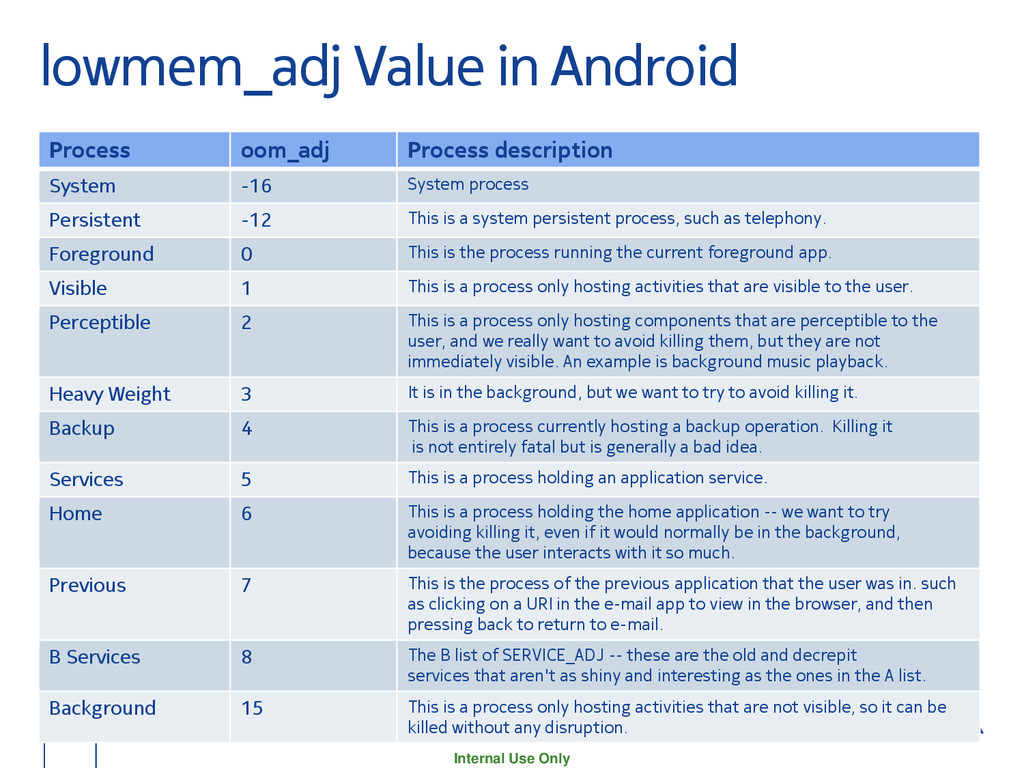
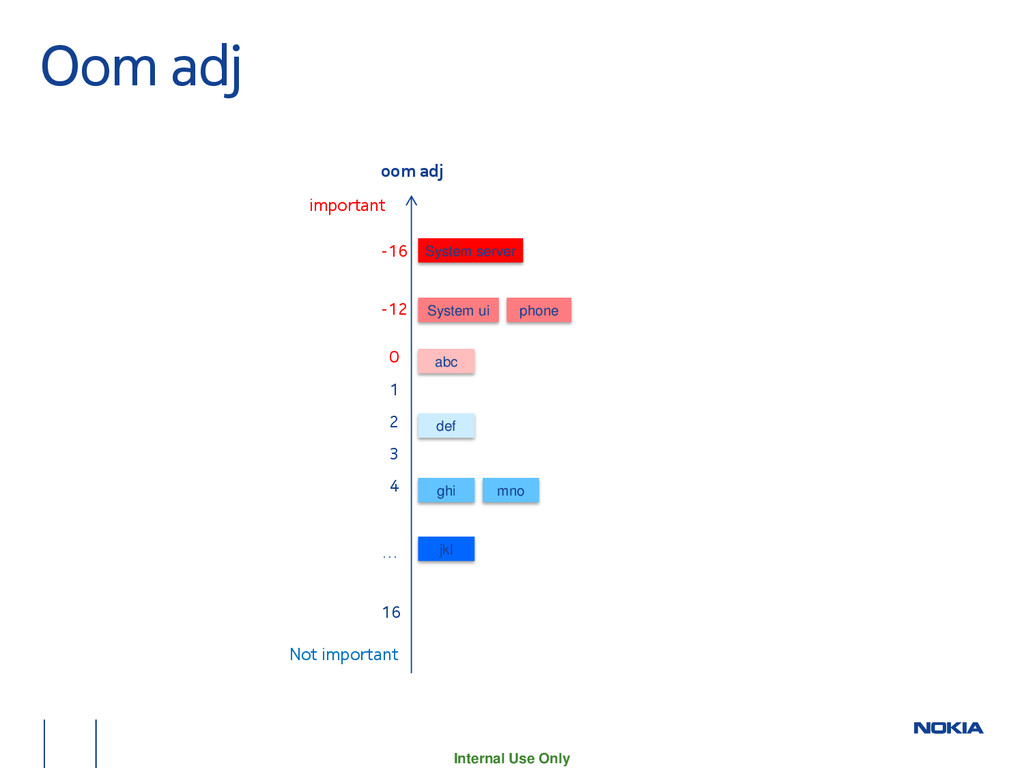
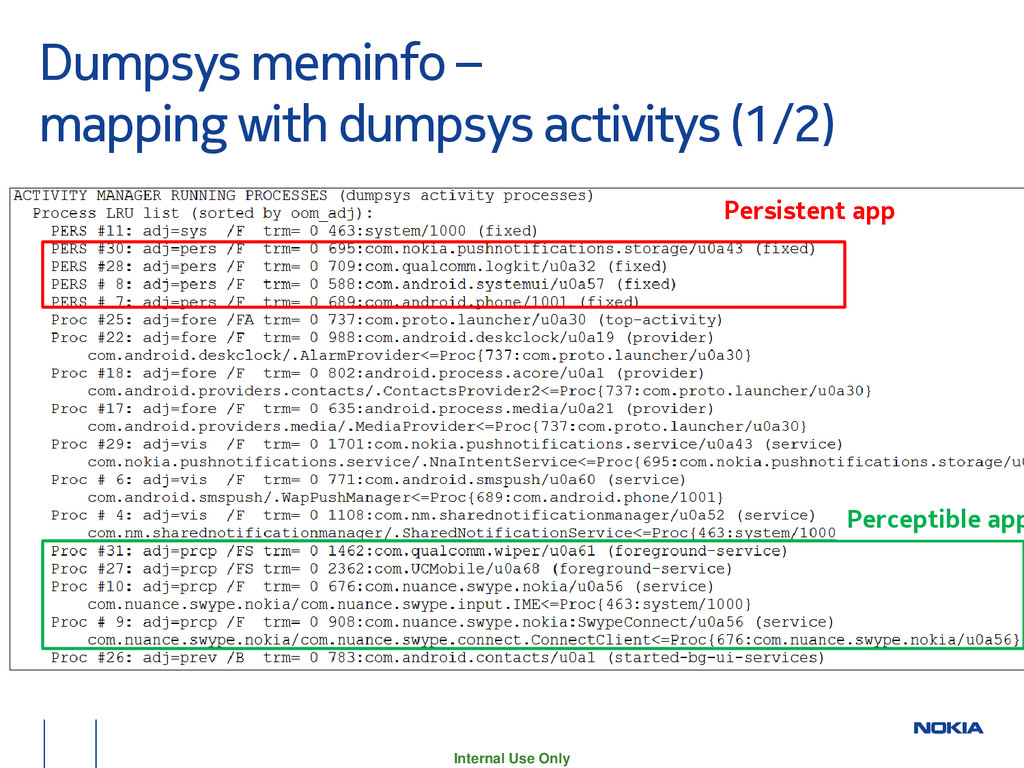
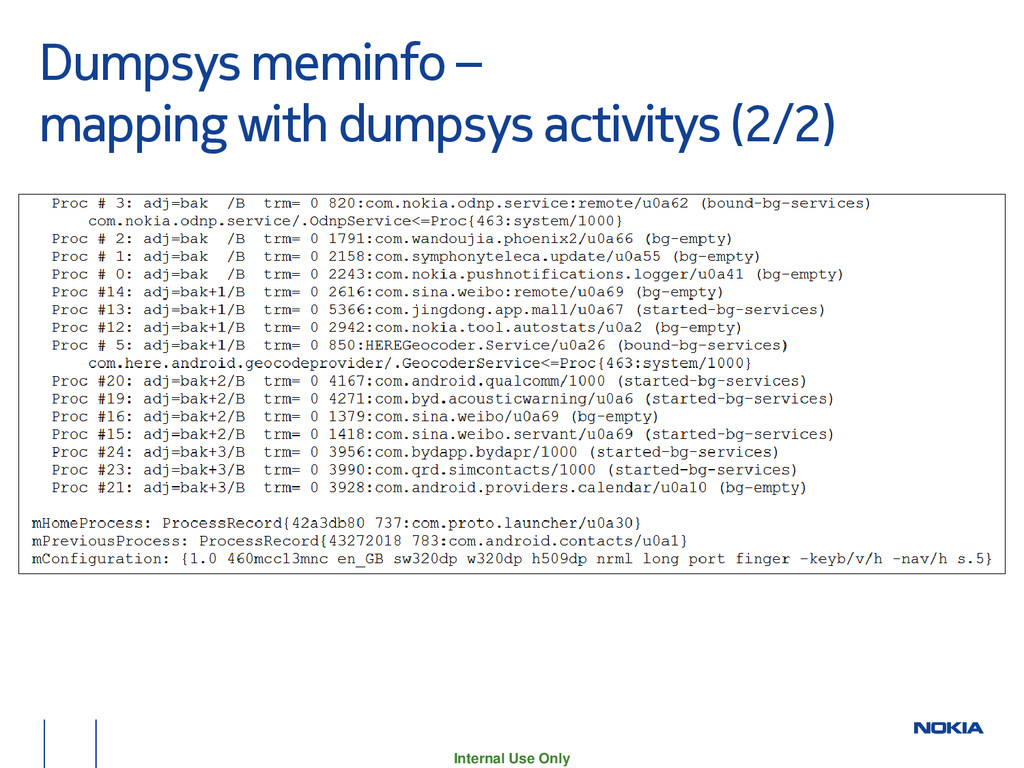
description System -16 System process Persistent -12 This is a system persistent process, such as telephony. Foreground 0 This is the process running the current foreground app. Visible 1 This is a process only hosting activities that are visible to the user. Perceptible 2 This is a process only hosting components that are perceptible to the user, and we really want to avoid killing them, but they are not immediately visible. An example is background music playback. Heavy Weight 3 It is in the background, but we want to try to avoid killing it. Backup 4 This is a process currently hosting a backup operation. Killing it is not entirely fatal but is generally a bad idea. Services 5 This is a process holding an application service. Home 6 This is a process holding the home application -- we want to try avoiding killing it, even if it would normally be in the background, because the user interacts with it so much. Previous 7 This is the process of the previous application that the user was in. such as clicking on a URI in the e-mail app to view in the browser, and then pressing back to return to e-mail. B Services 8 The B list of SERVICE_ADJ -- these are the old and decrepit services that aren't as shiny and interesting as the ones in the A list. Background 15 This is a process only hosting activities that are not visible, so it can be killed without any disruption.
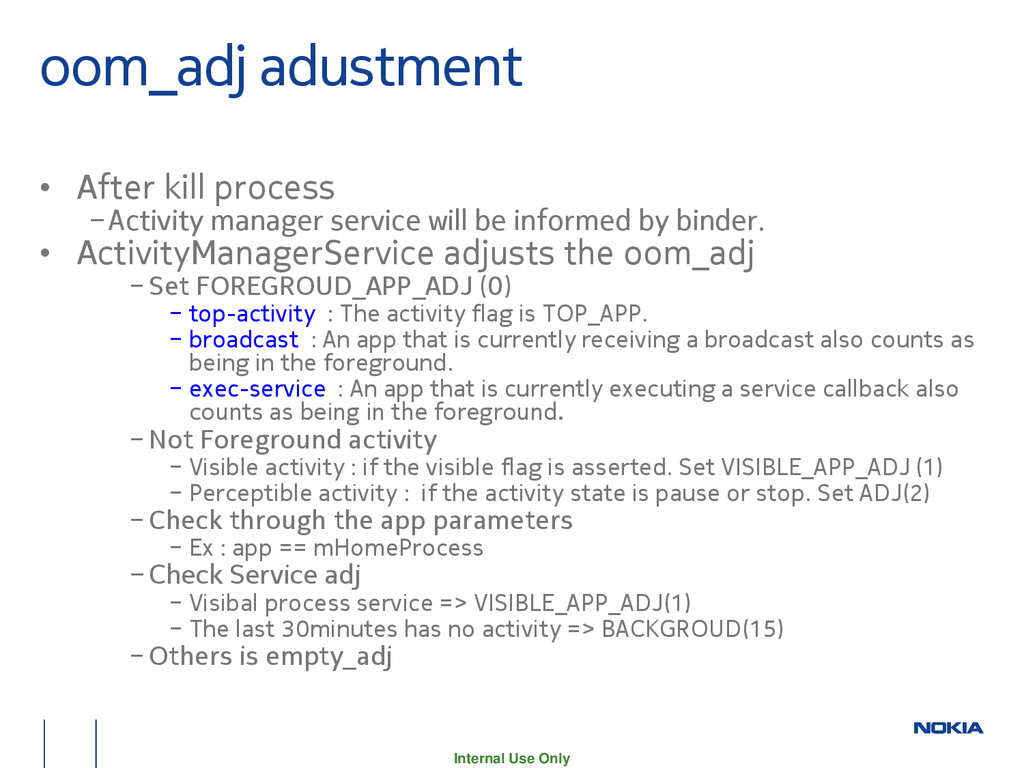
manager service will be informed by binder. • ActivityManagerService adjusts the oom_adj − Set FOREGROUD_APP_ADJ (0) − top-activity : The activity flag is TOP_APP. − broadcast : An app that is currently receiving a broadcast also counts as being in the foreground. − exec-service : An app that is currently executing a service callback also counts as being in the foreground. − Not Foreground activity − Visible activity : if the visible flag is asserted. Set VISIBLE_APP_ADJ (1) − Perceptible activity : if the activity state is pause or stop. Set ADJ(2) − Check through the app parameters − Ex : app == mHomeProcess − Check Service adj − Visibal process service => VISIBLE_APP_ADJ(1) − The last 30minutes has no activity => BACKGROUD(15) − Others is empty_adj
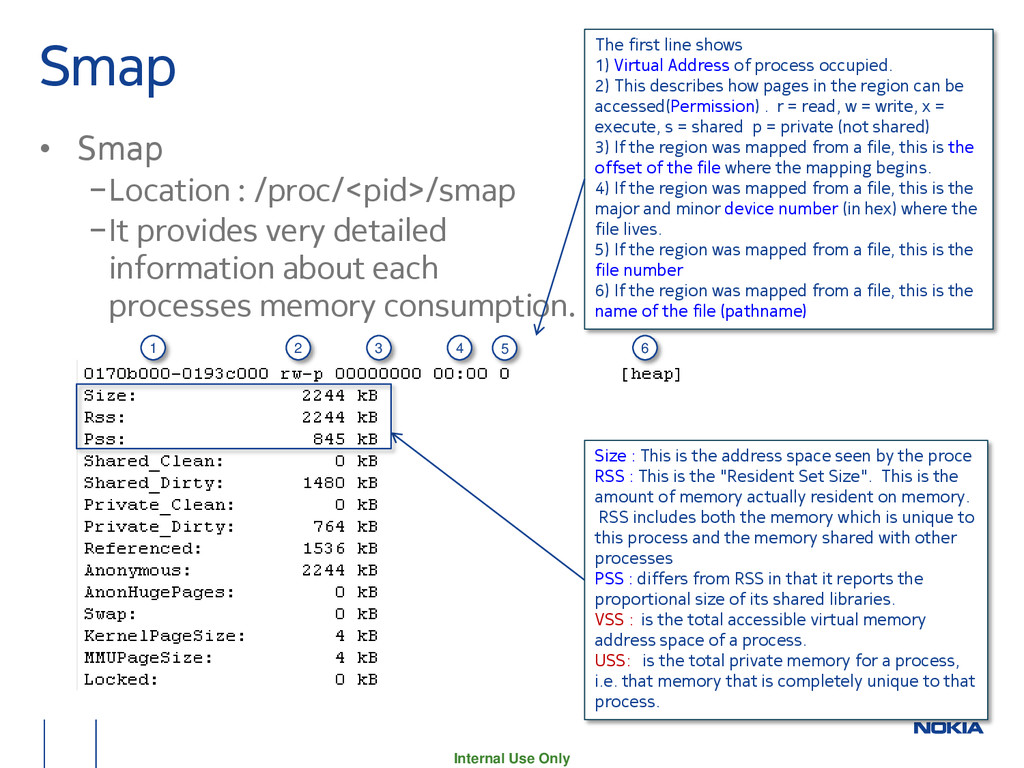
provides very detailed information about each processes memory consumption. Size : This is the address space seen by the proce RSS : This is the "Resident Set Size". This is the amount of memory actually resident on memory. RSS includes both the memory which is unique to this process and the memory shared with other processes PSS : differs from RSS in that it reports the proportional size of its shared libraries. VSS : is the total accessible virtual memory address space of a process. USS: is the total private memory for a process, i.e. that memory that is completely unique to that process. The first line shows 1) Virtual Address of process occupied. 2) This describes how pages in the region can be accessed(Permission) . r = read, w = write, x = execute, s = shared p = private (not shared) 3) If the region was mapped from a file, this is the offset of the file where the mapping begins. 4) If the region was mapped from a file, this is the major and minor device number (in hex) where the file lives. 5) If the region was mapped from a file, this is the file number 6) If the region was mapped from a file, this is the name of the file (pathname) 1 2 3 4 5 6
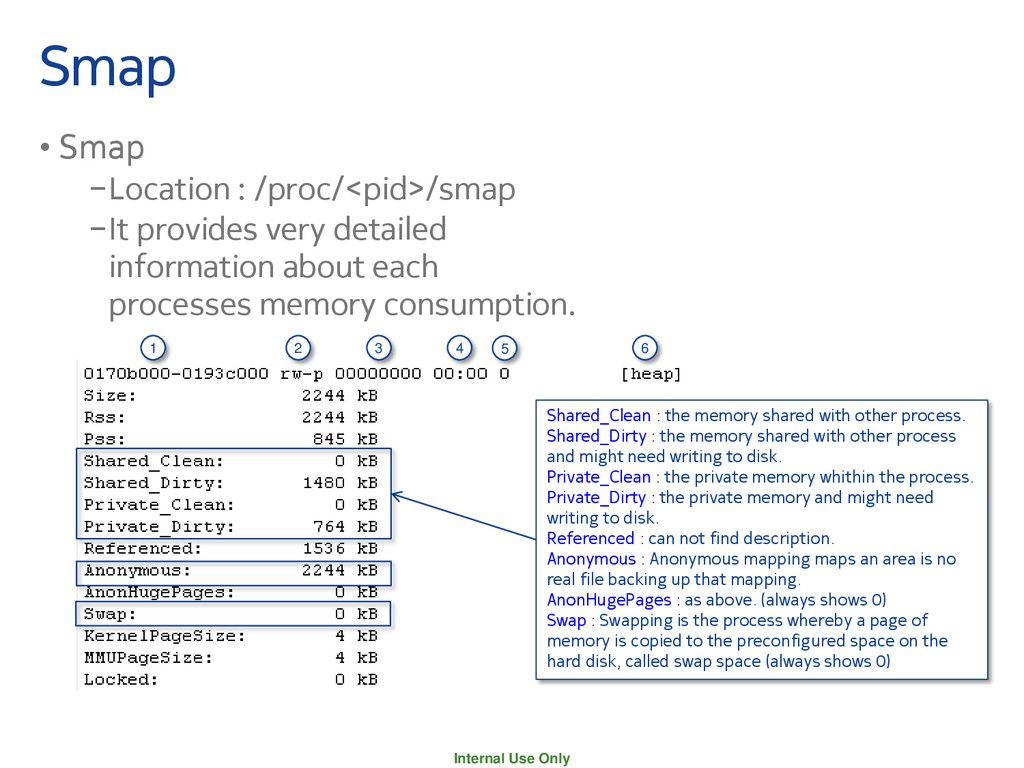
provides very detailed information about each processes memory consumption. Shared_Clean : the memory shared with other process. Shared_Dirty : the memory shared with other process and might need writing to disk. Private_Clean : the private memory whithin the process. Private_Dirty : the private memory and might need writing to disk. Referenced : can not find description. Anonymous : Anonymous mapping maps an area is no real file backing up that mapping. AnonHugePages : as above. (always shows 0) Swap : Swapping is the process whereby a page of memory is copied to the preconfigured space on the hard disk, called swap space (always shows 0) 1 2 3 4 5 6
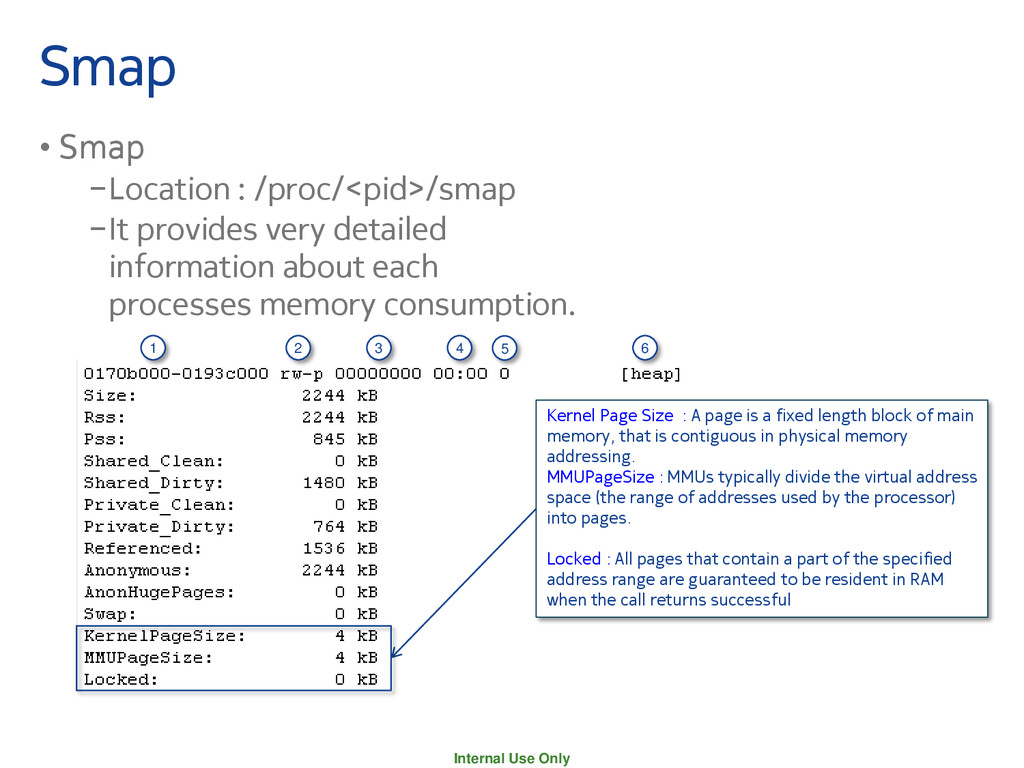
provides very detailed information about each processes memory consumption. Kernel Page Size : A page is a fixed length block of main memory, that is contiguous in physical memory addressing. MMUPageSize : MMUs typically divide the virtual address space (the range of addresses used by the processor) into pages. Locked : All pages that contain a part of the specified address range are guaranteed to be resident in RAM when the call returns successful 1 2 3 4 5 6
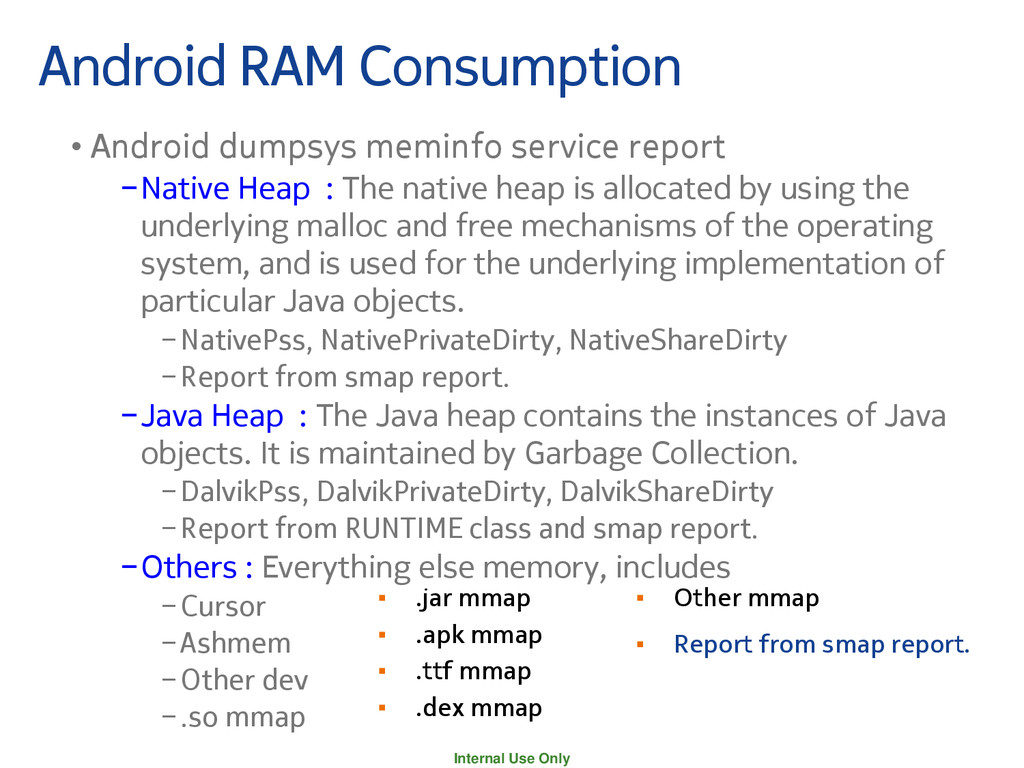
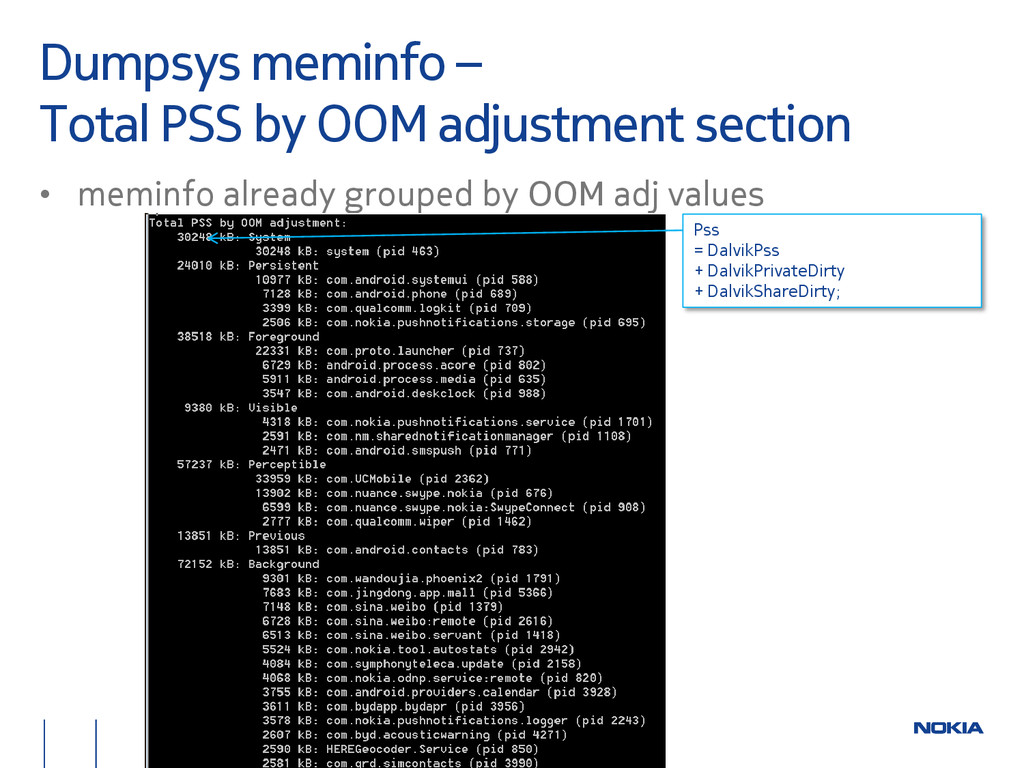
service report −Native Heap : The native heap is allocated by using the underlying malloc and free mechanisms of the operating system, and is used for the underlying implementation of particular Java objects. −NativePss, NativePrivateDirty, NativeShareDirty −Report from smap report. −Java Heap : The Java heap contains the instances of Java objects. It is maintained by Garbage Collection. −DalvikPss, DalvikPrivateDirty, DalvikShareDirty −Report from RUNTIME class and smap report. −Others : Everything else memory, includes −Cursor −Ashmem −Other dev −.so mmap ▪ .jar mmap ▪ .apk mmap ▪ .ttf mmap ▪ .dex mmap ▪ Other mmap ▪ Report from smap report.
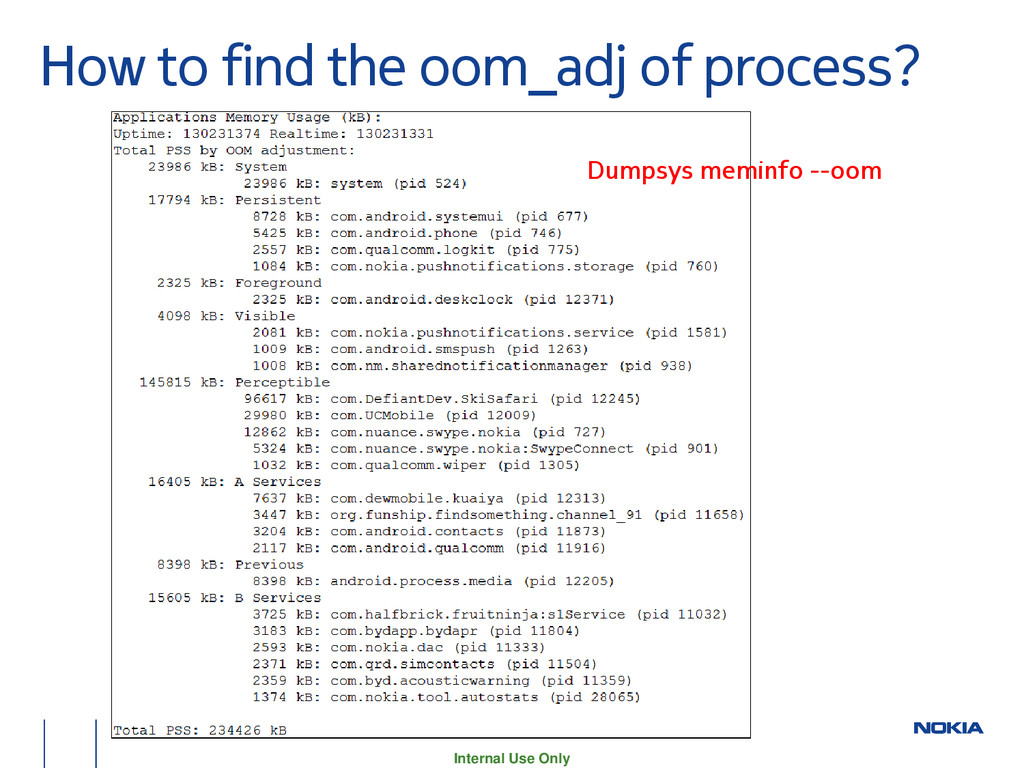
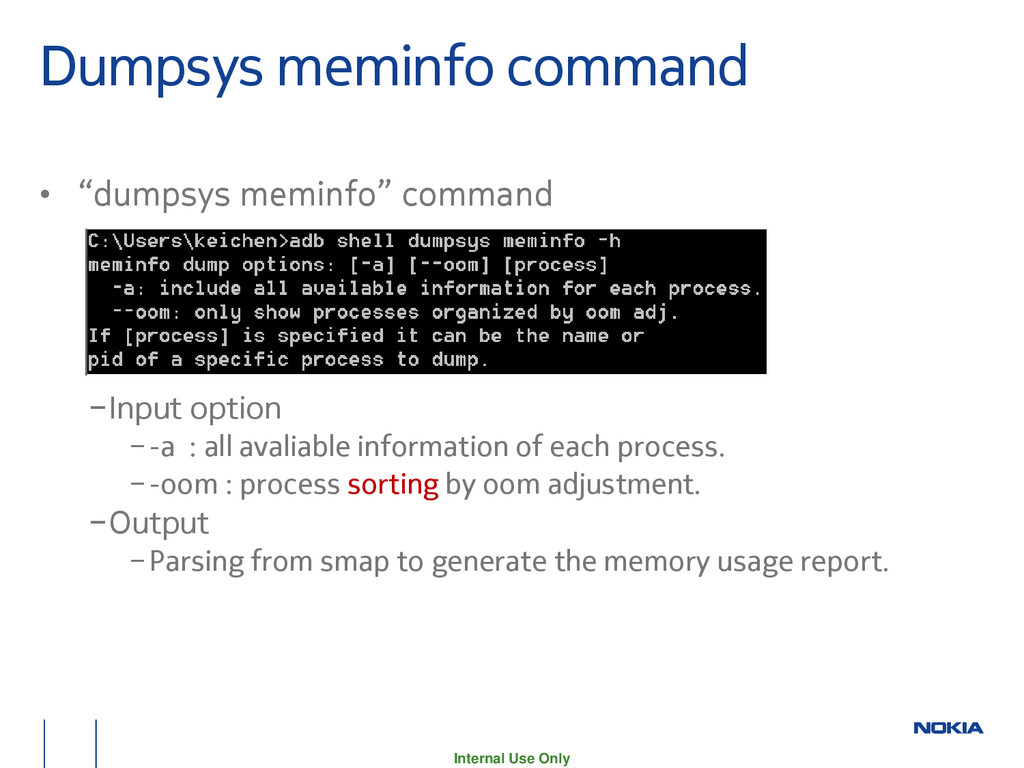
−Input option −-a : all avaliable information of each process. −-oom : process sorting by oom adjustment. −Output −Parsing from smap to generate the memory usage report.
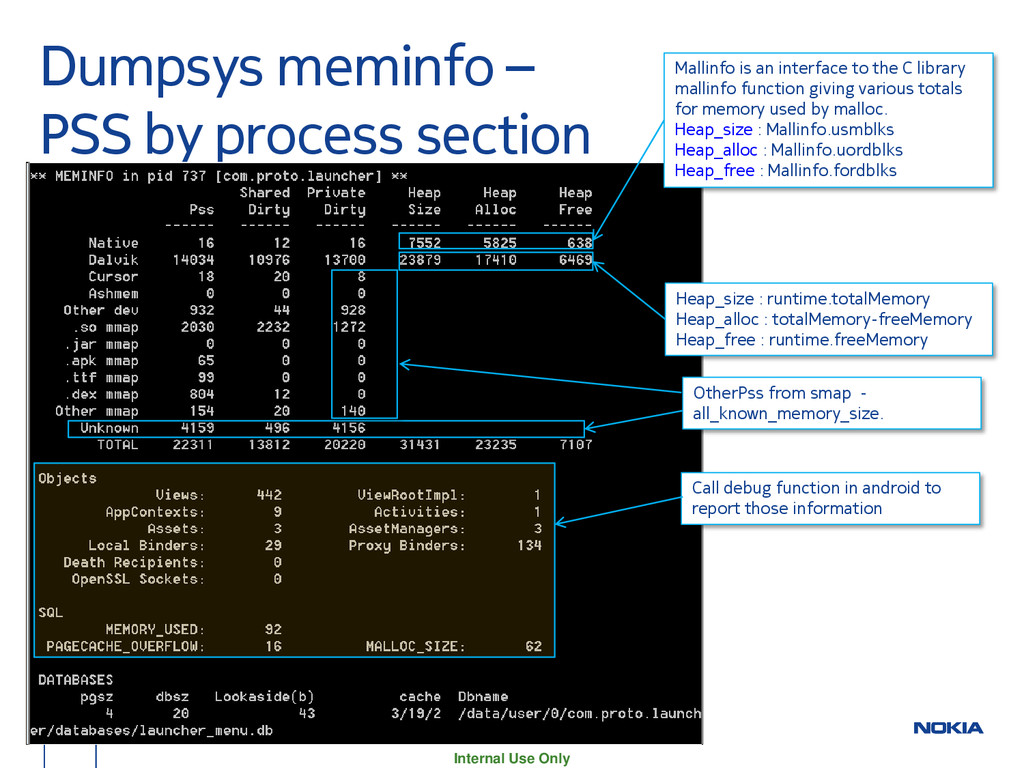
OtherPss from smap - all_known_memory_size. Mallinfo is an interface to the C library mallinfo function giving various totals for memory used by malloc. Heap_size : Mallinfo.usmblks Heap_alloc : Mallinfo.uordblks Heap_free : Mallinfo.fordblks Heap_size : runtime.totalMemory Heap_alloc : totalMemory-freeMemory Heap_free : runtime.freeMemory Call debug function in android to report those information
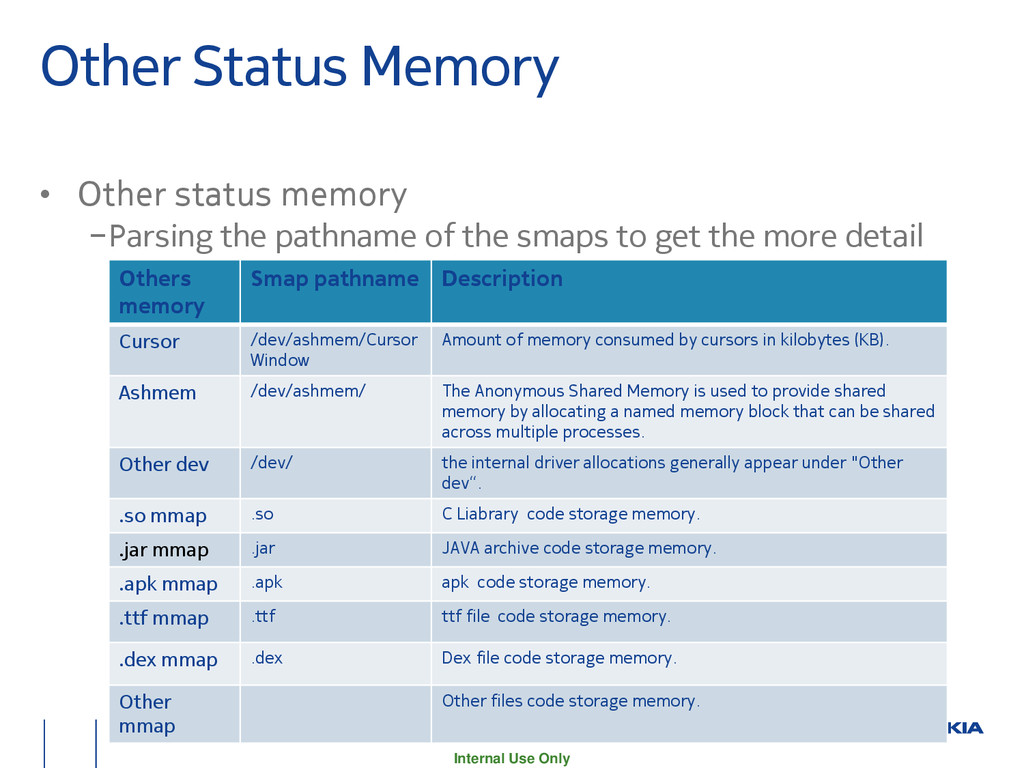
−Parsing the pathname of the smaps to get the more detail memory allocation information. Others memory Smap pathname Description Cursor /dev/ashmem/Cursor Window Amount of memory consumed by cursors in kilobytes (KB). Ashmem /dev/ashmem/ The Anonymous Shared Memory is used to provide shared memory by allocating a named memory block that can be shared across multiple processes. Other dev /dev/ the internal driver allocations generally appear under "Other dev“. .so mmap .so C Liabrary code storage memory. .jar mmap .jar JAVA archive code storage memory. .apk mmap .apk apk code storage memory. .ttf mmap .ttf ttf file code storage memory. .dex mmap .dex Dex file code storage memory. Other mmap Other files code storage memory.
( dalvik info ) • dalvikMax −This DVM total memory which are available to the process. • dalvikFree −The DVM total free memory which are available to the process. • dalvikAllocated −dalvikMax - dalvikFree
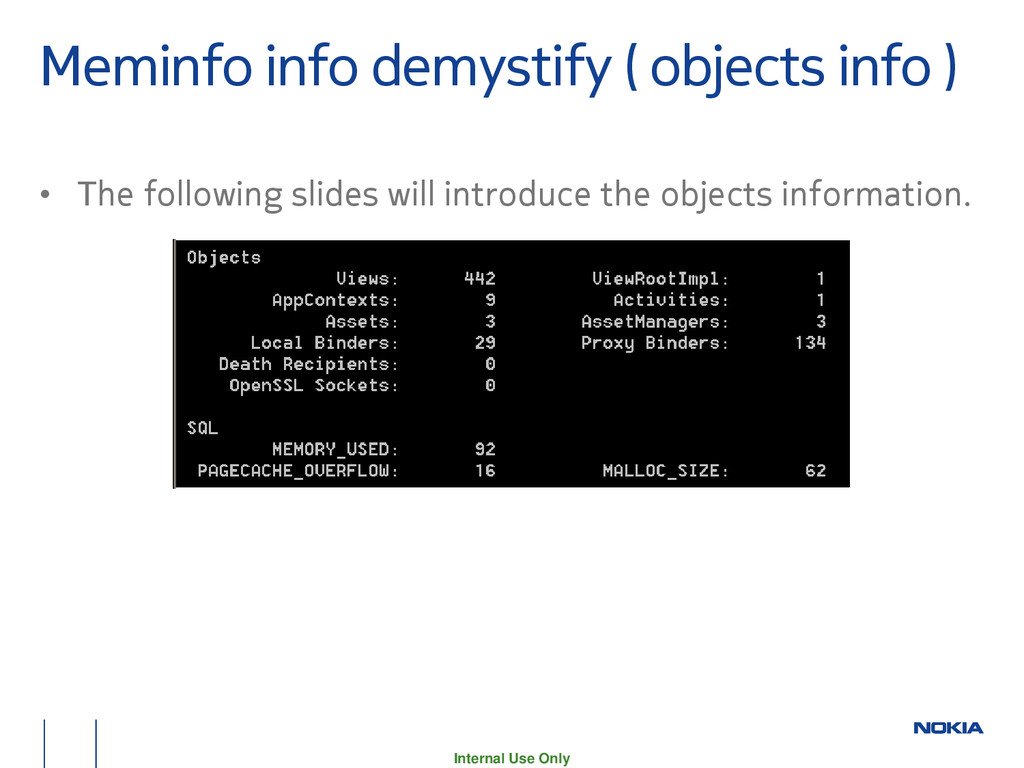
/ activity / socket count • viewInstanceCount −Use VMDebug class to get the count of View.class • viewRootInstanceCount −Use VMDebug class to get the count of ViewRootImpl.class • appContextInstanceCount −Use VMDebug class to get the count of ContextImpl.class • activityInstanceCount −Use VMDebug class to get the count of Activity.class • openSslSocketCount −Use VMDebug class to get the count of OpenSSLSocketImpl.class
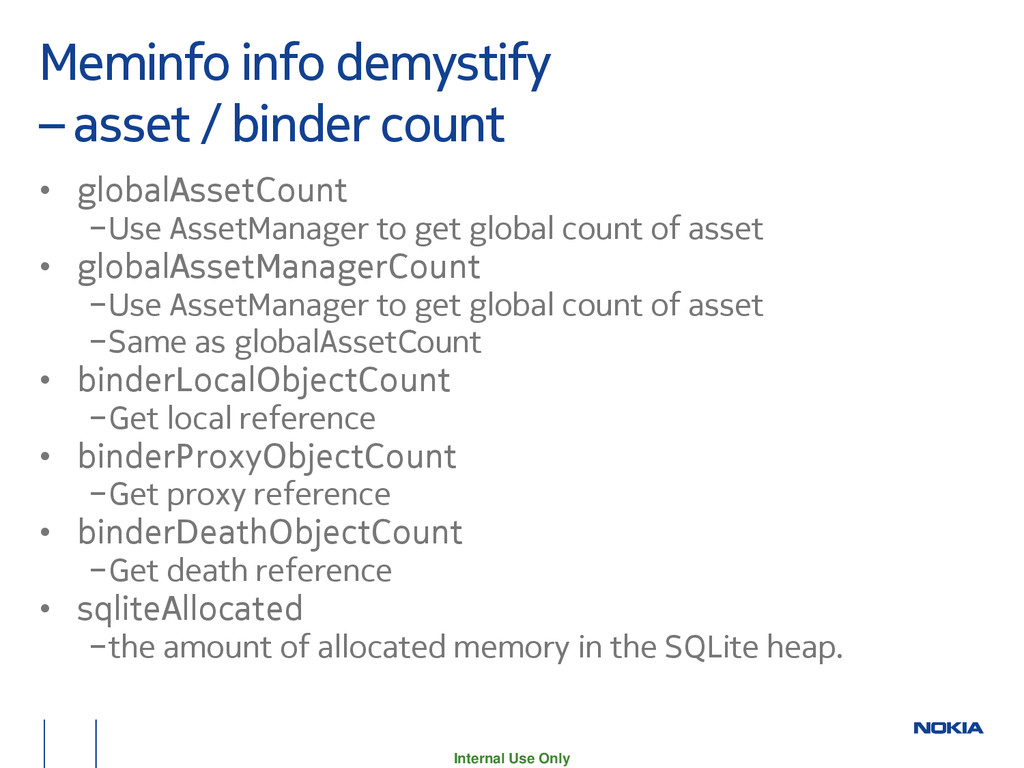
count • globalAssetCount −Use AssetManager to get global count of asset • globalAssetManagerCount −Use AssetManager to get global count of asset −Same as globalAssetCount • binderLocalObjectCount −Get local reference • binderProxyObjectCount −Get proxy reference • binderDeathObjectCount −Get death reference • sqliteAllocated −the amount of allocated memory in the SQLite heap.
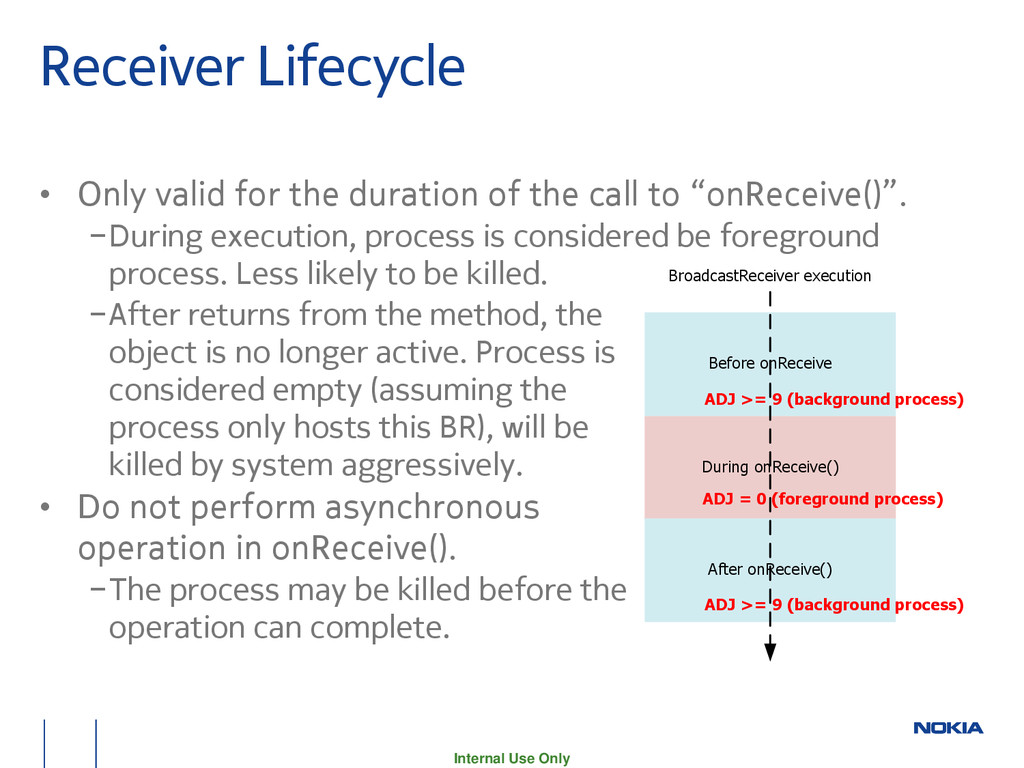
duration of the call to “onReceive()”. −During execution, process is considered be foreground process. Less likely to be killed. −After returns from the method, the object is no longer active. Process is considered empty (assuming the process only hosts this BR), will be killed by system aggressively. • Do not perform asynchronous operation in onReceive(). −The process may be killed before the operation can complete. During onReceive() Before onReceive After onReceive() BroadcastReceiver execution ADJ = 0 (foreground process) ADJ >= 9 (background process) ADJ >= 9 (background process)