Upgrade to Pro — share decks privately, control downloads, hide ads and more …

Cloudadmins Barcelona: Meetup 19/12/2020

Cloudadmins Barcelona: Meetup 19/12/2020

Elastic Observability Session

Cloudadmins Barcelona

November 19, 2020
Tweet

More Decks by Cloudadmins Barcelona

Other Decks in Technology

Transcript

  1. Infrastructure monitoring
    with Elastic
    Carlos Pérez-Aradros Herce - Platform Integrations Tech Lead
    19 Nov 2020

    View Slide

  2. Carlos Pérez-Aradros Herce
    Tech lead - Integrations platforms
    [email protected]
    exekias

    View Slide

  3. Elastic is a search company.

    View Slide

  4. Search. Observe. Protect.

    View Slide

  5. 3 solutions
    Elastic Enterprise Search Elastic Security
    Elastic Observability

    View Slide

  6. Elastic Enterprise Search Elastic Security
    Elastic Observability
    Kibana
    Elasticsearch
    Beats Logstash
    3 solutions powered by 1 stack
    Elastic Stack

    View Slide

  7. SaaS Orchestration
    Elastic Cloud
    on Kubernetes
    Elastic Cloud Elastic Cloud
    Enterprise
    Elastic Enterprise Search Elastic Security
    Elastic Observability
    Kibana
    Elasticsearch
    Beats Logstash
    Deploy anywhere.
    Powered by the
    Elastic Stack
    3 solutions
    Deployed
    anywhere

    View Slide

  8. Elastic Observability
    Logs Metrics APM Uptime

    View Slide

  9. Unified visibility
    across your entire
    ecosystem
    Bring your logs, metrics, and
    traces together into a single stack
    so you can monitor, detect, and
    react to events with speed.
    ELASTIC OBSERVABILITY

    View Slide

  10. Cloud monitoring

    View Slide

  11. You don’t choose multi-cloud; multi-cloud chooses you.
    Enterprise Cloud Strategy
    More than 1000 employees
    Multiple public
    Single public
    Single private
    Multi-cloud
    93%
    Source: Flexera 2020 State of the Cloud Report
    Hybrid cloud
    87%
    6%
    6%
    1%

    View Slide

  12. Beats: The Lightweight Shippers of the Elastic Stack
    auditbeat
    filebeat
    heartbeat
    metricbeat
    packetbeat
    winlogbeat

    View Slide

  13. On-Premises
    alerting
    User group A User group B
    Observability With Multi-Cloud

    View Slide

  14. APM
    Logs&Metrics
    API
    API
    Azure
    Monitor
    Event
    Hub
    APM
    GCP
    Stackdriver
    Logs&Metrics
    API
    APM
    Logs&Metrics
    API
    AWS
    CloudWatch
    CCS
    CCS
    CCS
    Future: Multi-Cloud and Cross Cluster

    View Slide

  15. Method 1
    Metrics
    Azure
    Services
    GCP
    Services
    Stackdriver
    Monitoring
    Monitor
    CloudWatch
    Method 2
    AWS
    Services

    View Slide

  16. Configuration Example
    – module: aws
    period: 5m
    metricsets:
    – ec2
    credential_profile_name: elastic
    – module: googlecloud
    period: 1m
    metricsets:
    – compute
    region: "us-"
    project_id: "elastic-observability"
    credentials_file_path: "/Desktop/gcp_creds.json"
    exclude_labels: false
    – module: azure
    period: 300s
    metricsets:
    – compute_vm
    client_id: '$AZURE_CLIENT_ID""}'
    client_secret: '$AZURE_CLIENT_SECRET""}'
    tenant_id: '$AZURE_TENANT_ID""}'
    subscription_id: '$AZURE_SUBSCRIPTION_ID""}'
    refresh_list_interval: 600s

    View Slide

  17. GCP
    BigQuery
    AWS Cost
    Explorer
    AWS
    CloudWatch
    Azure Cost
    Management
    Billing
    Billing

    View Slide

  18. AWS
    Services
    Azure
    Services
    GCP
    Services
    SQS
    S3
    CloudWatch
    Event Hub
    PubSub
    Logs

    View Slide

  19. filebeat.inputs:
    – type: awscloudwatch
    credential_profile_name: elastic-beats
    log_group_arn: arn:aws:logs:us-east-1123:log-group:test:*
    region: us-east-1
    scan_frequency: 30s
    start_position: beginning
    api_timeout: 5m
    filebeat.inputs:
    – type: s3
    queue_url: https://sqs.us-east-1.amazonaws.com/123/test-fb-ks
    credential_profile_name: elastic-beats
    json.message_key: Records
    Configuration Example Using Inputs

    View Slide

  20. Kubernetes monitoring

    View Slide

  21. cluster
    Kubernetes: pods, nodes, cluster
    node
    kubelet proxy
    node
    kubelet proxy
    node
    kubelet proxy
    node
    kubelet proxy
    - pod
    schedule

    View Slide

  22. Monitoring kubernetes environments

    View Slide

  23. Monitoring kubernetes environments
    - What to monitor
    - Hosts
    - Containers
    - Containerized applications
    - Kubernetes components
    - Metrics sources
    - cAdvisor, kubelet
    - kube-state-metrics
    - Prometheus
    - APM
    Metricbeat
    Heapster
    Prometheus
    ...
    Elasticsearch Kibana

    View Slide

  24. Metadata processors - ECS
    Enrich events with useful metadata to correlate logs, metrics & traces
    • cloud.availability_zone
    • cloud.region
    • cloud.instance_id
    • cloud.machine_type
    • cloud.project_id
    • cloud.provider
    • docker.container.id
    • docker.container.image
    • docker.container.name
    • docker.container.labels
    • kubernetes.pod.name
    • kubernetes.namespace
    • kubernetes.labels
    • kubernetes.annotations
    • kubernetes.container.name
    • kubernetes.container.image
    add_cloud_metadata add_docker_metadata add_kubernetes_metadata

    View Slide

  25. Kubernetes deployment
    Node 1
    Metricbeat
    Filebeat
    Node 2
    Metricbeat
    Filebeat
    Node n
    Metricbeat
    Filebeat
    Filebeat
    DaemonSet
    Metricbeat
    DaemonSet

    View Slide

  26. Inventory view
    Birds-eye view of your kubernetes clusters

    View Slide

  27. Node
    Metricbeat Autodiscover
    Oh no! My applications are moving!
    Logs
    Metrics
    nginx
    Elasticsearch
    metricbeat.autodiscover:
    providers:
    - type: kubernetes
    host: ${HOSTNAME}
    templates:
    - condition.contains:
    kubernetes.container.name: nginx
    config:
    - module: nginx
    period: 10s
    metricsets: ["stubstatus"]
    hosts: ["${data.host}:8080"]

    View Slide

  28. Metricbeat Autodiscover

    View Slide

  29. Hints based auto-discovery
    - Hints tell Metricbeat how to get 
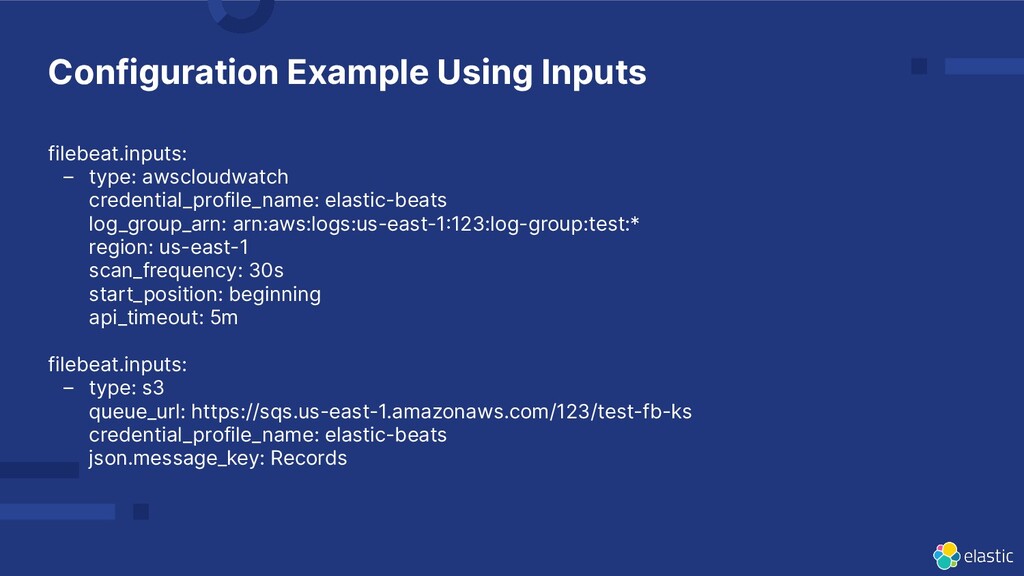
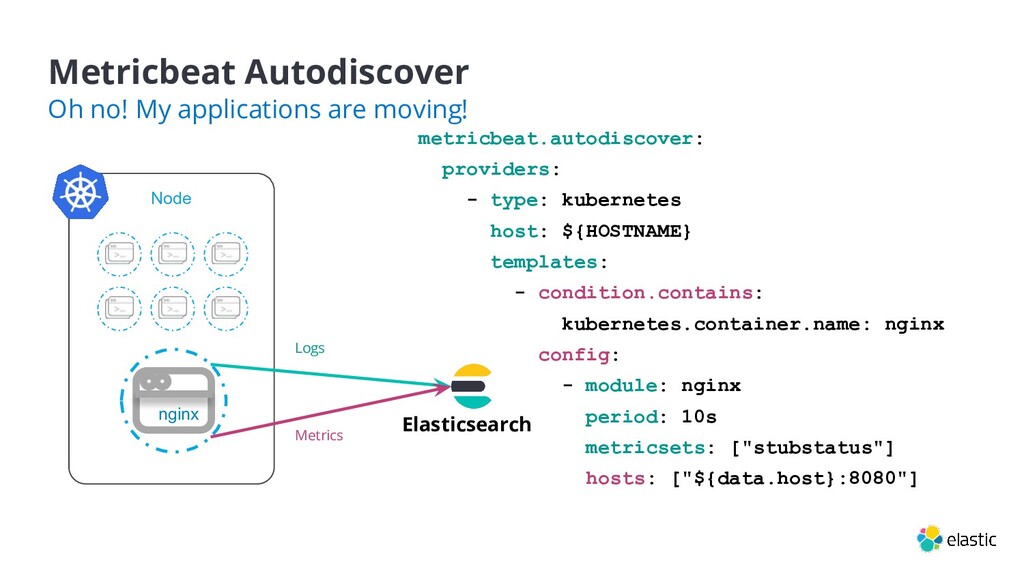
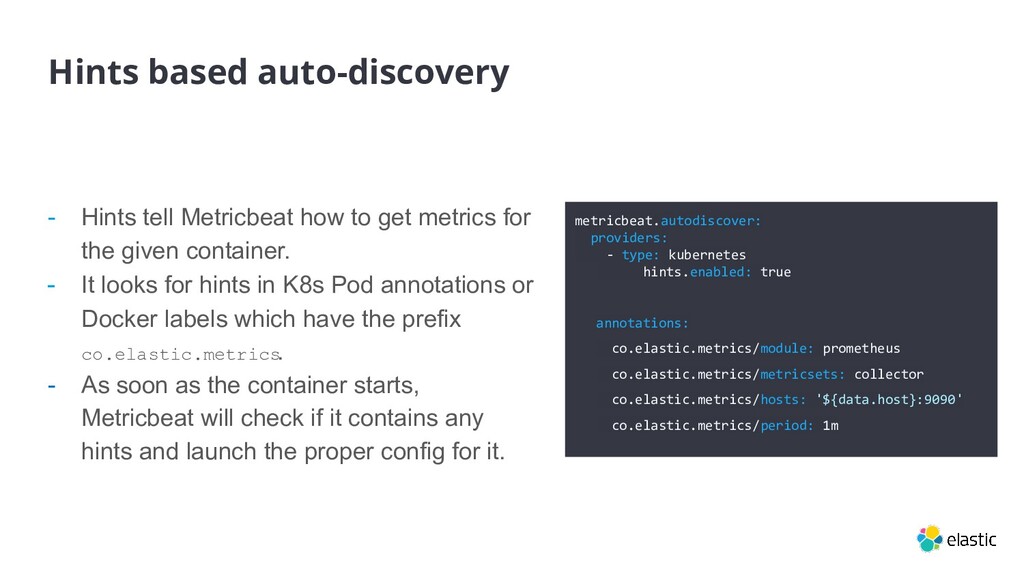
metrics for
    the given container.
    - It looks for hints in K8s Pod annotations or
    Docker labels which have the prefix
    co.elastic.metrics
    .
    - As soon as the container starts,
    Metricbeat will check if it contains any
    hints and launch the proper config for it.
    metricbeat.autodiscover:
    providers:
    - type: kubernetes
    hints.enabled: true
    annotations:
    co.elastic.metrics/module: prometheus
    co.elastic.metrics/metricsets: collector
    co.elastic.metrics/hosts: '${data.host}:9090'
    co.elastic.metrics/period: 1m

    View Slide

  30. Demo time

    View Slide

  31. Service:
    “beats-demo”
    LoadBalancer
    Deployment: “beats-demo“
    Demo scenario: http://34.77.157.229
    Pod
    Pod
    ...
    Deployment:
    “mysql“
    Logs
    Metrics
    Network analytics
    App Performance Metrics
    Pod

    View Slide

  32. Elastic is a Search Company.
    www.elastic.co
    Thank You

    View Slide