Upgrade to Pro — share decks privately, control downloads, hide ads and more …

Finance Benchmarking in the AI Era: Where Do Yo...

Avatar for Auxis Auxis
October 30, 2026

Finance Benchmarking in the AI Era: Where Do You Stand? 

Avatar for Auxis

Auxis

October 30, 2026

More Decks by Auxis

Other Decks in Business

Transcript

  1. Finance benchmarking in the AI era: Where do you stand?

    The benchmarks, operating models and AI capabilities separating Top Performers from the rest Wednesday, Oct. 28, 2026 2:00 – 3:00 PM EST
  2. For a better webcast experience Use a wired internet connection

    from your local office and turn off your computer's Wi-Fi signal. For optimal viewing speed, close all other applications, including Outlook. Most technical issues (e.g., buffering, silenced audio) can be resolved by refreshing your feed using the F5 key. Use the Help button if you have technical difficulties. You can contact [email protected] Click the Resources button to download the presentation materials © 2026 Grant Thornton Advisors LLC | All rights reserved | U .S. member firm of Grant Thornton International Ltd 2
  3. CPE reminders To receive CPE, you must be active for

    the entire webcast and respond to at least 75% of the polls. CPE is not offered for audio-only attendees or replay viewing. Group participation will not receive CPE. You must be logged in individually to receive CPE credit. Upon conclusion of the program, please complete the final evaluation and your CPE certificate will be available if you have met the minimum CPE requirements. Turn off all pop-up blockers to download your CPE certificate. © 2026 Grant Thornton Advisors LLC | All rights reserved | U .S. member firm of Grant Thornton International Ltd 3 Use Q&A to ask questions during the webcast.
  4. Finance benchmarking in the AI era: Where do you stand?

    The benchmarks, operating models and AI capabilities separating Top Performers from the rest Wednesday, Oct. 28, 2026 2:00 – 3:00 PM EST
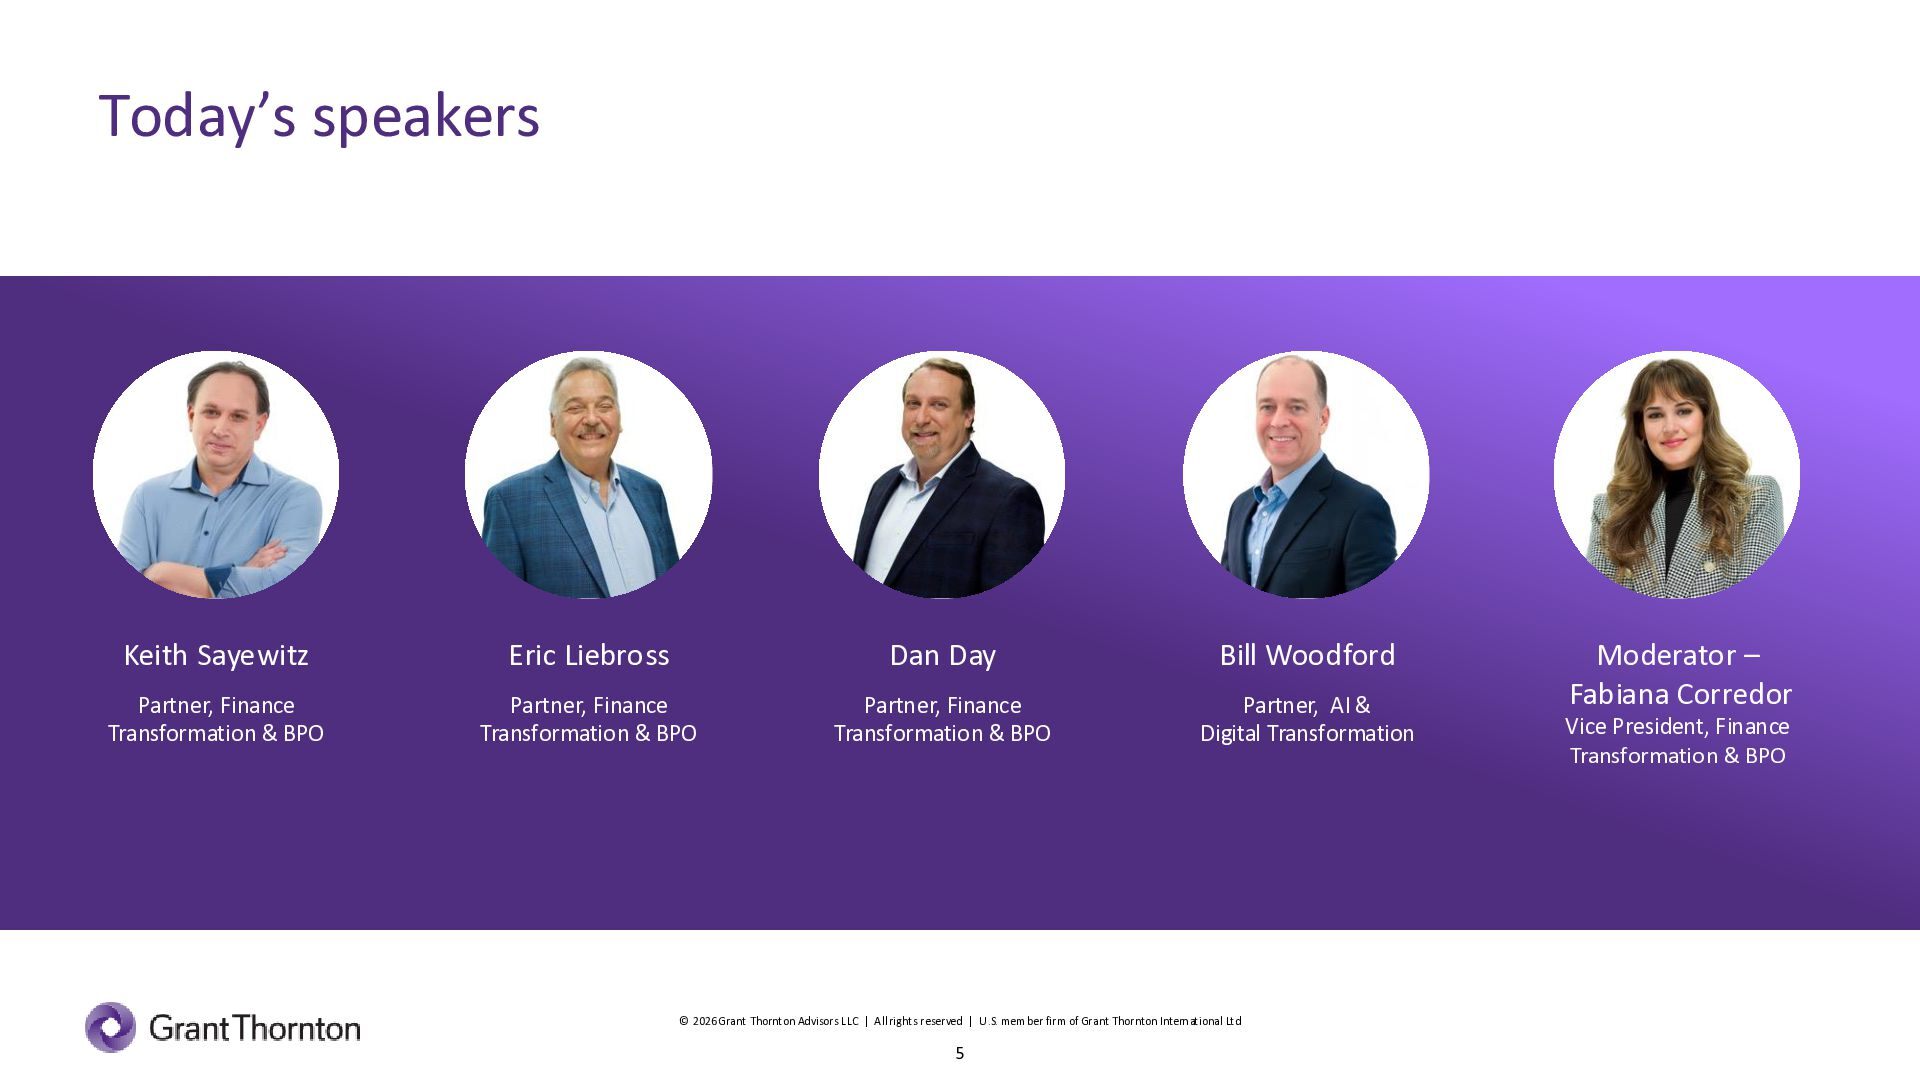
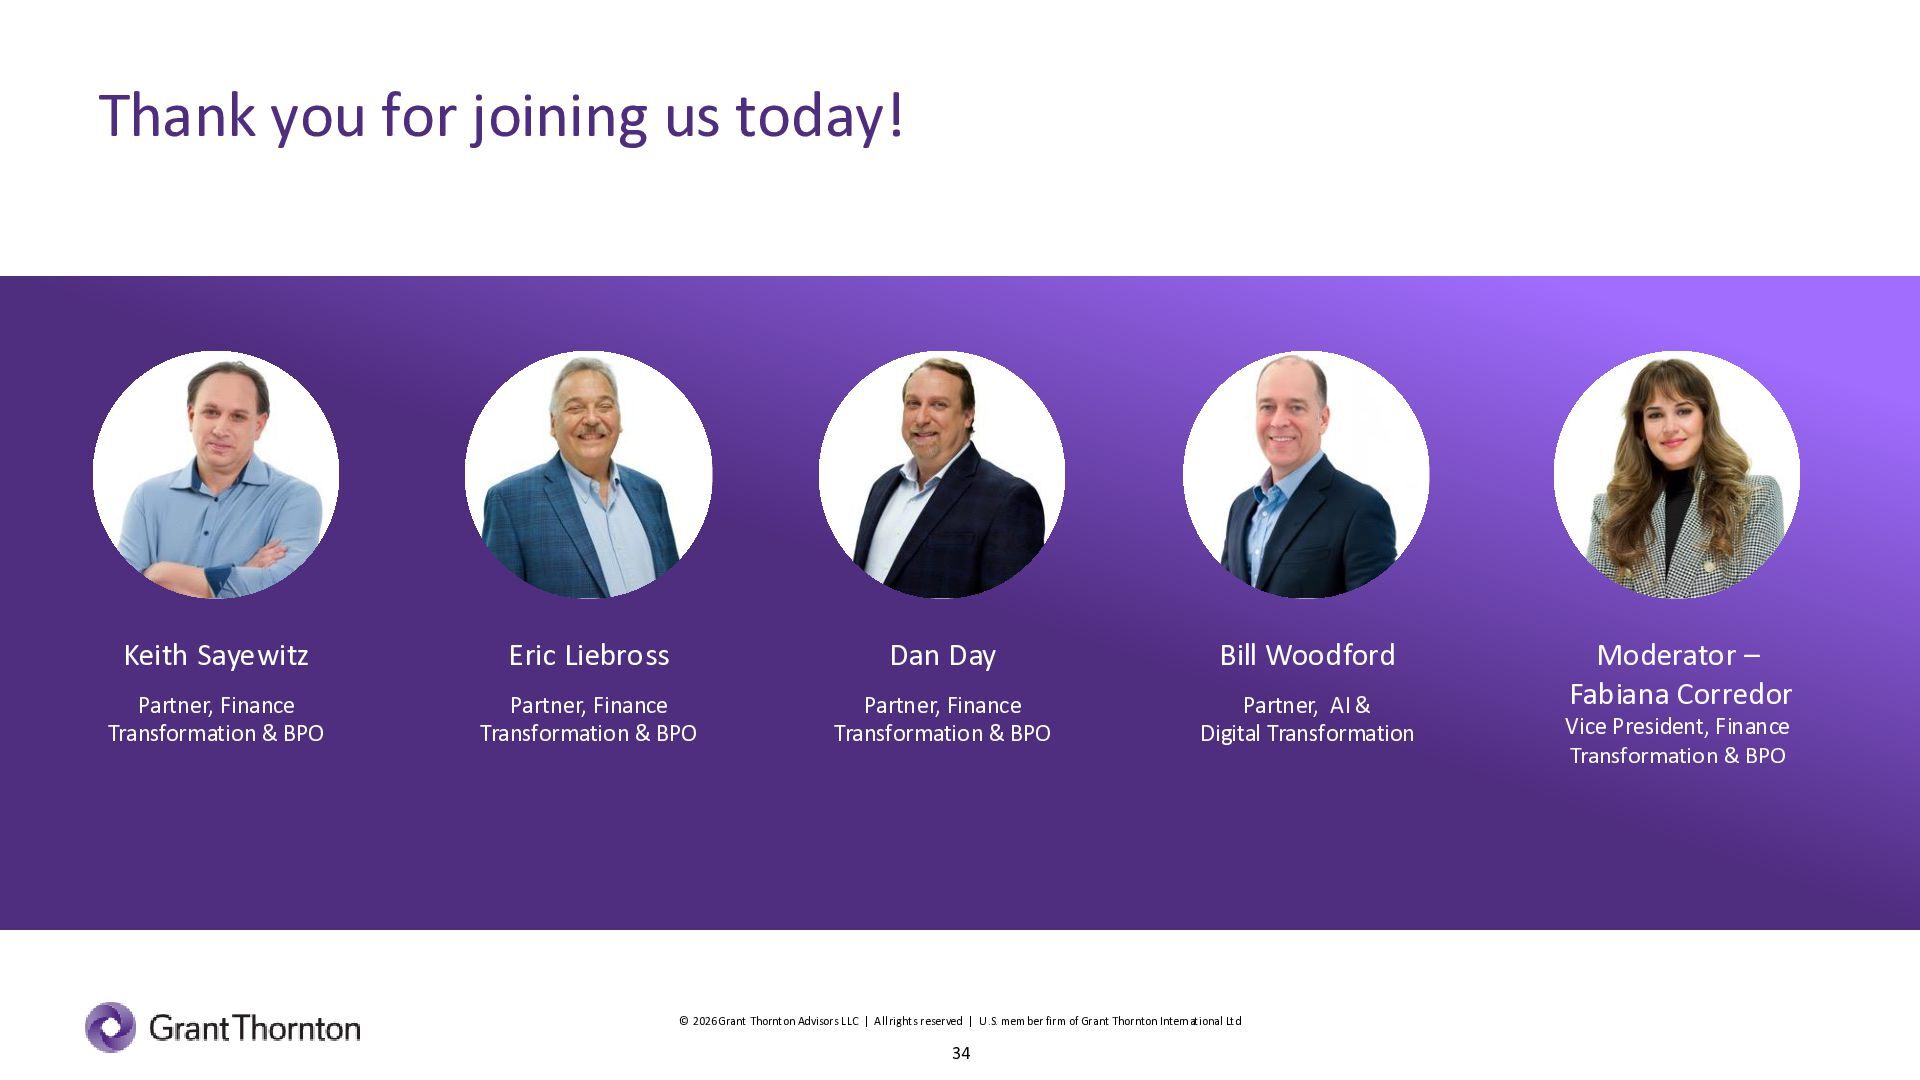
  5. Today’s speakers Keith Sayewitz Eric Liebross Dan Day Bill Woodford

    Partner, Finance Transformation & BPO Partner, Finance Transformation & BPO Partner, Finance Transformation & BPO Partner, AI & Digital Transformation © 2026 Grant Thornton Advisors LLC | All rights reserved | U .S. member firm of Grant Thornton International Ltd 5 Moderator – Fabiana Corredor Vice President, Finance Transformation & BPO
  6. Learning Objectives 1 Assess finance performance using relevant benchmarks across

    AP, AR and General Accounting. 2 Interpret benchmark results to identify meaningful performance gaps and set achievable improvement goals. 3 Recognize how AI and automation are reshaping traditional finance measures and apply emerging metrics to evaluate productivity and business value. 4 Identify underlying performance drivers and determine which process, technology, talent and operating model change can address them. 5 Measure AI and automation opportunities based on business value, operational readiness and potential impact. © 2026 Grant Thornton Advisors LLC | All rights reserved | U .S. member firm of Grant Thornton International Ltd 6
  7. The state of finance What's driving the performance agenda? ©

    2026 Grant Thornton Advisors LLC | All rights reserved | U .S. member firm of Grant Thornton International Ltd 7 7
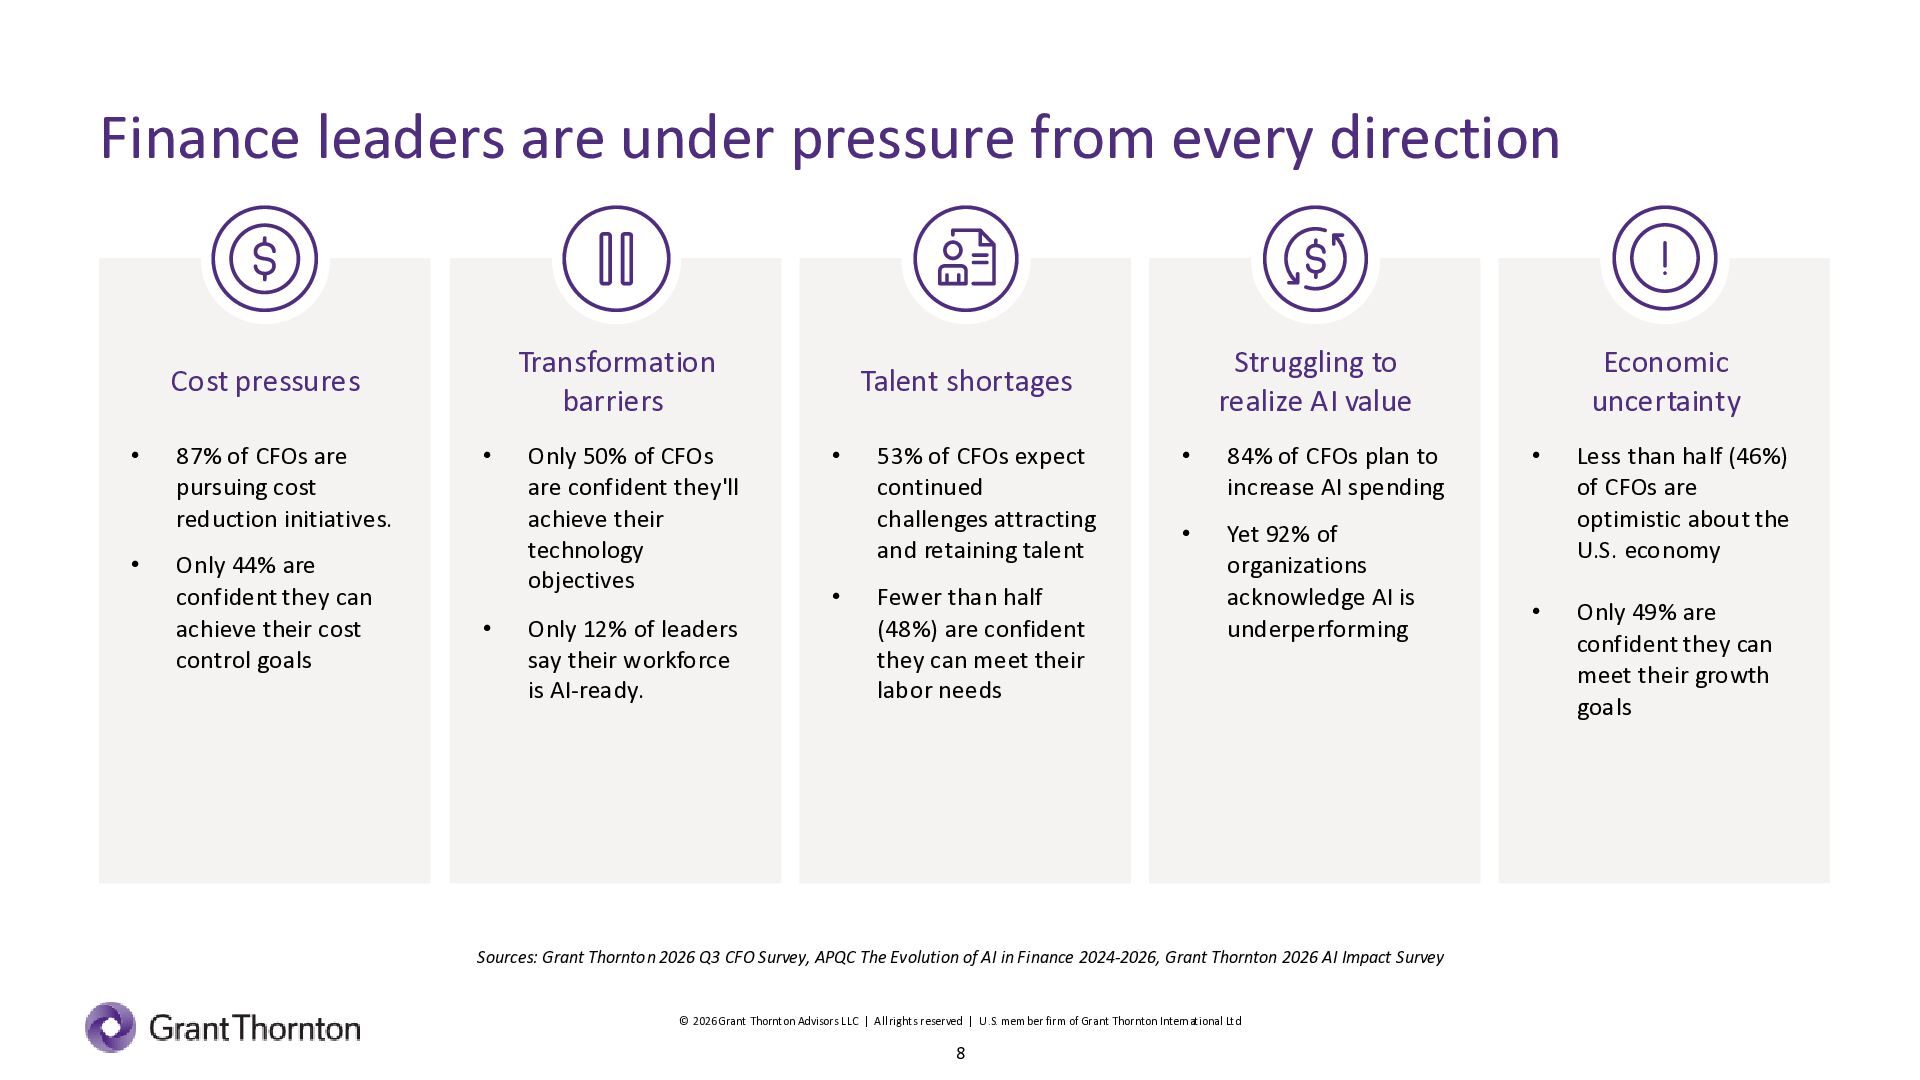
  8. Finance leaders are under pressure from every direction Transformation barriers

    Cost pressures • • 87% of CFOs are pursuing cost reduction initiatives. Only 44% are confident they can achieve their cost control goals • • Only 50% of CFOs are confident they'll achieve their technology objectives Only 12% of leaders say their workforce is AI-ready. Struggling to realize AI value Talent shortages • • 53% of CFOs expect continued challenges attracting and retaining talent Fewer than half (48%) are confident they can meet their labor needs • 84% of CFOs plan to increase AI spending • Yet 92% of organizations acknowledge AI is underperforming Sources: Grant Thornton 2026 Q3 CFO Survey, APQC The Evolution of AI in Finance 2024-2026, Grant Thornton 2026 AI Impact Survey © 2026 Grant Thornton Advisors LLC | All rights reserved | U .S. member firm of Grant Thornton International Ltd 8 Economic uncertainty • Less than half (46%) of CFOs are optimistic about the U.S. economy • Only 49% are confident they can meet their growth goals
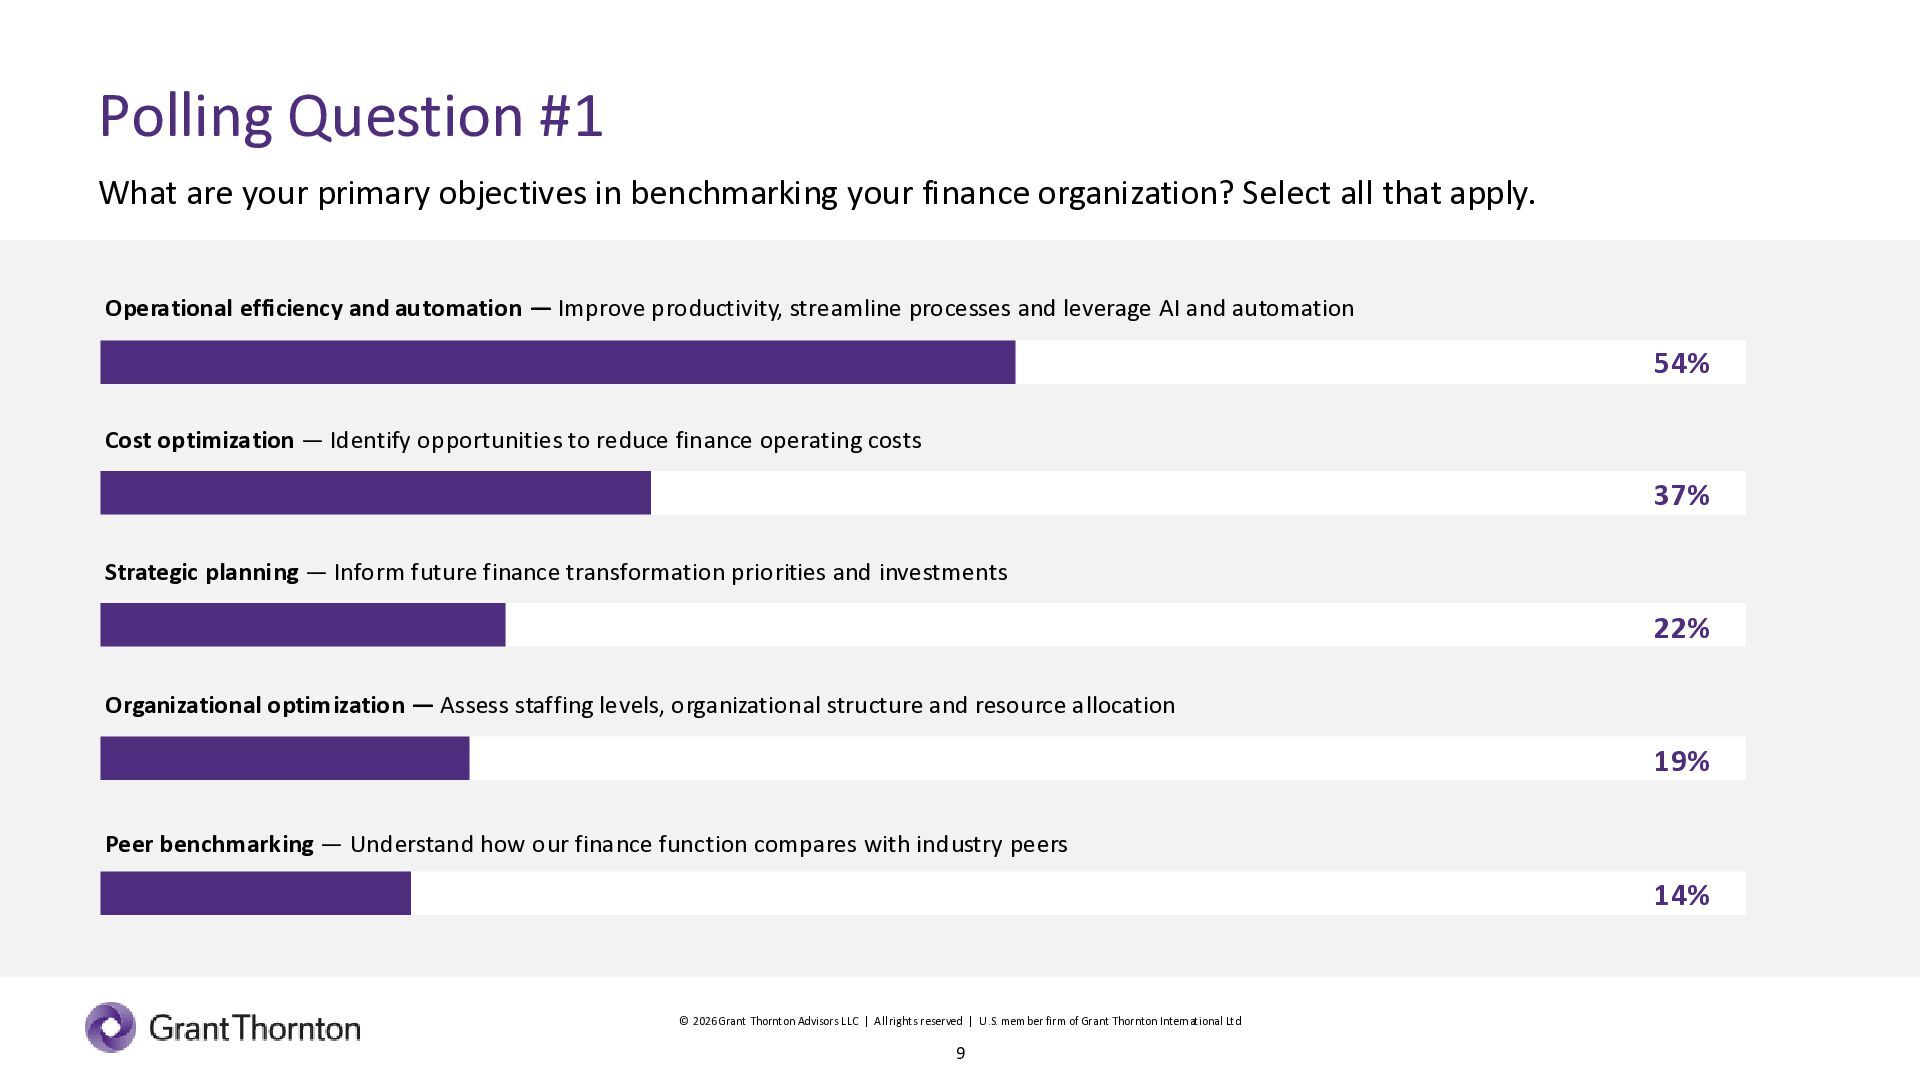
  9. Polling Question #1 What are your primary objectives in benchmarking

    your finance organization? Select all that apply. Operational efficiency and automation — Improve productivity, streamline processes and leverage AI and automation 54% Cost optimization — Identify opportunities to reduce finance operating costs 37% Strategic planning — Inform future finance transformation priorities and investments 22% Organizational optimization — Assess staffing levels, organizational structure and resource allocation 19% Peer benchmarking — Understand how our finance function compares with industry peers 14% © 2026 Grant Thornton Advisors LLC | All rights reserved | U .S. member firm of Grant Thornton International Ltd 9
  10. Why benchmarking matters even more in the era of AI

    © 2026 Grant Thornton Advisors LLC | All rights reserved | U .S. member firm of Grant Thornton International Ltd 10 10
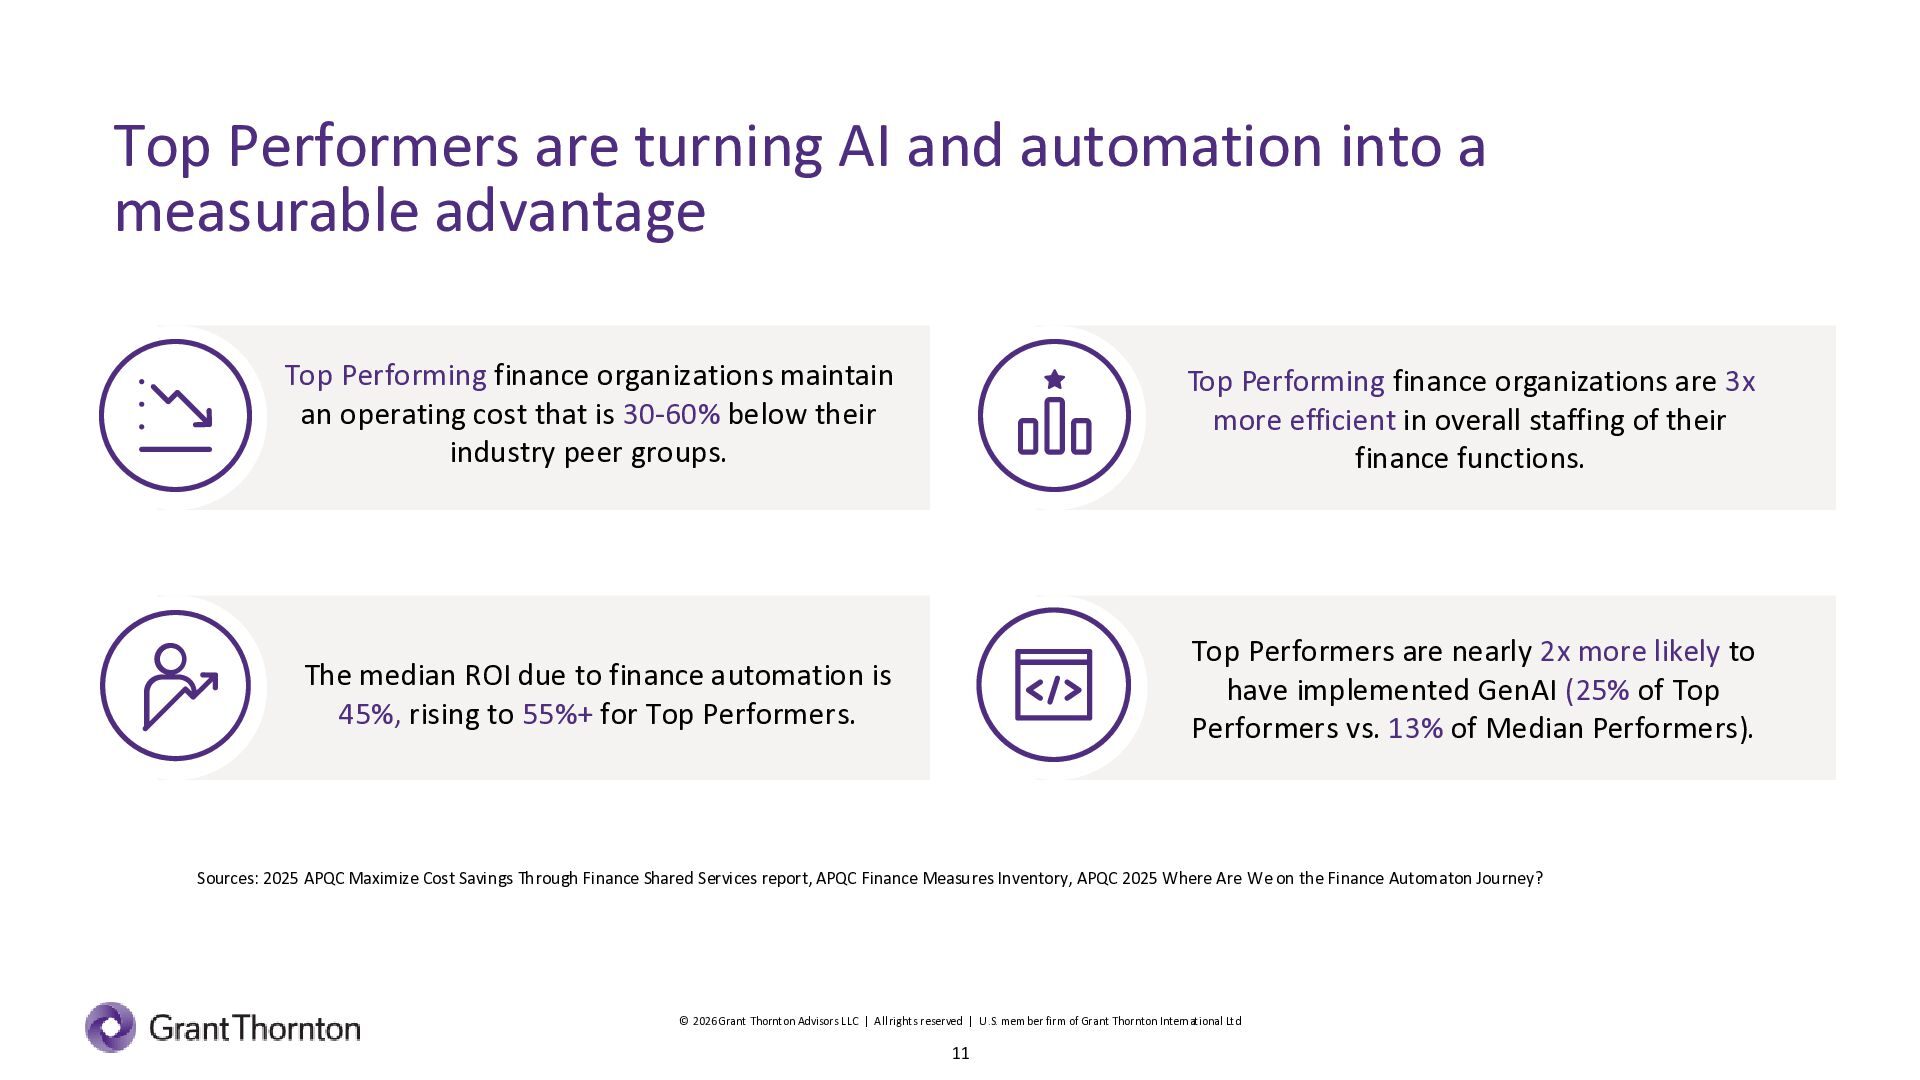
  11. Top Performers are turning AI and automation into a measurable

    advantage Top Performing finance organizations maintain an operating cost that is 30-60% below their industry peer groups. Top Performing finance organizations are 3x more efficient in overall staffing of their finance functions. The median ROI due to finance automation is 45%, rising to 55%+ for Top Performers. Top Performers are nearly 2x more likely to have implemented GenAI (25% of Top Performers vs. 13% of Median Performers). Sources: 2025 APQC Maximize Cost Savings Through Finance Shared Services report, APQC Finance Measures Inventory, APQC 2025 Where Are We on the Finance Automaton Journey? © 2026 Grant Thornton Advisors LLC | All rights reserved | U .S. member firm of Grant Thornton International Ltd 11
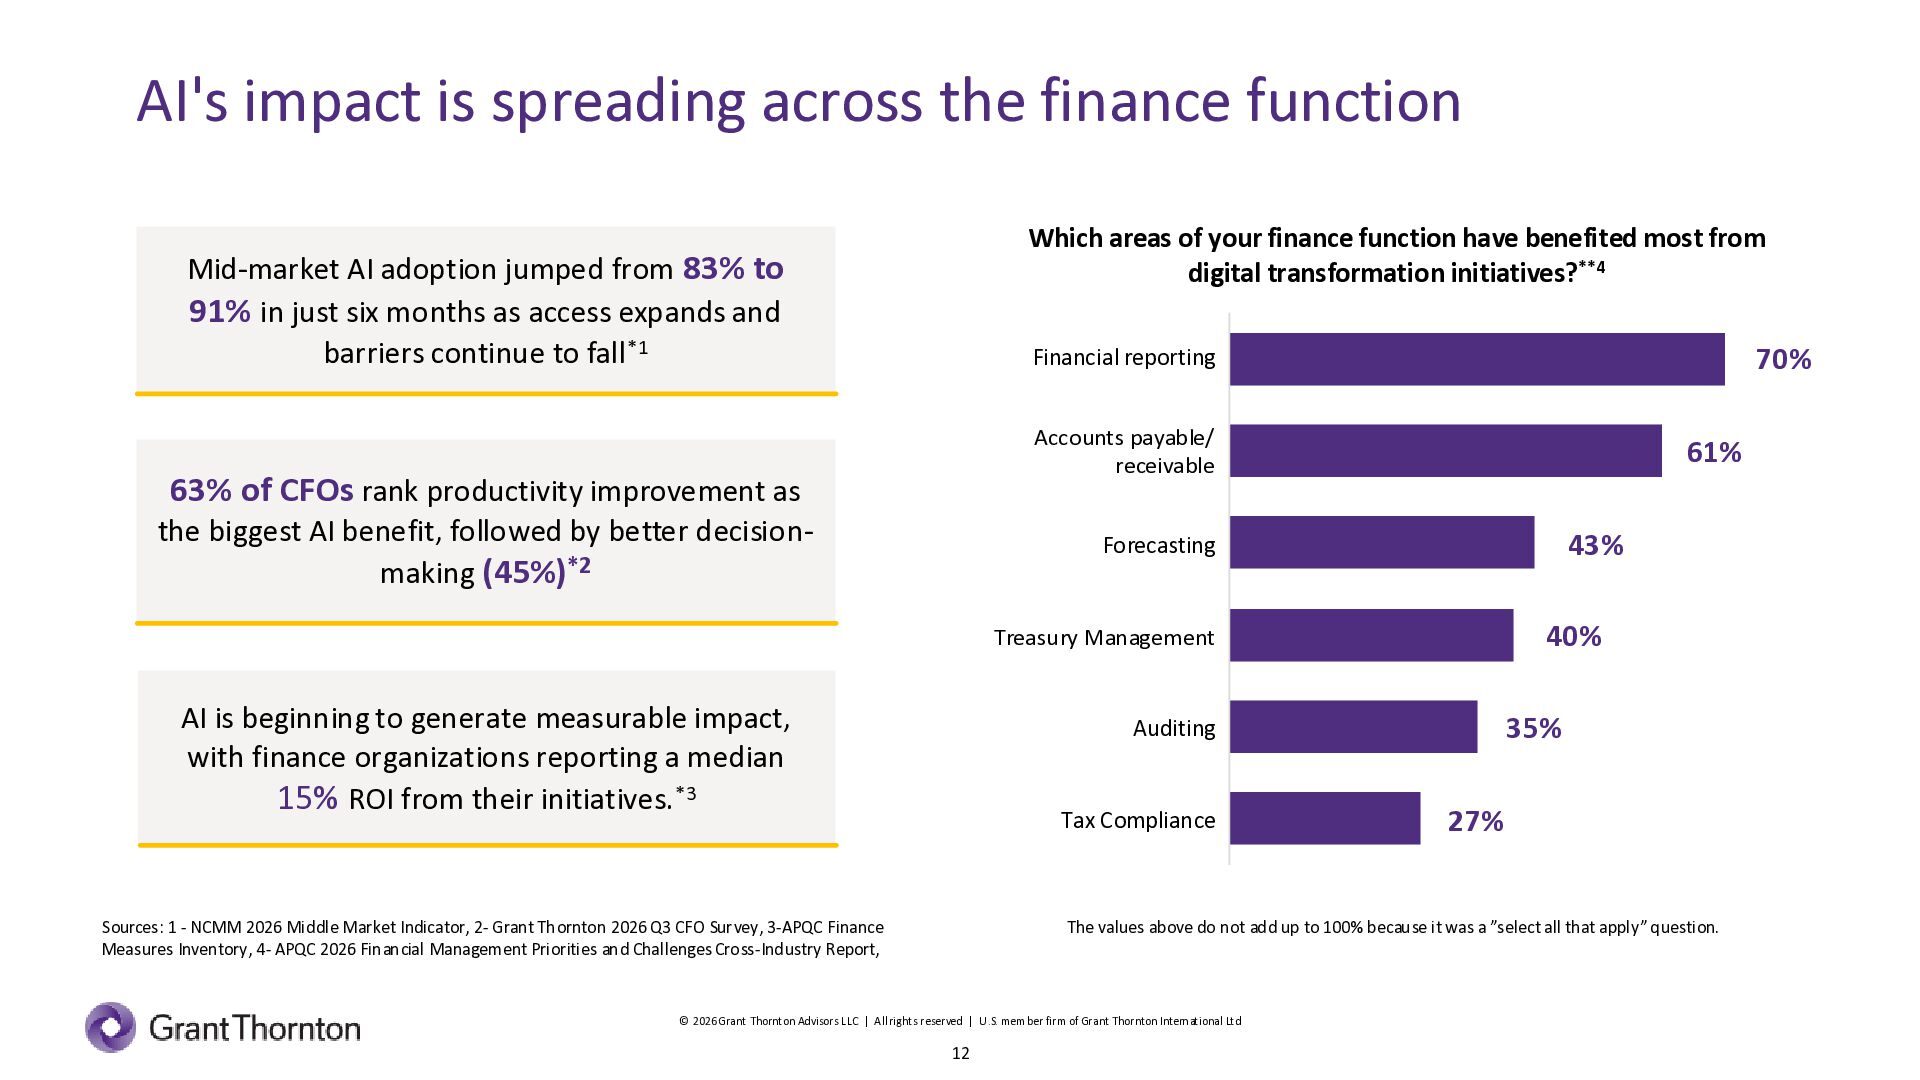
  12. AI's impact is spreading across the finance function Which areas

    of your finance function have benefited most from digital transformation initiatives?**4 Mid-market AI adoption jumped from 83% to 91% in just six months as access expands and barriers continue to fall*1 70% 70 Financial reporting Accounts payable/ receivable 63% of CFOs rank productivity improvement as the biggest AI benefit, followed by better decisionmaking (45%)*2 61% 61 4343% Forecasting 4040% Treasury Management AI is beginning to generate measurable impact, with finance organizations reporting a median 15% ROI from their initiatives.*3 Auditing Tax Compliance Sources: 1 - NCMM 2026 Middle Market Indicator, 2- Grant Thornton 2026 Q3 CFO Survey, 3-APQC Finance Measures Inventory, 4- APQC 2026 Financial Management Priorities and Challenges Cross-Industry Report, 35 35% 27 27% The values above do not add up to 100% because it was a ”select all that apply” question. © 2026 Grant Thornton Advisors LLC | All rights reserved | U .S. member firm of Grant Thornton International Ltd 12
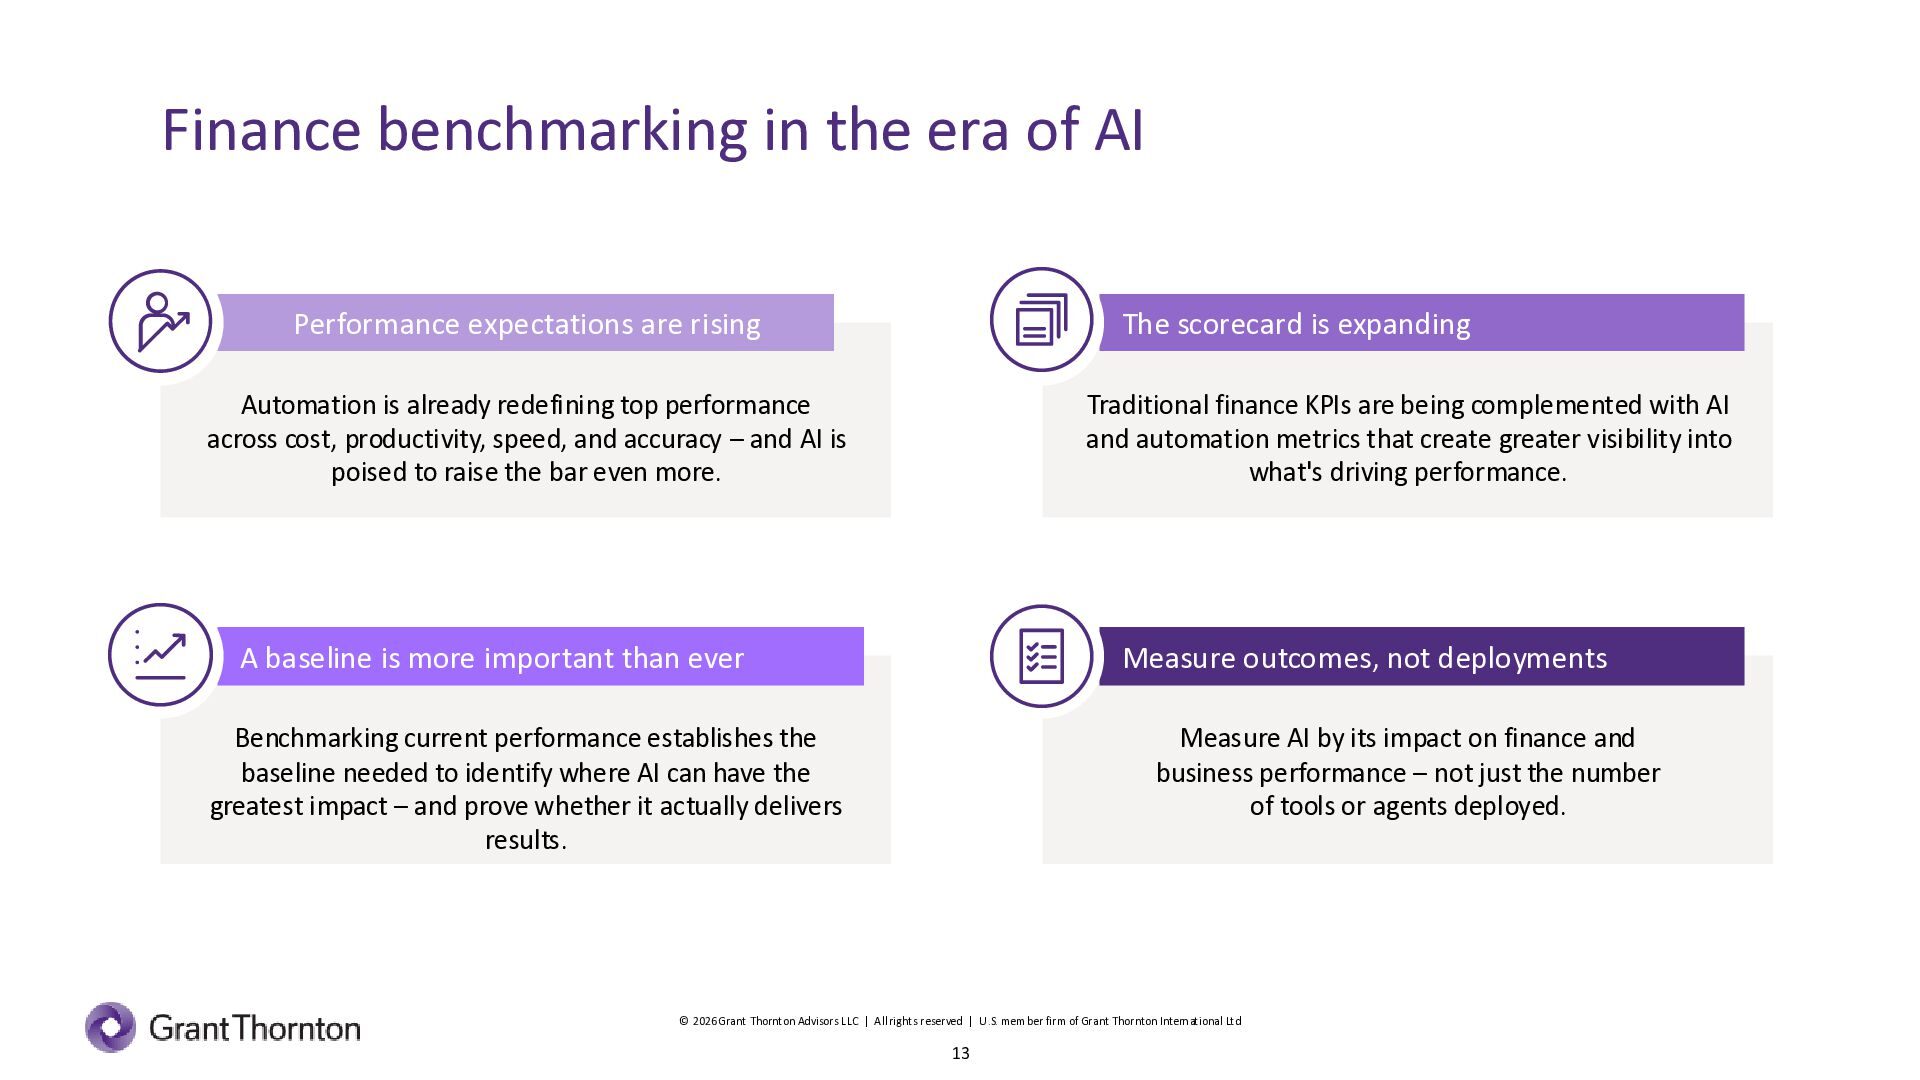
  13. Finance benchmarking in the era of AI Performance expectations are

    rising The scorecard is expanding Automation is already redefining top performance across cost, productivity, speed, and accuracy – and AI is poised to raise the bar even more. Traditional finance KPIs are being complemented with AI and automation metrics that create greater visibility into what's driving performance. A baseline is more important than ever Measure outcomes, not deployments Benchmarking current performance establishes the baseline needed to identify where AI can have the greatest impact – and prove whether it actually delivers results. Measure AI by its impact on finance and business performance – not just the number of tools or agents deployed. © 2026 Grant Thornton Advisors LLC | All rights reserved | U .S. member firm of Grant Thornton International Ltd 13
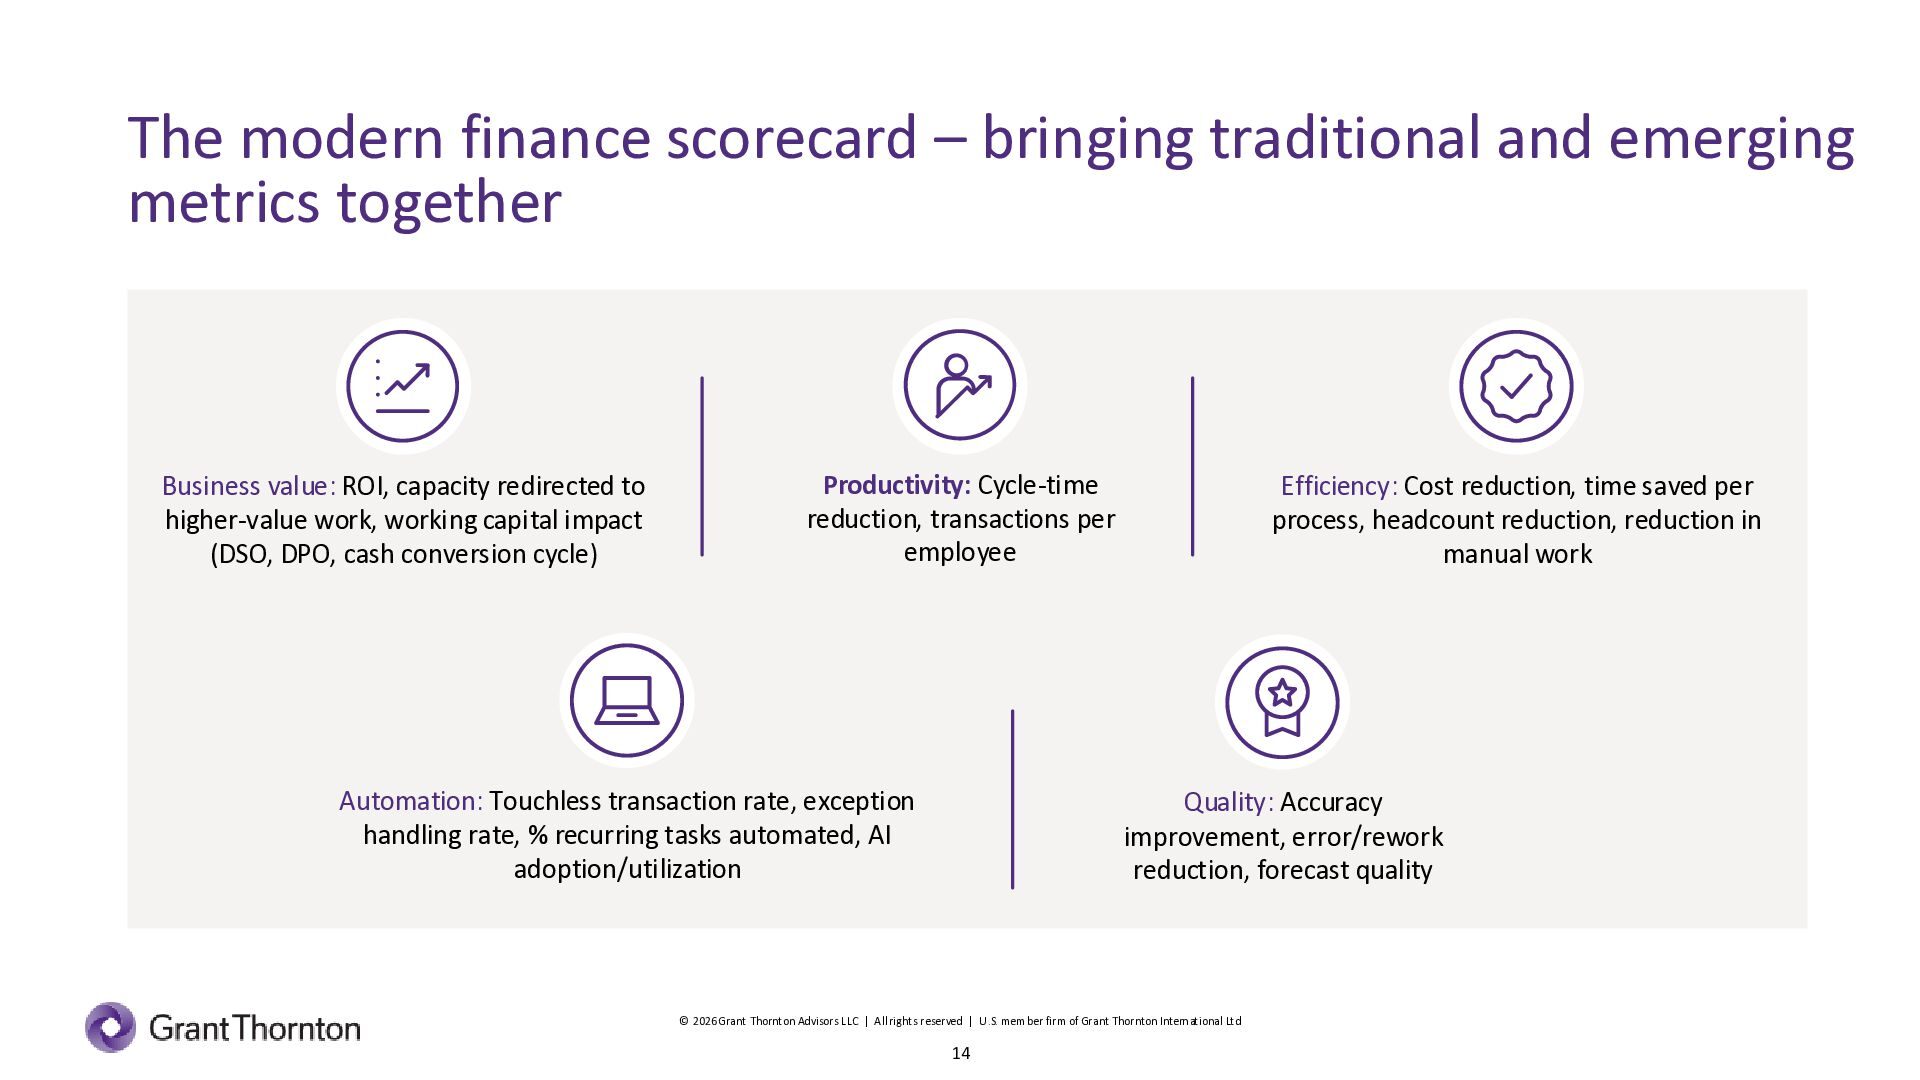
  14. The modern finance scorecard – bringing traditional and emerging metrics

    together Business value: ROI, capacity redirected to higher-value work, working capital impact (DSO, DPO, cash conversion cycle) Productivity: Cycle-time reduction, transactions per employee Automation: Touchless transaction rate, exception handling rate, % recurring tasks automated, AI adoption/utilization Efficiency: Cost reduction, time saved per process, headcount reduction, reduction in manual work Quality: Accuracy improvement, error/rework reduction, forecast quality © 2026 Grant Thornton Advisors LLC | All rights reserved | U .S. member firm of Grant Thornton International Ltd 14
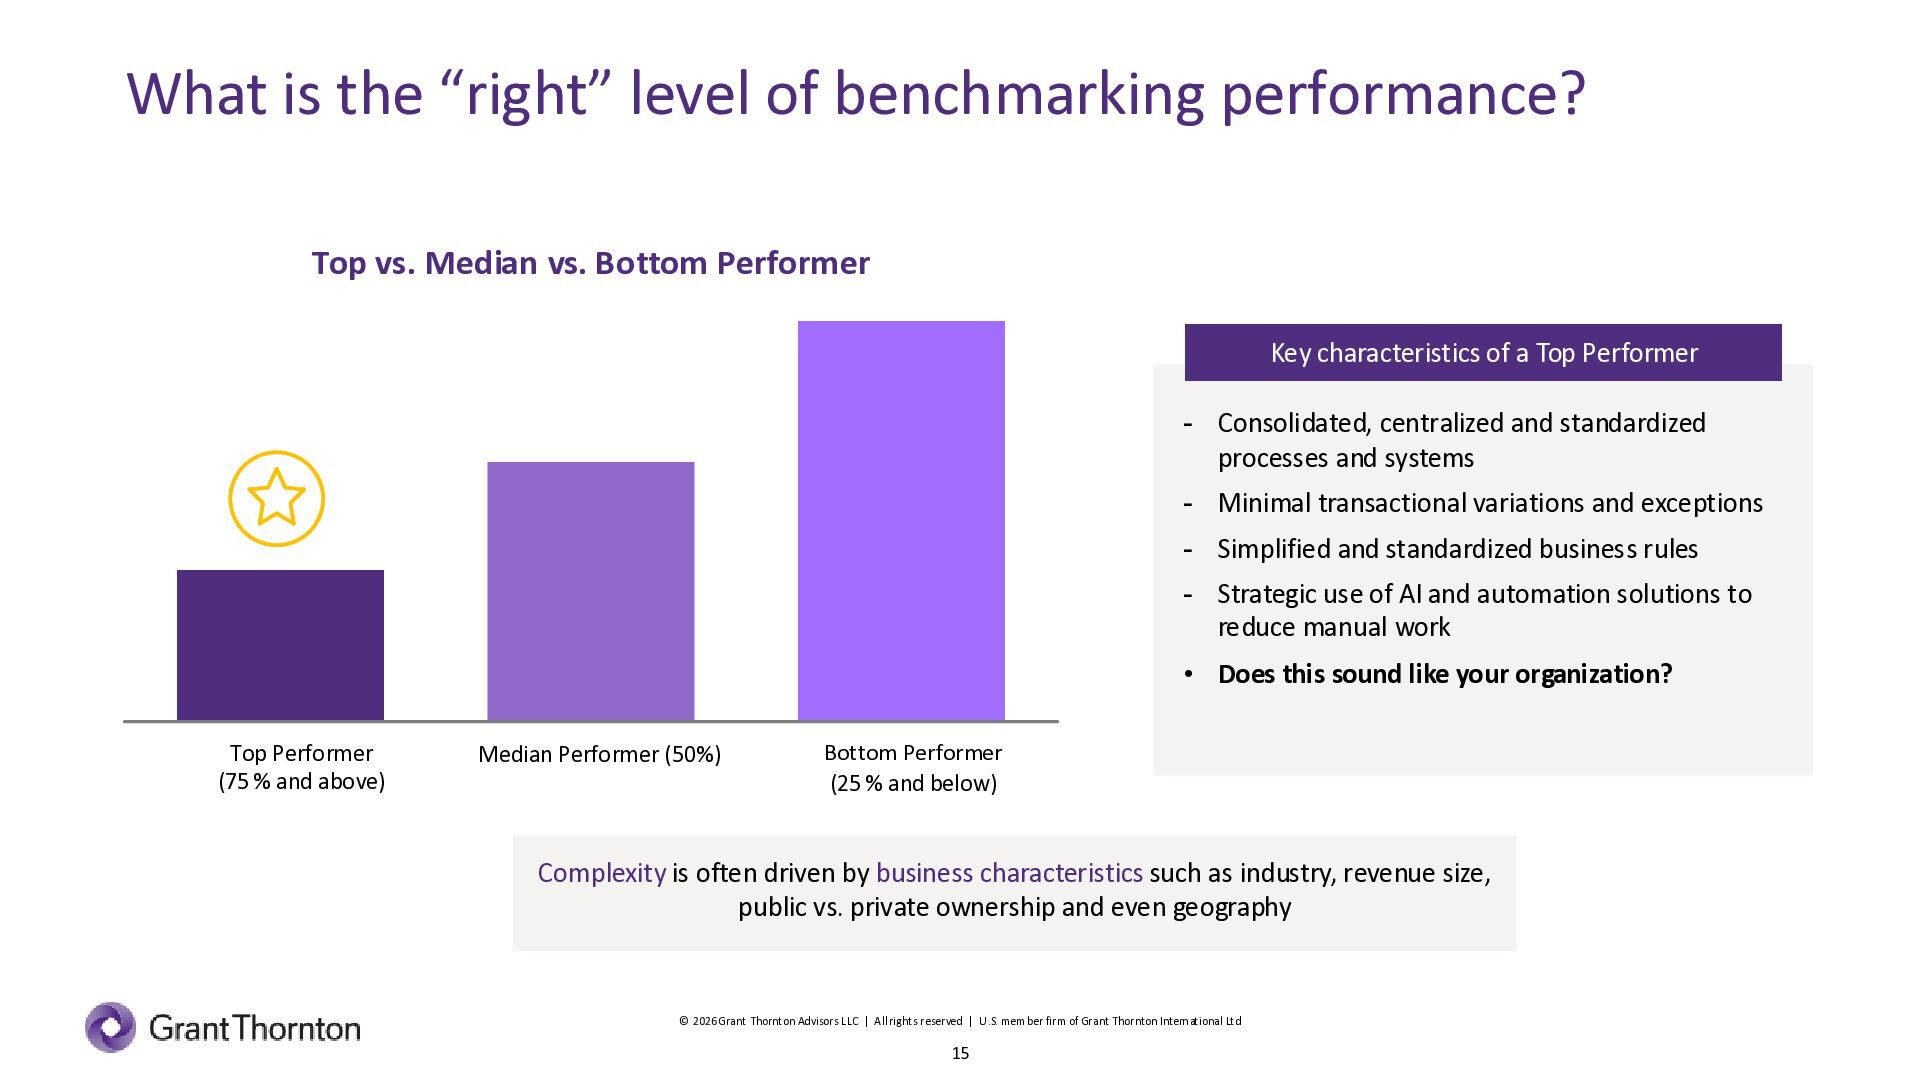
  15. What is the “right” level of benchmarking performance? Top vs.

    Median vs. Bottom Performer Key characteristics of a Top Performer - Consolidated, centralized and standardized processes and systems - Minimal transactional variations and exceptions - Simplified and standardized business rules - Strategic use of AI and automation solutions to reduce manual work • Does this sound like your organization? Top Performer (75 % and above) Median Performer (50%) Bottom Performer (25 % and below) Complexity is often driven by business characteristics such as industry, revenue size, public vs. private ownership and even geography © 2026 Grant Thornton Advisors LLC | All rights reserved | U .S. member firm of Grant Thornton International Ltd 15
  16. How does your finance organization stack up? © 2026 Grant

    Thornton Advisors LLC | All rights reserved | U .S. member firm of Grant Thornton International Ltd 16 16
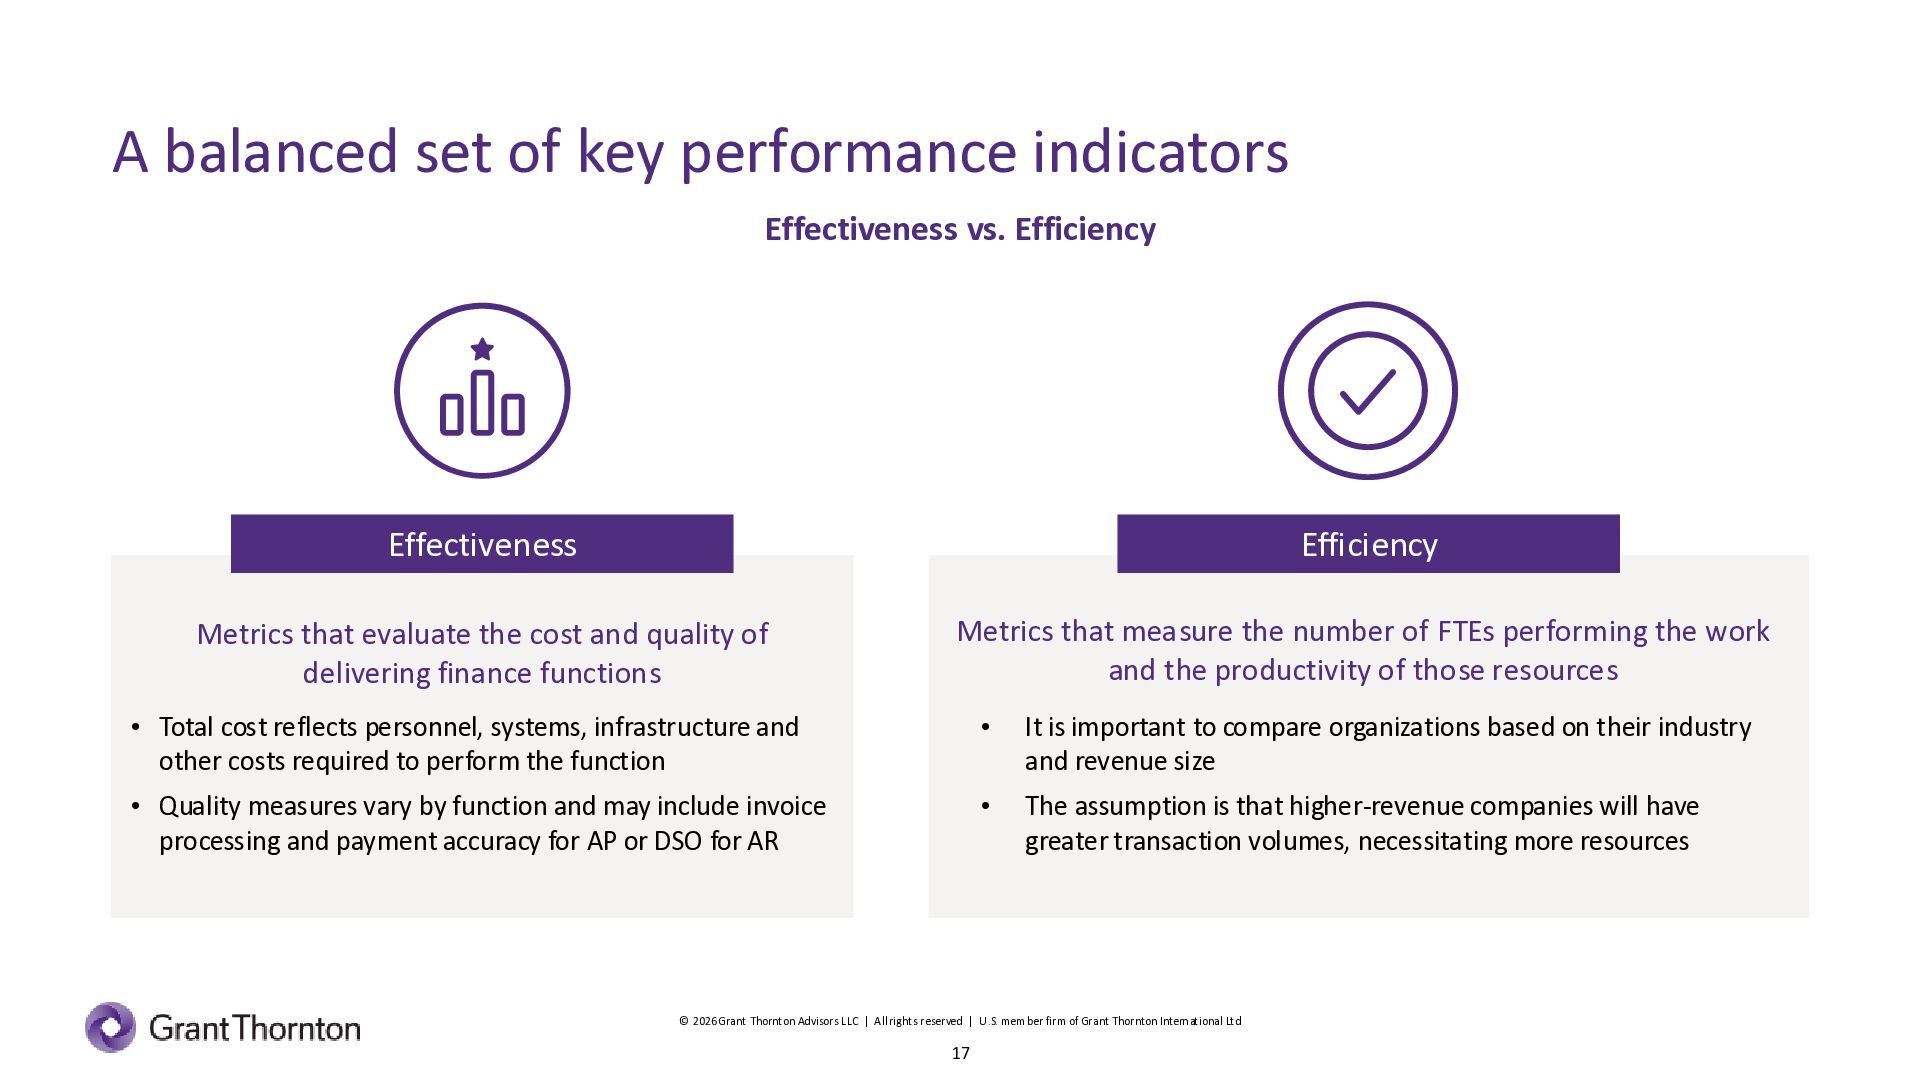
  17. A balanced set of key performance indicators Effectiveness vs. Efficiency

    Effectiveness Efficiency Metrics that evaluate the cost and quality of delivering finance functions Metrics that measure the number of FTEs performing the work and the productivity of those resources • Total cost reflects personnel, systems, infrastructure and other costs required to perform the function • It is important to compare organizations based on their industry and revenue size • Quality measures vary by function and may include invoice processing and payment accuracy for AP or DSO for AR • The assumption is that higher-revenue companies will have greater transaction volumes, necessitating more resources © 2026 Grant Thornton Advisors LLC | All rights reserved | U .S. member firm of Grant Thornton International Ltd 17
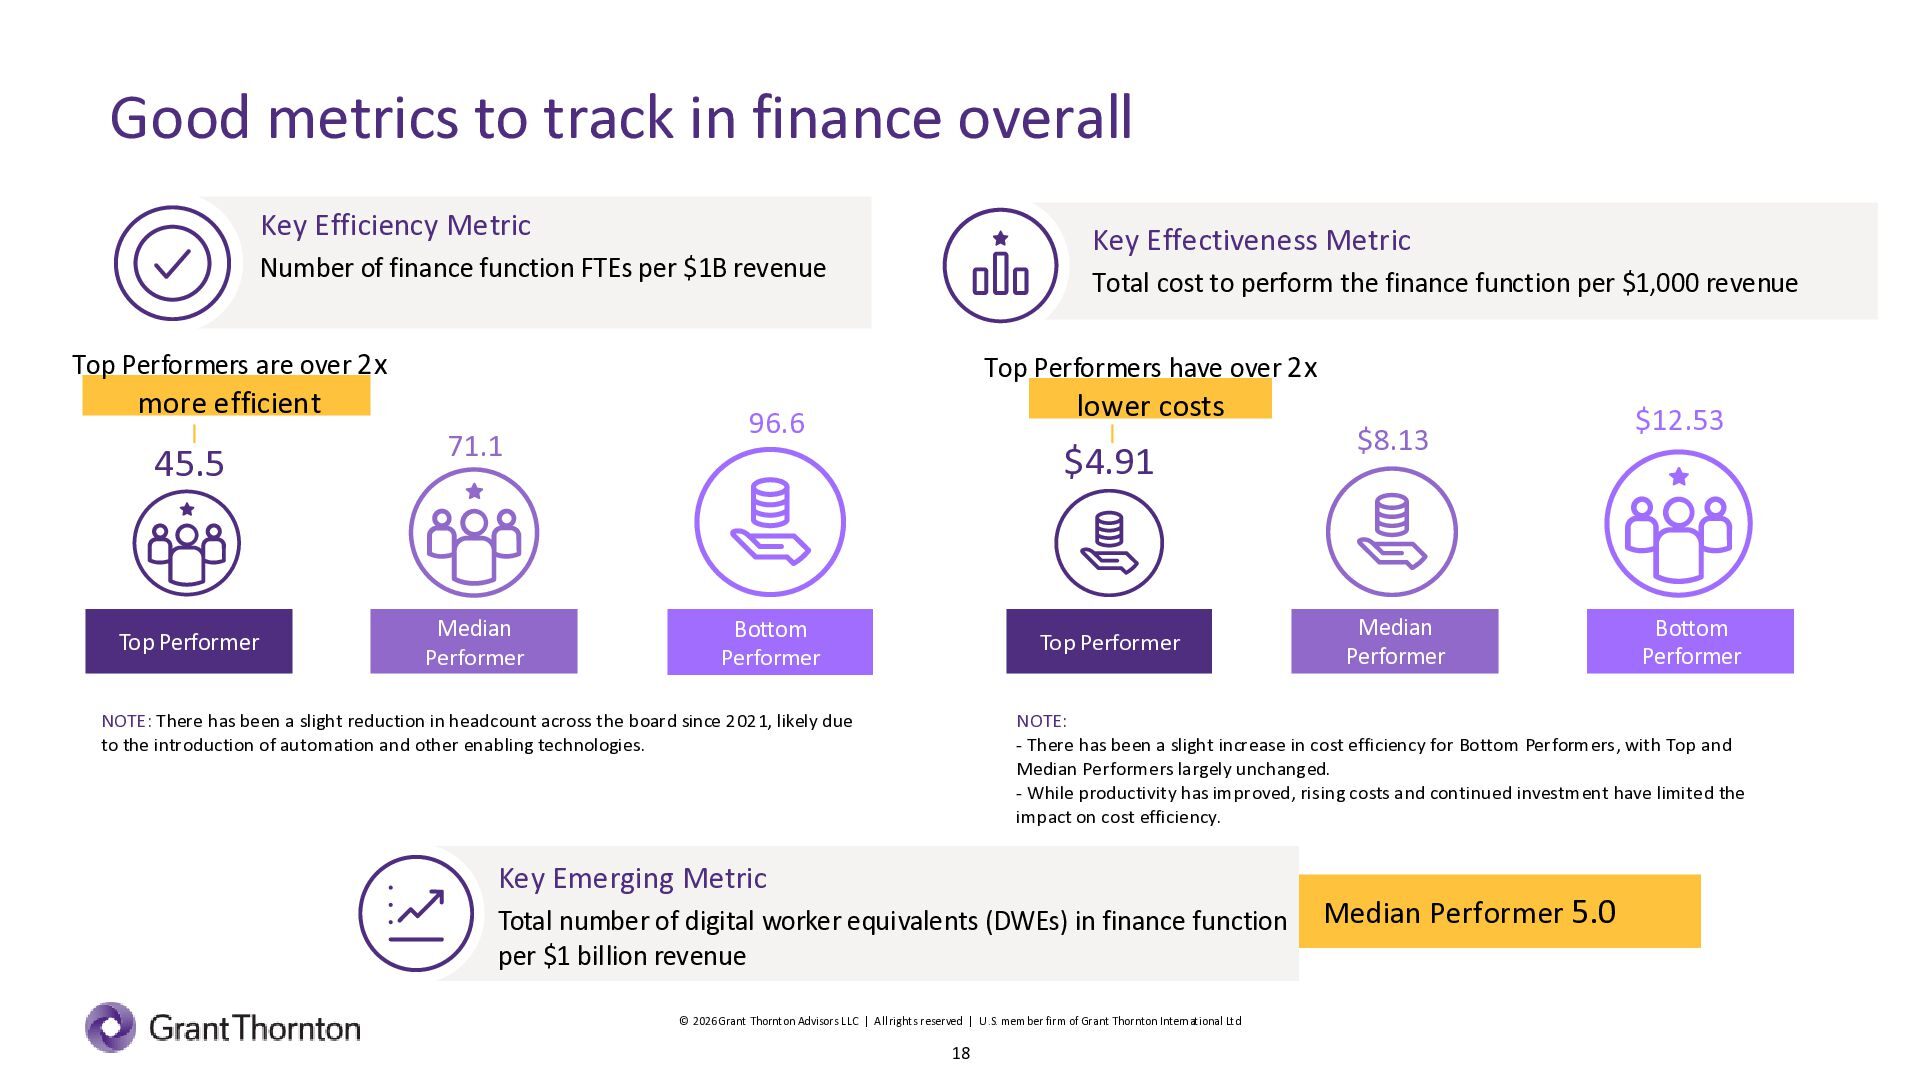
  18. Good metrics to track in finance overall Key Efficiency Metric

    Key Effectiveness Metric Number of finance function FTEs per $1B revenue Total cost to perform the finance function per $1,000 revenue Top Performers are over 2x Top Performers have over 2x more efficient 45.5 Top Performer 71.1 Median Performer lower costs 96.6 $4.91 Bottom Performer Top Performer NOTE: There has been a slight reduction in headcount across the board since 2021, likely due to the introduction of automation and other enabling technologies. $8.13 Median Performer $12.53 Bottom Performer NOTE: - There has been a slight increase in cost efficiency for Bottom Performers, with Top and Median Performers largely unchanged. - While productivity has improved, rising costs and continued investment have limited the impact on cost efficiency. Key Emerging Metric Total number of digital worker equivalents (DWEs) in finance function per $1 billion revenue © 2026 Grant Thornton Advisors LLC | All rights reserved | U .S. member firm of Grant Thornton International Ltd 18 Median Performer 5.0
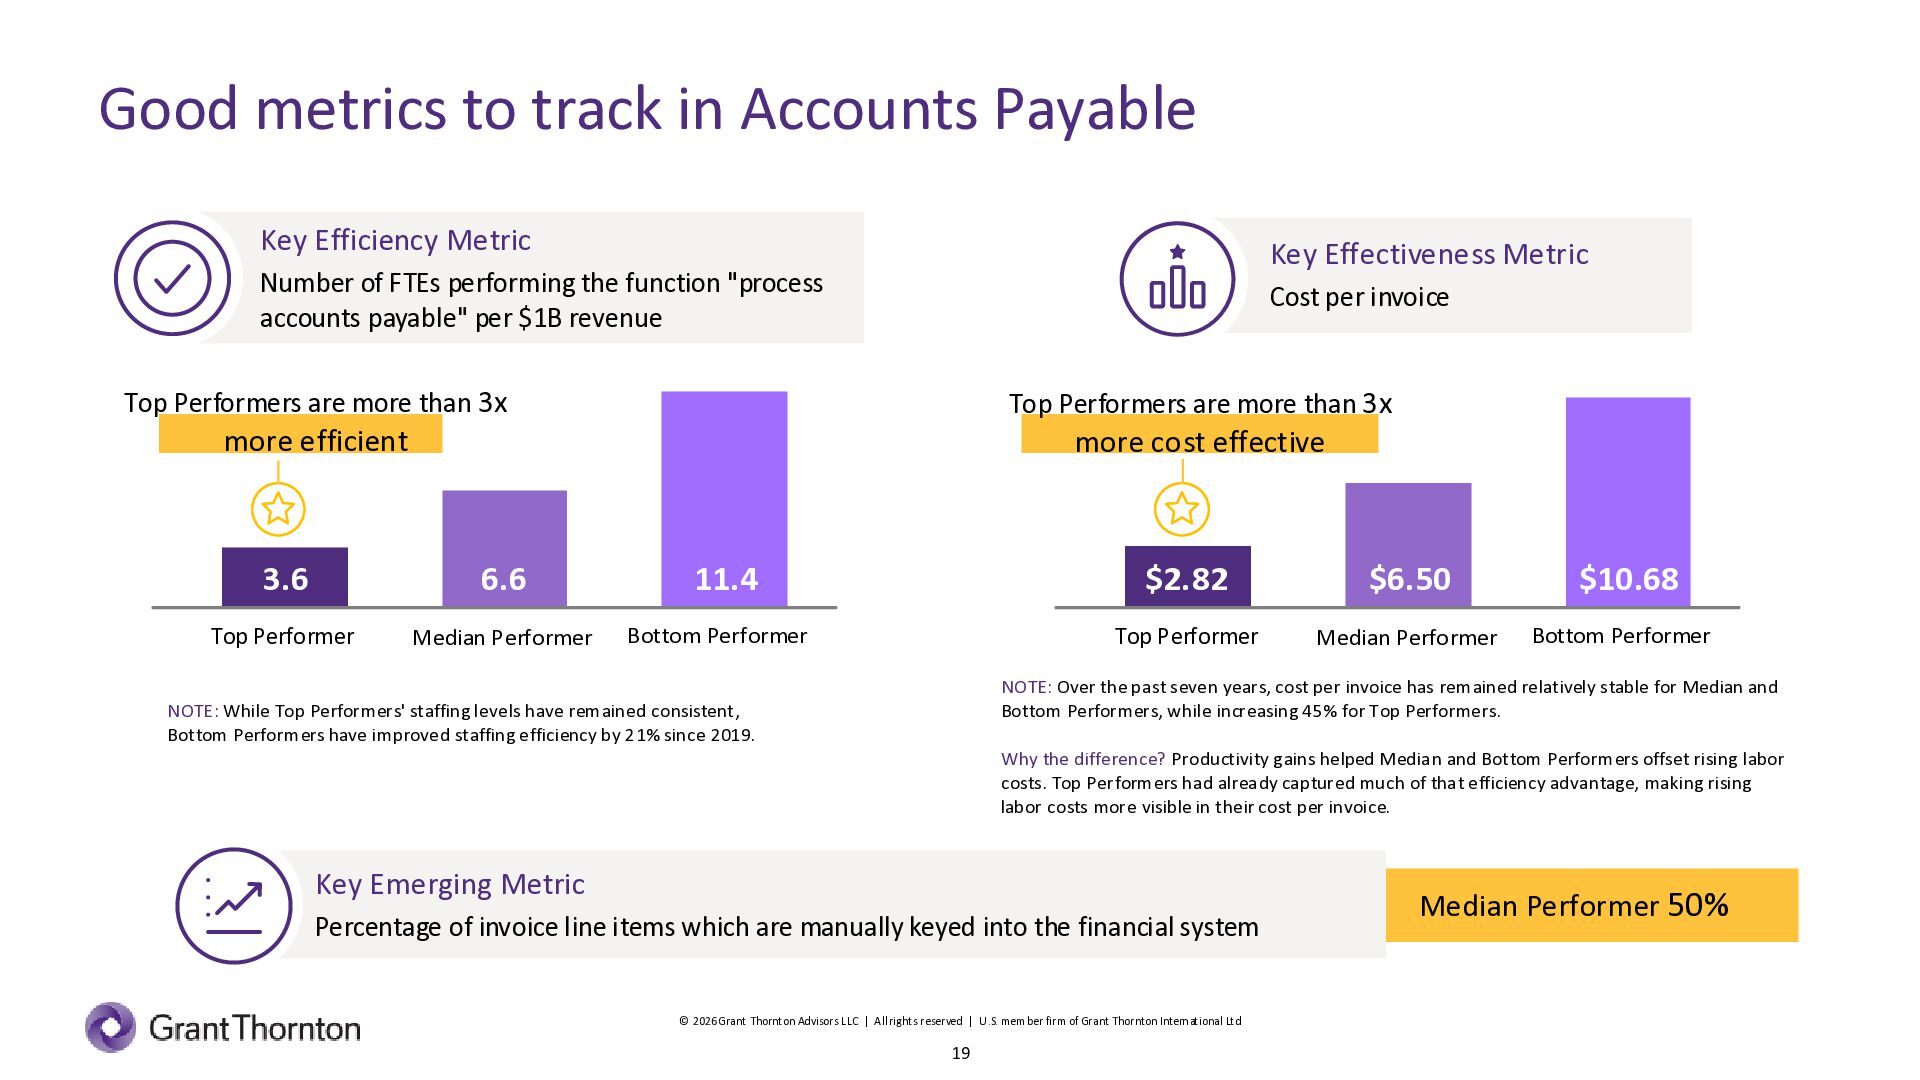
  19. Good metrics to track in Accounts Payable Key Efficiency Metric

    Key Effectiveness Metric Number of FTEs performing the function "process accounts payable" per $1B revenue Cost per invoice Top Performers are more than 3x Top Performers are more than 3x more efficient more cost effective 3.6 6.6 11.4 $2.82 $6.50 $10.68 Top Performer Median Performer Bottom Performer Top Performer Median Performer Bottom Performer NOTE: Over the past seven years, cost per invoice has remained relatively stable for Median and Bottom Performers, while increasing 45% for Top Performers. NOTE: While Top Performers' staffing levels have remained consistent, Bottom Performers have improved staffing efficiency by 21% since 2019. Why the difference? Productivity gains helped Median and Bottom Performers offset rising labor costs. Top Performers had already captured much of that efficiency advantage, making rising labor costs more visible in their cost per invoice. Key Emerging Metric Percentage of invoice line items which are manually keyed into the financial system © 2026 Grant Thornton Advisors LLC | All rights reserved | U .S. member firm of Grant Thornton International Ltd 19 Median Performer 50%
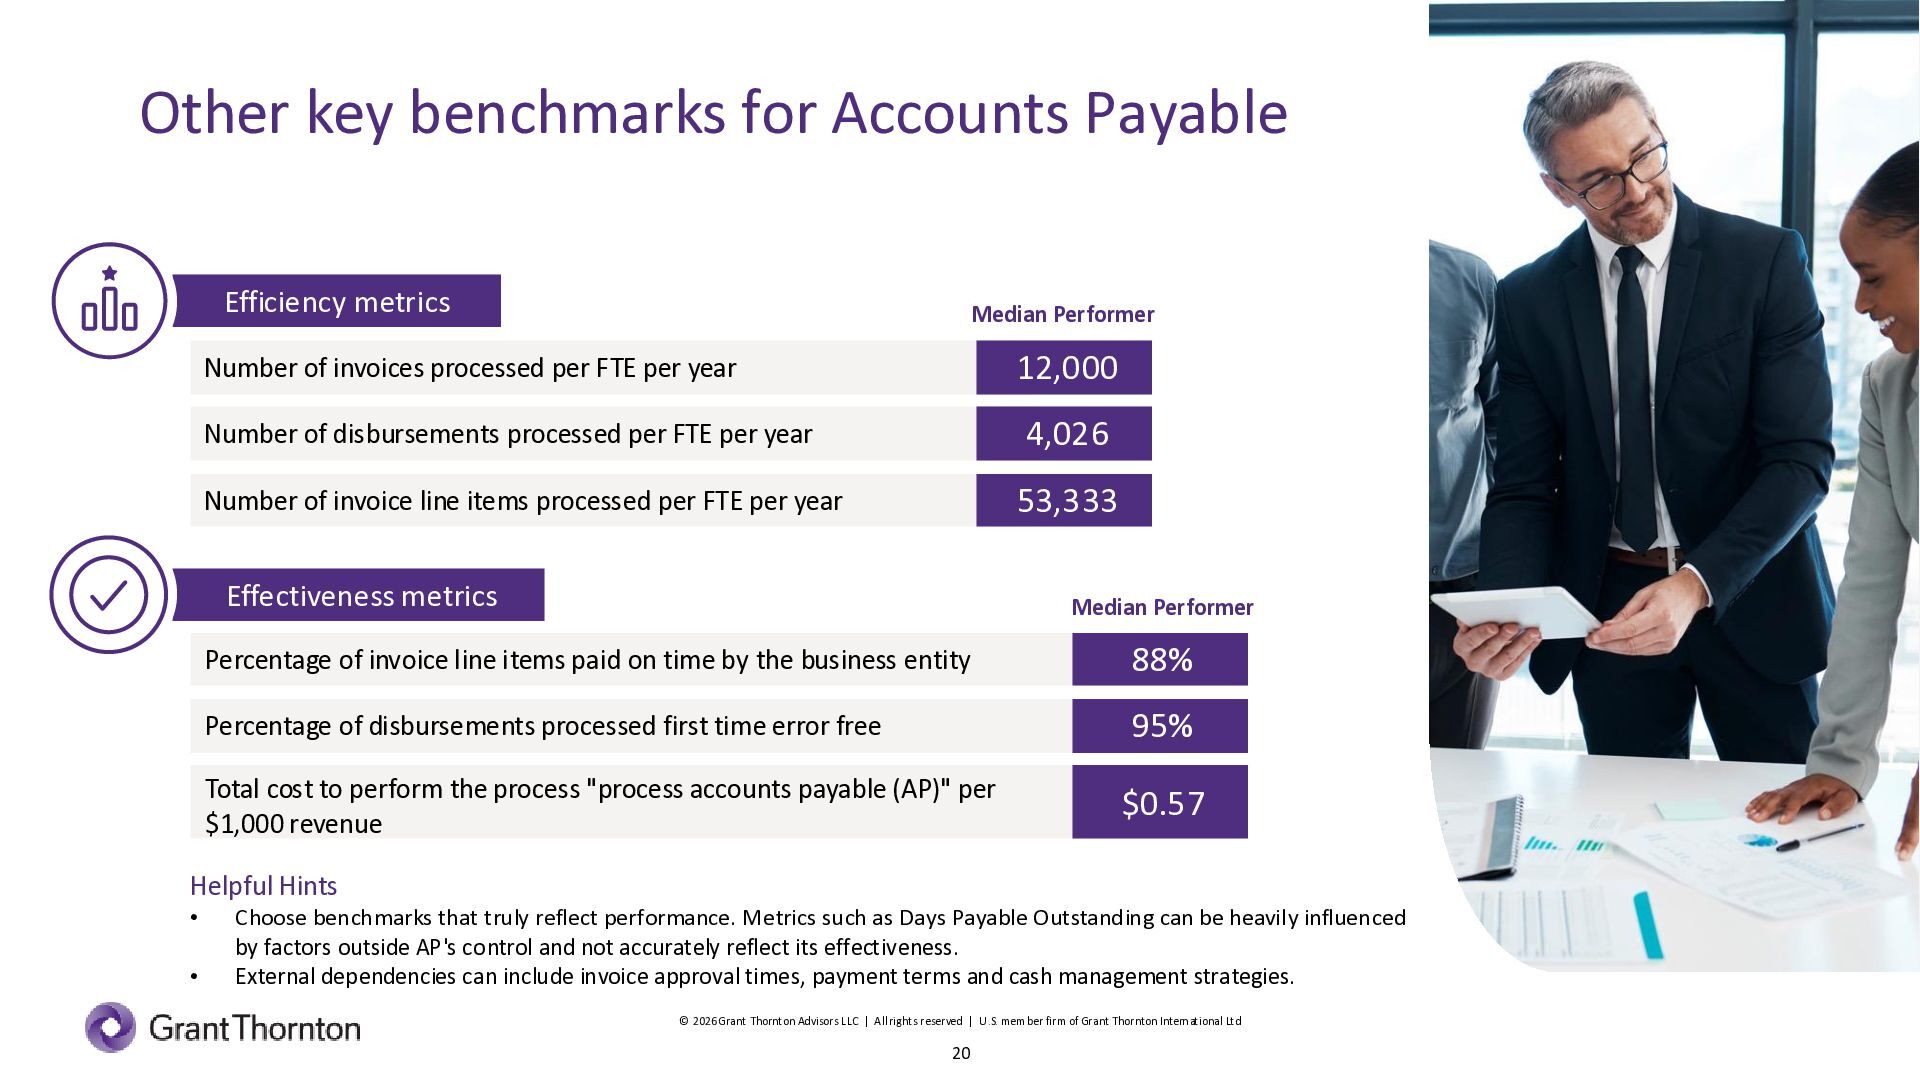
  20. Other key benchmarks for Accounts Payable Efficiency metrics Median Performer

    Number of invoices processed per FTE per year 12,000 Number of disbursements processed per FTE per year 4,026 Number of invoice line items processed per FTE per year 53,333 Effectiveness metrics Median Performer Percentage of invoice line items paid on time by the business entity 88% Percentage of disbursements processed first time error free​ 95% Total cost to perform the process "process accounts payable (AP)" per $1,000 revenue $0.57 Helpful Hints • • Choose benchmarks that truly reflect performance. Metrics such as Days Payable Outstanding can be heavily influenced by factors outside AP's control and not accurately reflect its effectiveness. External dependencies can include invoice approval times, payment terms and cash management strategies. © 2026 Grant Thornton Advisors LLC | All rights reserved | U .S. member firm of Grant Thornton International Ltd 20
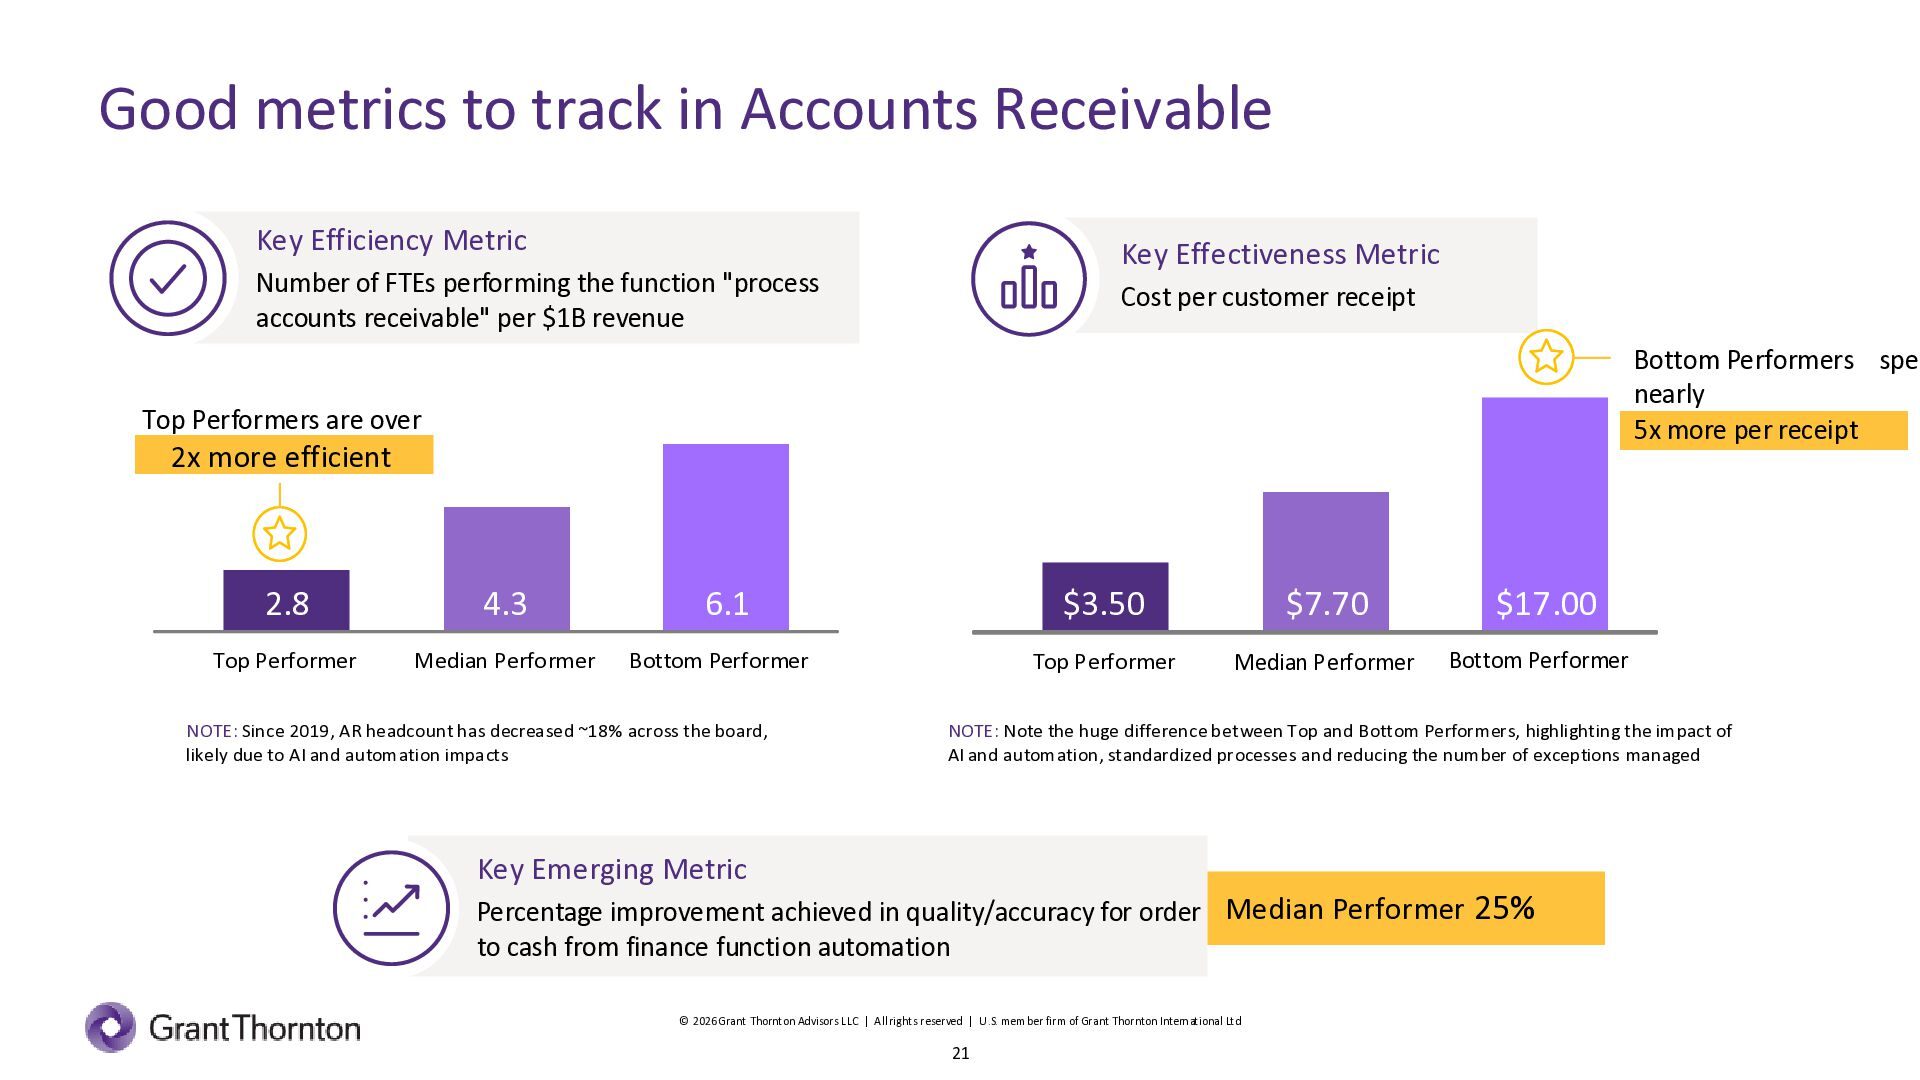
  21. Good metrics to track in Accounts Receivable Key Efficiency Metric

    Key Effectiveness Metric Number of FTEs performing the function "process accounts receivable" per $1B revenue Cost per customer receipt Bottom Performers spen nearly 5x more per receipt Top Performers are over 2x more efficient 2.8 4.3 6.1 $3.50 $7.70 $17.00 Top Performer Median Performer Bottom Performer Top Performer Median Performer Bottom Performer NOTE: Since 2019, AR headcount has decreased ~18% across the board, likely due to AI and automation impacts NOTE: Note the huge difference between Top and Bottom Performers, highlighting the impact of AI and automation, standardized processes and reducing the number of exceptions managed Key Emerging Metric Percentage improvement achieved in quality/accuracy for order Median Performer 25% to cash from finance function automation © 2026 Grant Thornton Advisors LLC | All rights reserved | U .S. member firm of Grant Thornton International Ltd 21
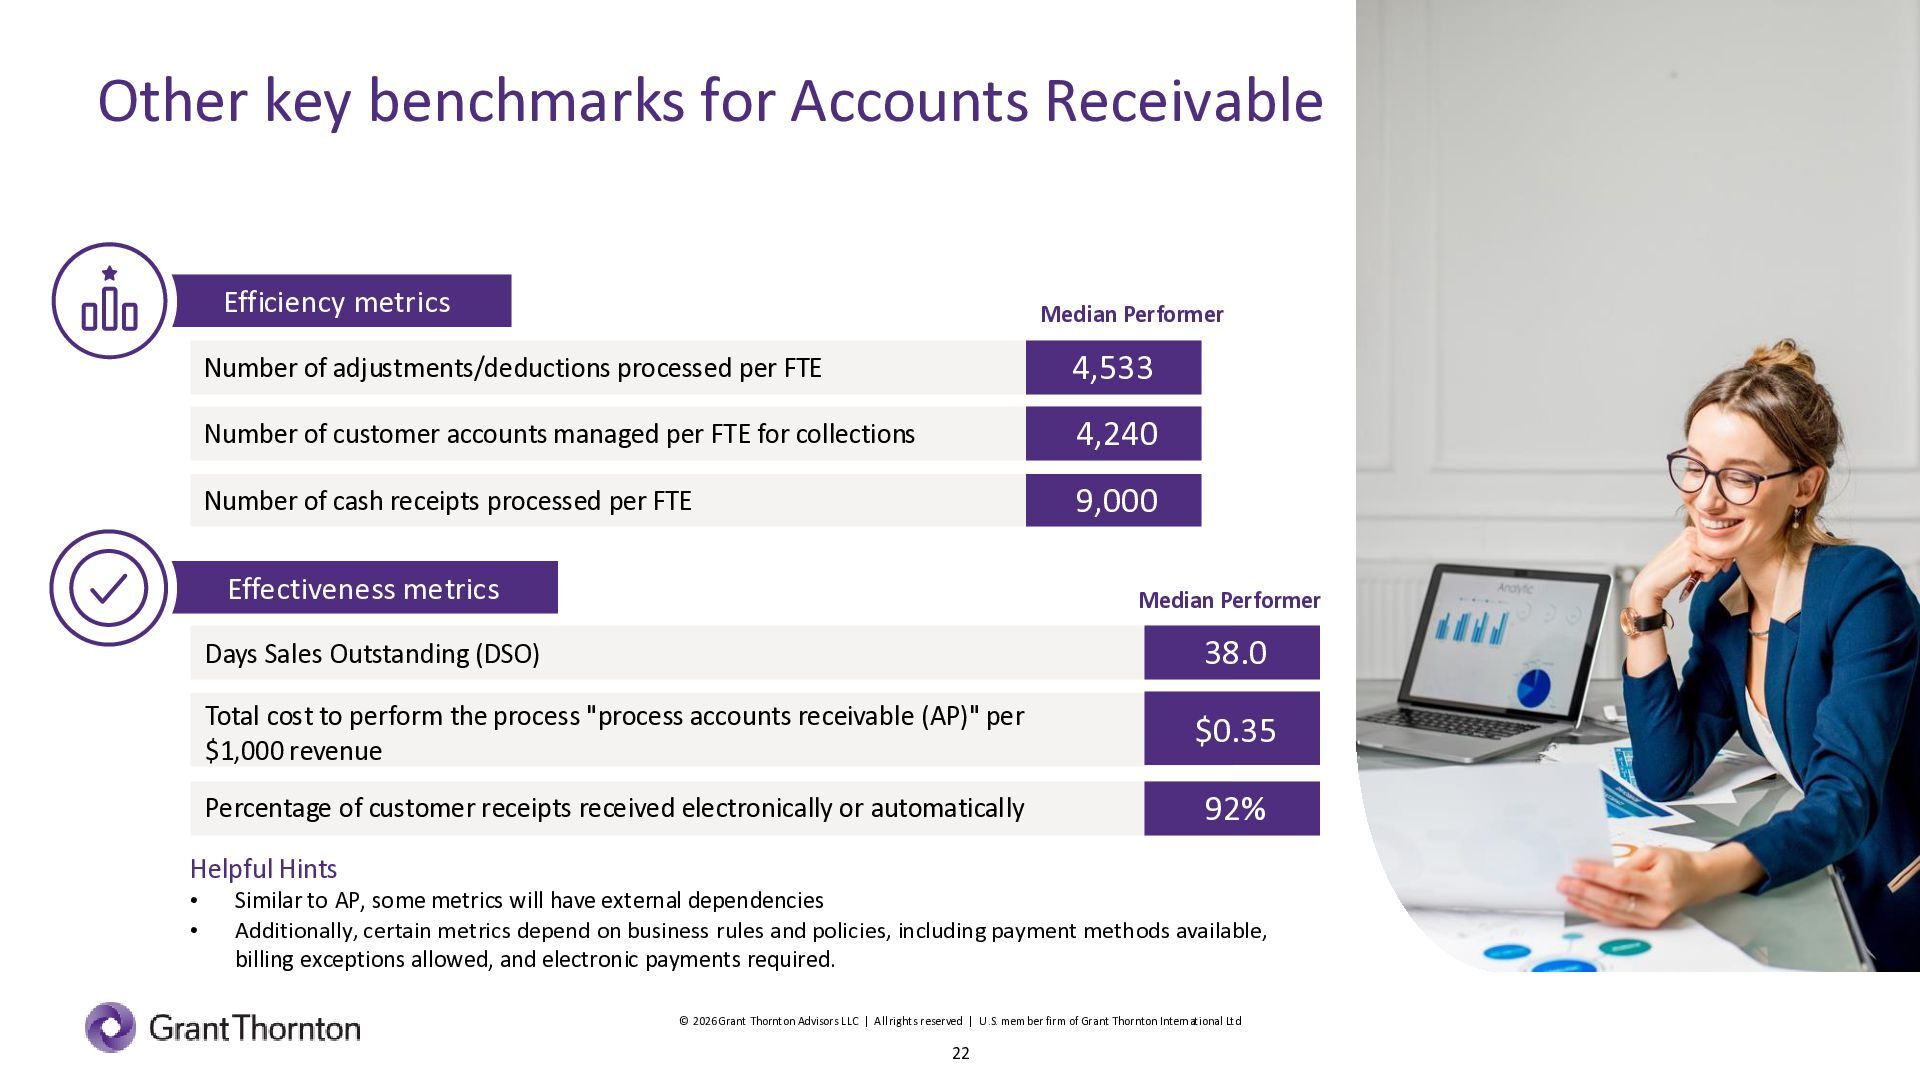
  22. Other key benchmarks for Accounts Receivable Efficiency metrics Median Performer

    Number of adjustments/deductions processed per FTE 4,533 Number of customer accounts managed per FTE for collections​ 4,240 Number of cash receipts processed per FTE 9,000 Effectiveness metrics Median Performer Days Sales Outstanding (DSO) 38.0 Total cost to perform the process "process accounts receivable (AP)" per $1,000 revenue $0.35 Percentage of customer receipts received electronically or automatically 92% Helpful Hints • • Similar to AP, some metrics will have external dependencies Additionally, certain metrics depend on business rules and policies, including payment methods available, billing exceptions allowed, and electronic payments required. © 2026 Grant Thornton Advisors LLC | All rights reserved | U .S. member firm of Grant Thornton International Ltd 22
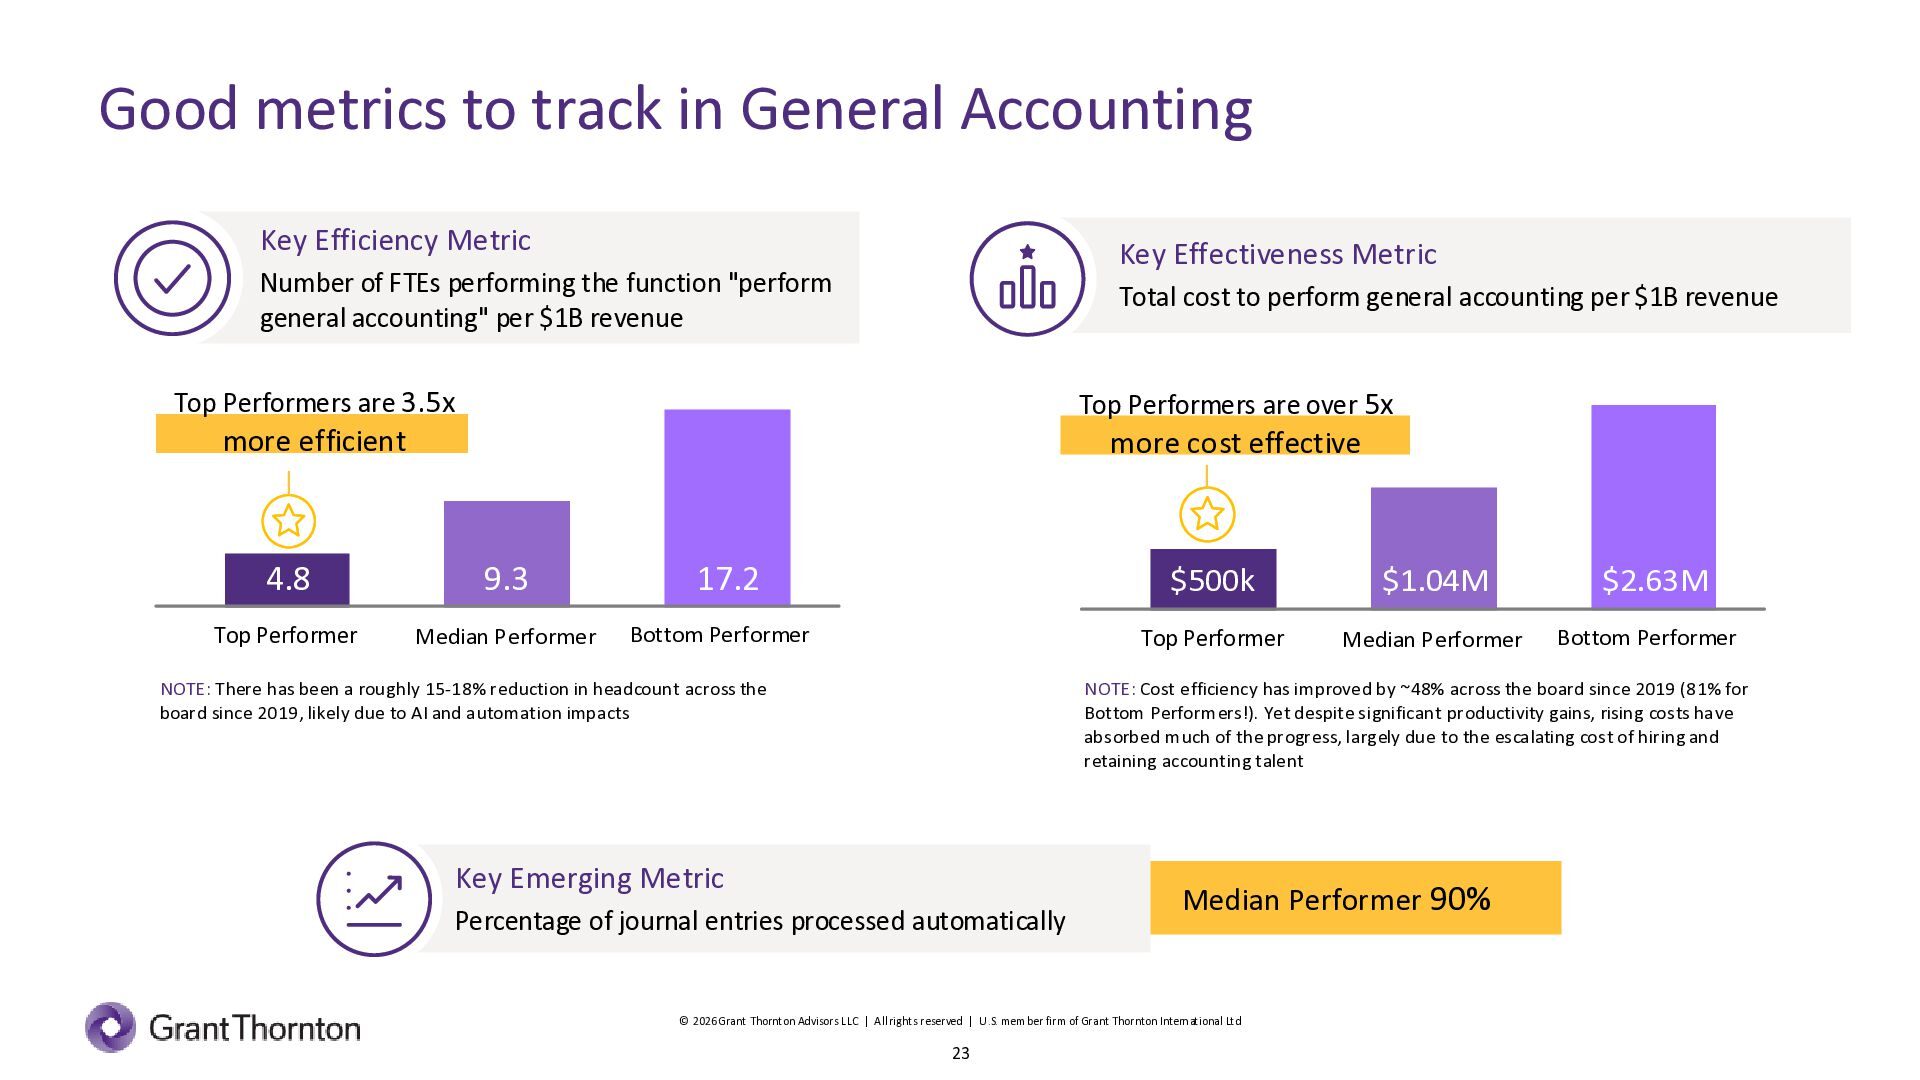
  23. Good metrics to track in General Accounting Key Efficiency Metric

    Key Effectiveness Metric Number of FTEs performing the function "perform general accounting" per $1B revenue Total cost to perform general accounting per $1B revenue Top Performers are 3.5x Top Performers are over 5x more efficient more cost effective 4.8 9.3 17.2 $500k $1.04M $2.63M Top Performer Median Performer Bottom Performer Top Performer Median Performer Bottom Performer NOTE: There has been a roughly 15-18% reduction in headcount across the board since 2019, likely due to AI and automation impacts NOTE: Cost efficiency has improved by ~48% across the board since 2019 (81% for Bottom Performers!). Yet despite significant productivity gains, rising costs have absorbed much of the progress, largely due to the escalating cost of hiring and retaining accounting talent Key Emerging Metric Percentage of journal entries processed automatically Median Performer 90% © 2026 Grant Thornton Advisors LLC | All rights reserved | U .S. member firm of Grant Thornton International Ltd 23
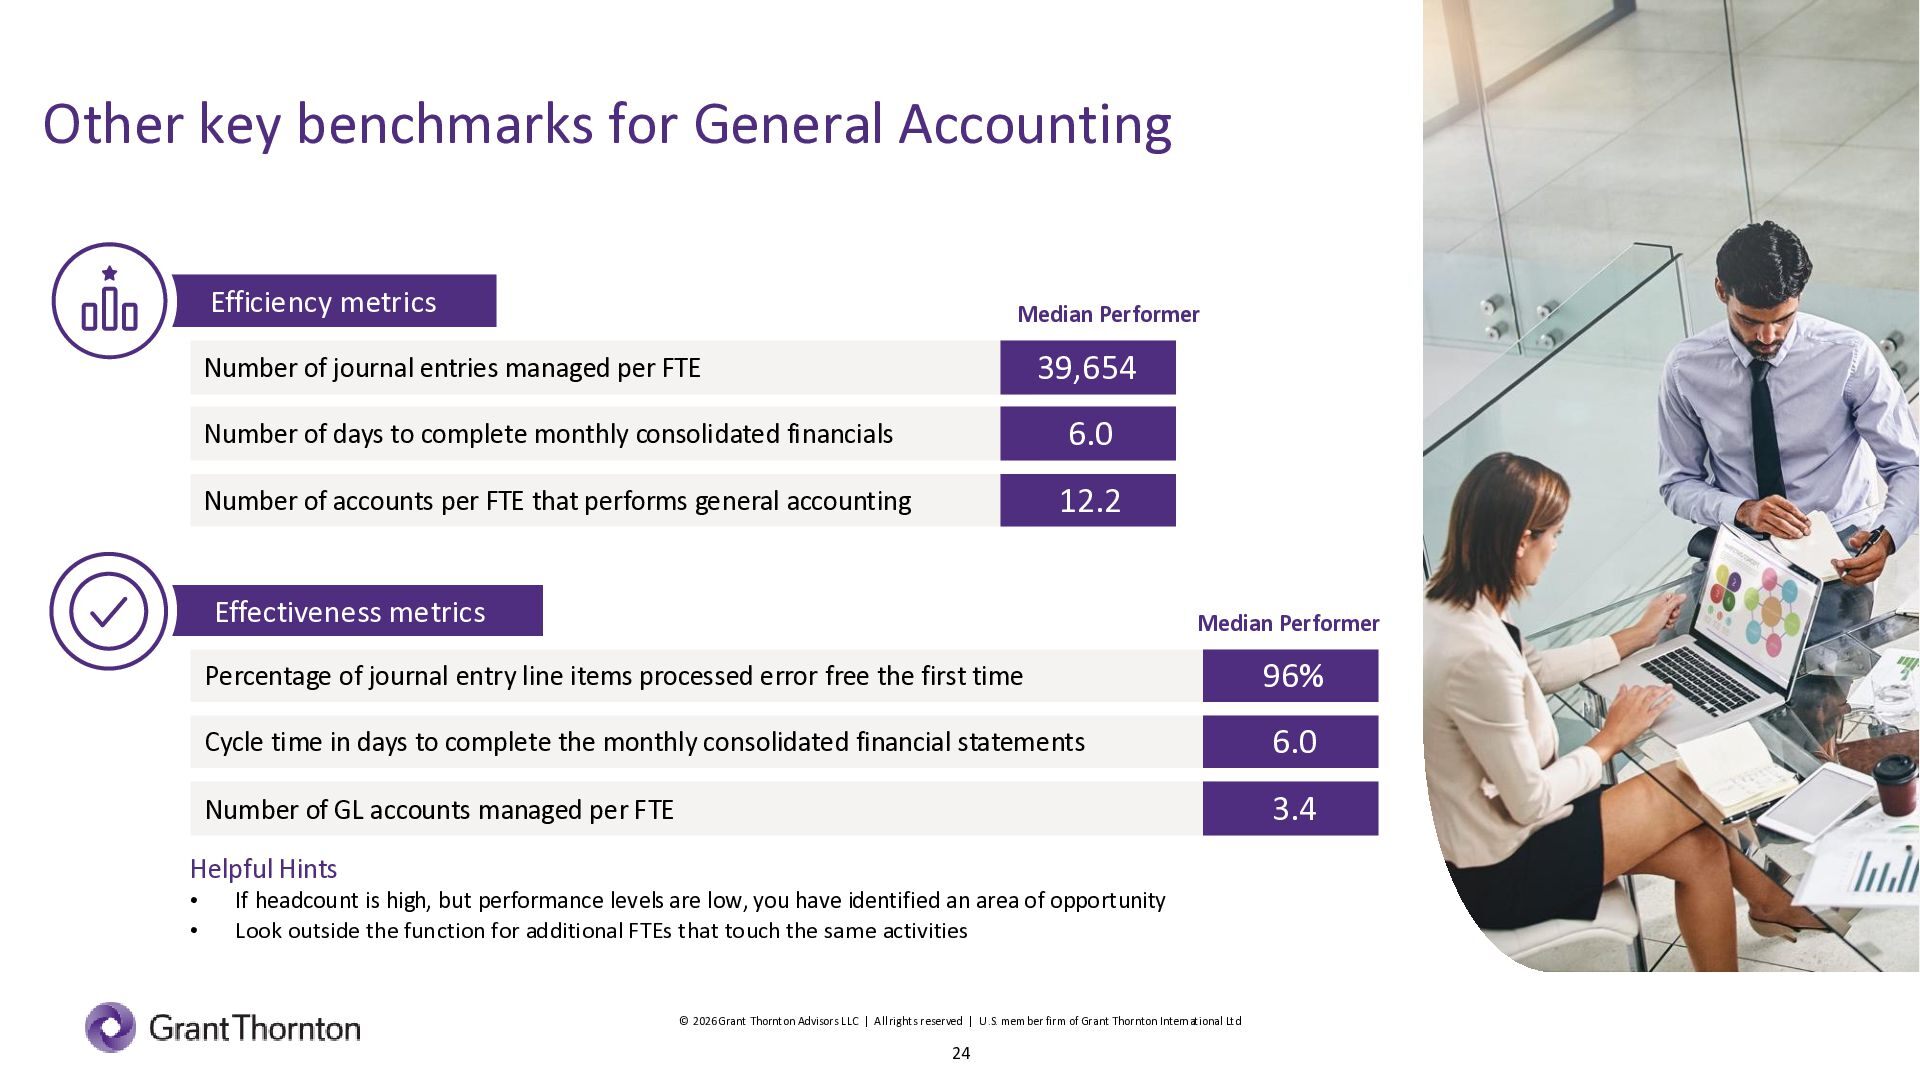
  24. Other key benchmarks for General Accounting Efficiency metrics Median Performer

    39,654 Number of journal entries managed per FTE Number of days to complete monthly consolidated financials 6.0 Number of accounts per FTE that performs general accounting 12.2 Effectiveness metrics Median Performer Percentage of journal entry line items processed error free the first time 96% Cycle time in days to complete the monthly consolidated financial statements 6.0 Number of GL accounts managed per FTE 3.4 Helpful Hints • • If headcount is high, but performance levels are low, you have identified an area of opportunity Look outside the function for additional FTEs that touch the same activities © 2026 Grant Thornton Advisors LLC | All rights reserved | U .S. member firm of Grant Thornton International Ltd 24
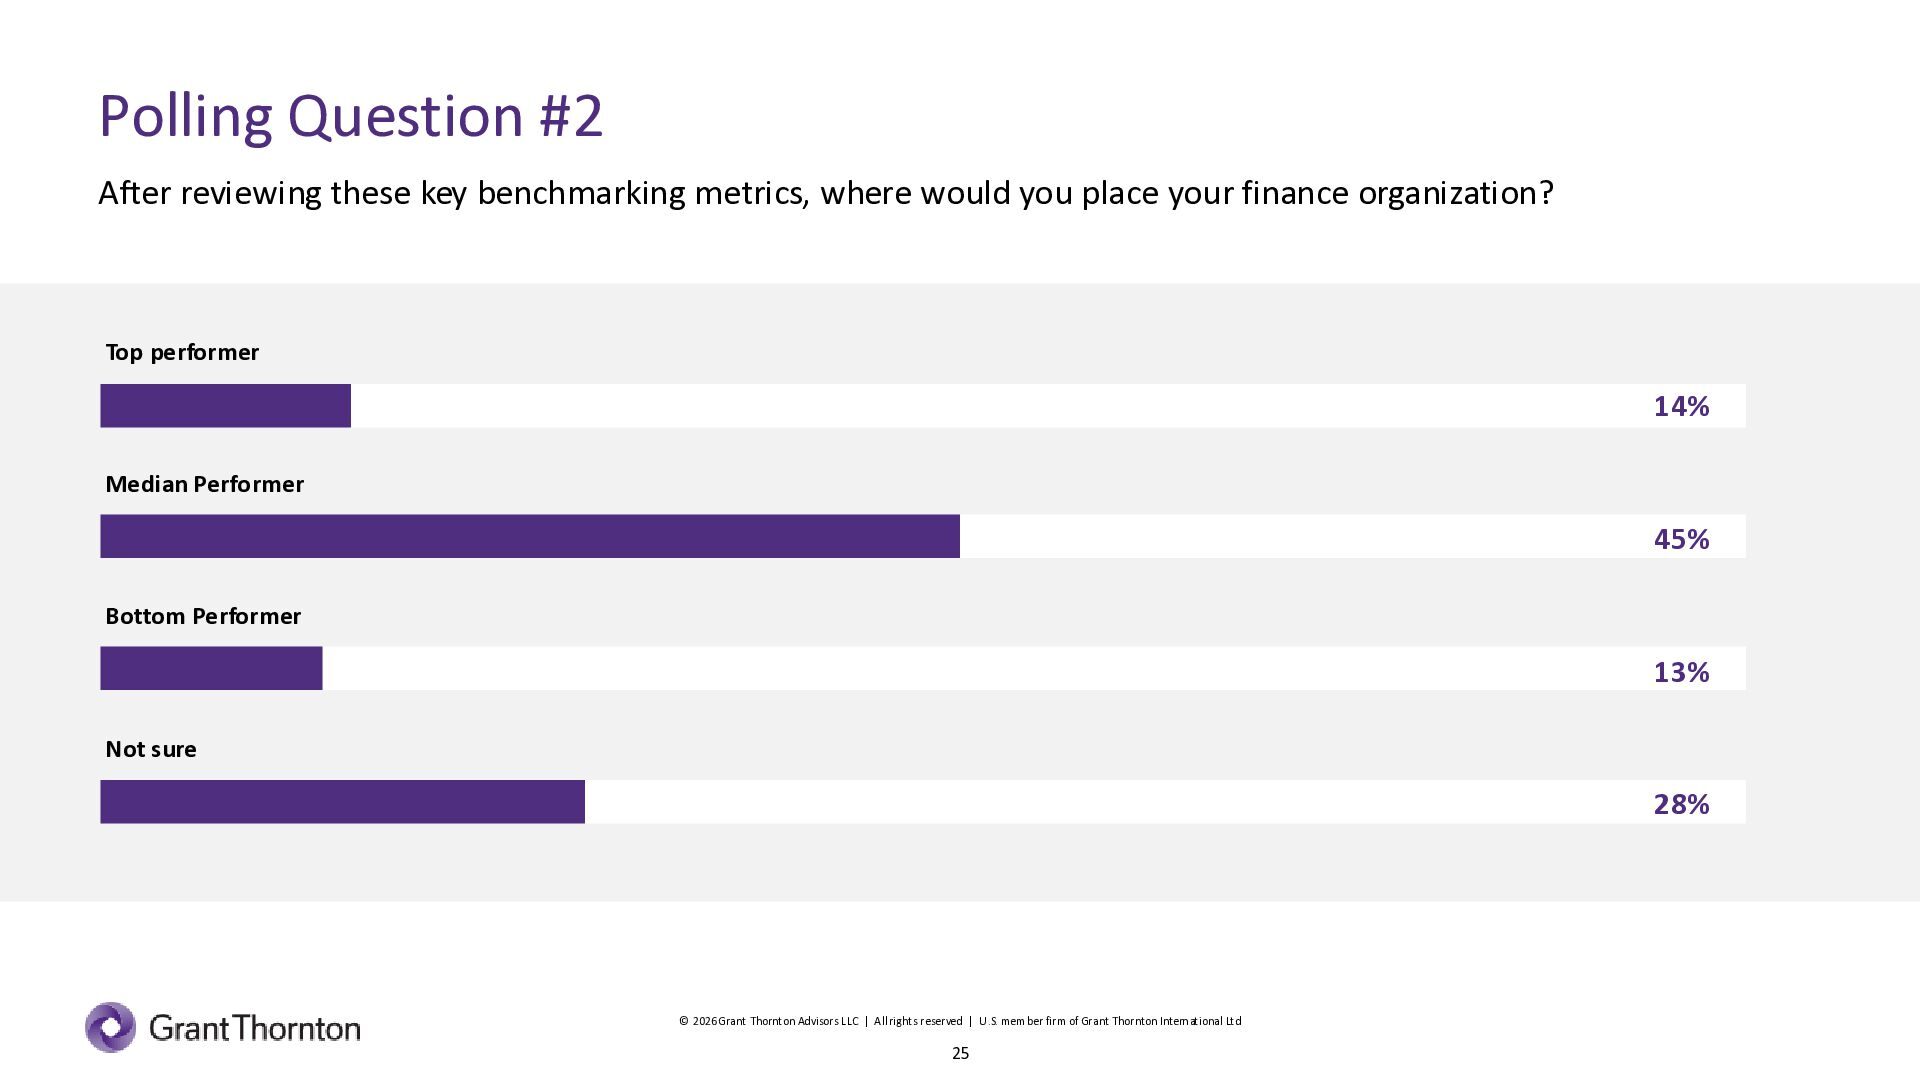
  25. Polling Question #2 After reviewing these key benchmarking metrics, where

    would you place your finance organization? Top performer 14% Median Performer 45% Bottom Performer 13% Not sure 28% © 2026 Grant Thornton Advisors LLC | All rights reserved | U .S. member firm of Grant Thornton International Ltd 25
  26. So, you're not a Top Performer. Now what? © 2026

    Grant Thornton Advisors LLC | All rights reserved | U .S. member firm of Grant Thornton International Ltd 26 26
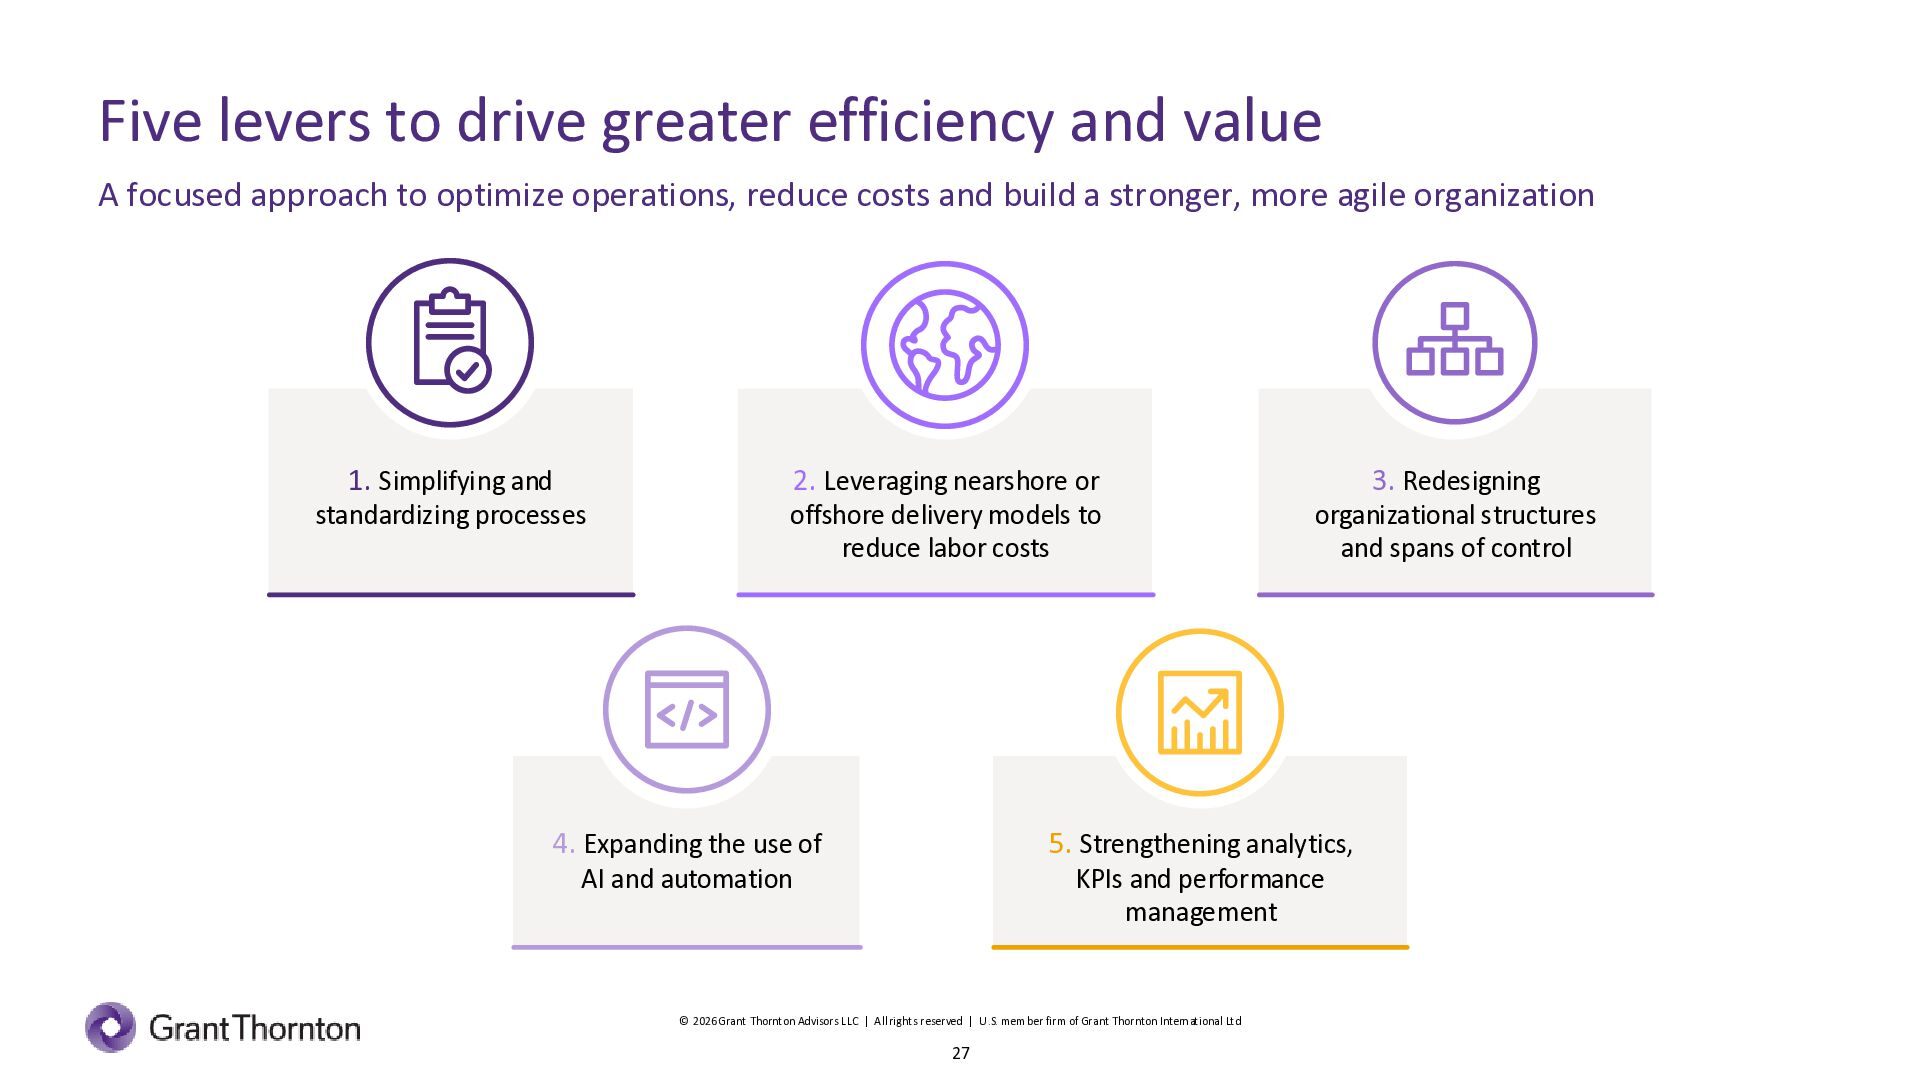
  27. Five levers to drive greater efficiency and value A focused

    approach to optimize operations, reduce costs and build a stronger, more agile organization 1. Simplifying and standardizing processes 2. Leveraging nearshore or offshore delivery models to reduce labor costs 4. Expanding the use of organizational structures and spans of control 5. Strengthening analytics, AI and automation KPIs and performance management © 2026 Grant Thornton Advisors LLC | All rights reserved | U .S. member firm of Grant Thornton International Ltd 27 3. Redesigning
  28. Polling Question #3 Which of the following levers are you

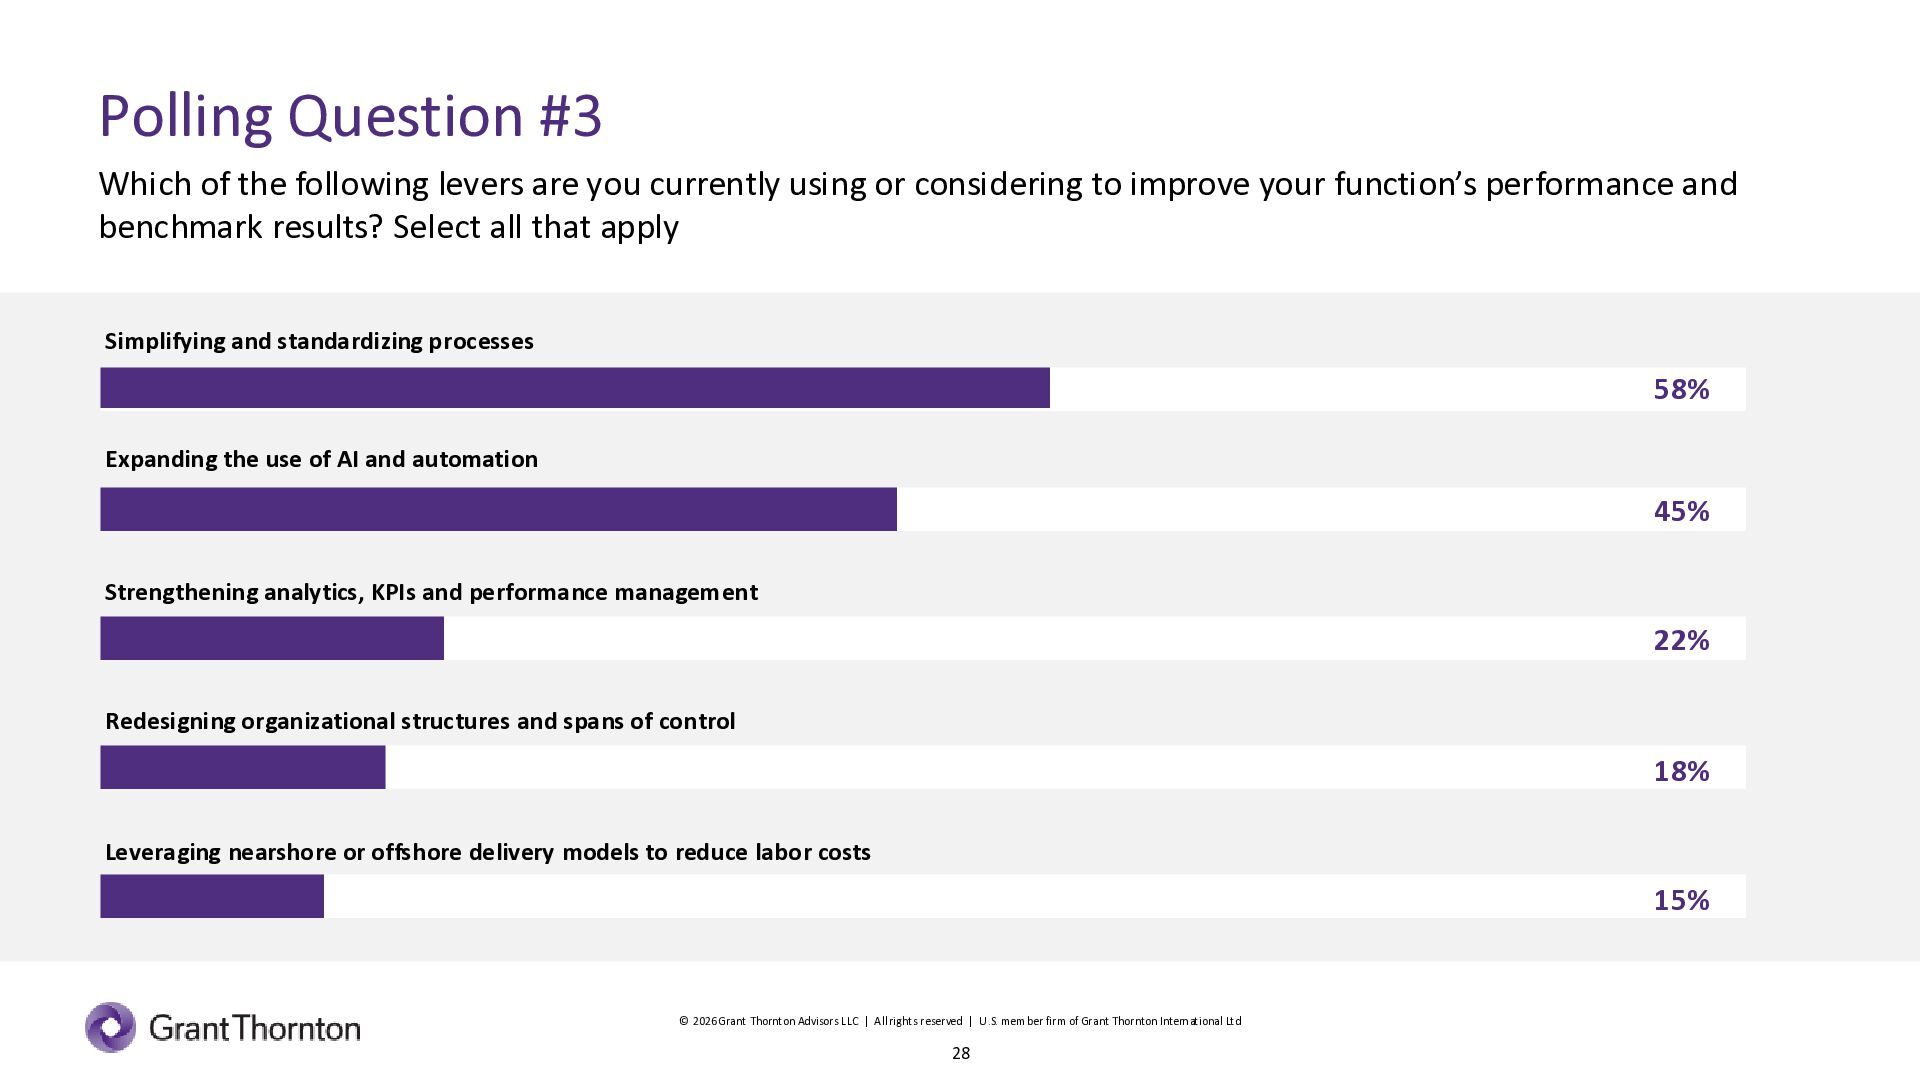
    currently using or considering to improve your function’s performance and benchmark results? Select all that apply Simplifying and standardizing processes 58% Expanding the use of AI and automation 45% Strengthening analytics, KPIs and performance management 22% Redesigning organizational structures and spans of control 18% Leveraging nearshore or offshore delivery models to reduce labor costs 15% © 2026 Grant Thornton Advisors LLC | All rights reserved | U .S. member firm of Grant Thornton International Ltd 28
  29. Most finance organizations struggle with how, where and when to

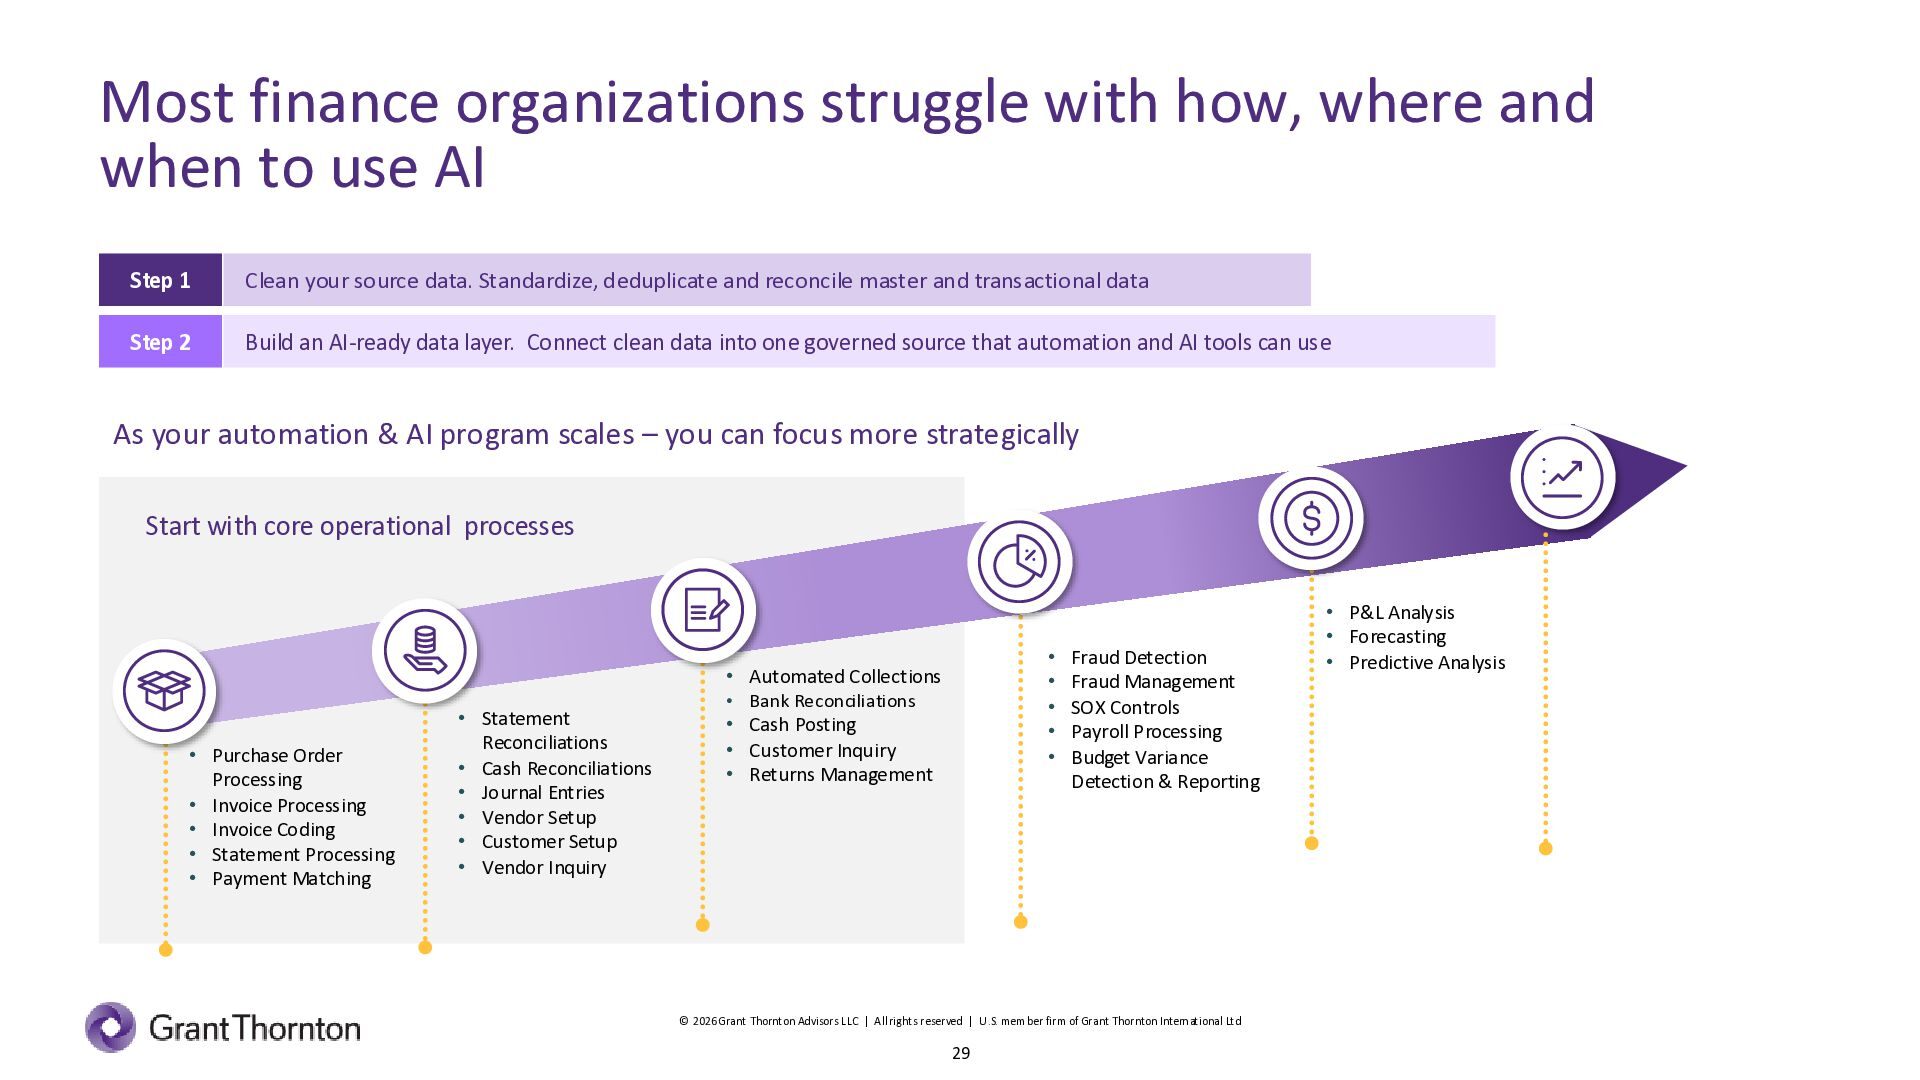
    use AI Step 1 Clean your source data. Standardize, deduplicate and reconcile master and transactional data Step 2 Build an AI-ready data layer. Connect clean data into one governed source that automation and AI tools can use As your automation & AI program scales – you can focus more strategically Start with core operational processes • • • • • • Automated Collections • Purchase Order Processing • Invoice Processing • Invoice Coding • Statement Processing • Payment Matching • Statement Reconciliations • Cash Reconciliations • Journal Entries • Vendor Setup • Customer Setup • Vendor Inquiry • Bank Reconciliations • Cash Posting • Customer Inquiry • Returns Management Fraud Detection Fraud Management SOX Controls Payroll Processing Budget Variance Detection & Reporting © 2026 Grant Thornton Advisors LLC | All rights reserved | U .S. member firm of Grant Thornton International Ltd 29 • P&L Analysis • Forecasting • Predictive Analysis
  30. High-impact agentic use cases across finance Accounts payable exception handling

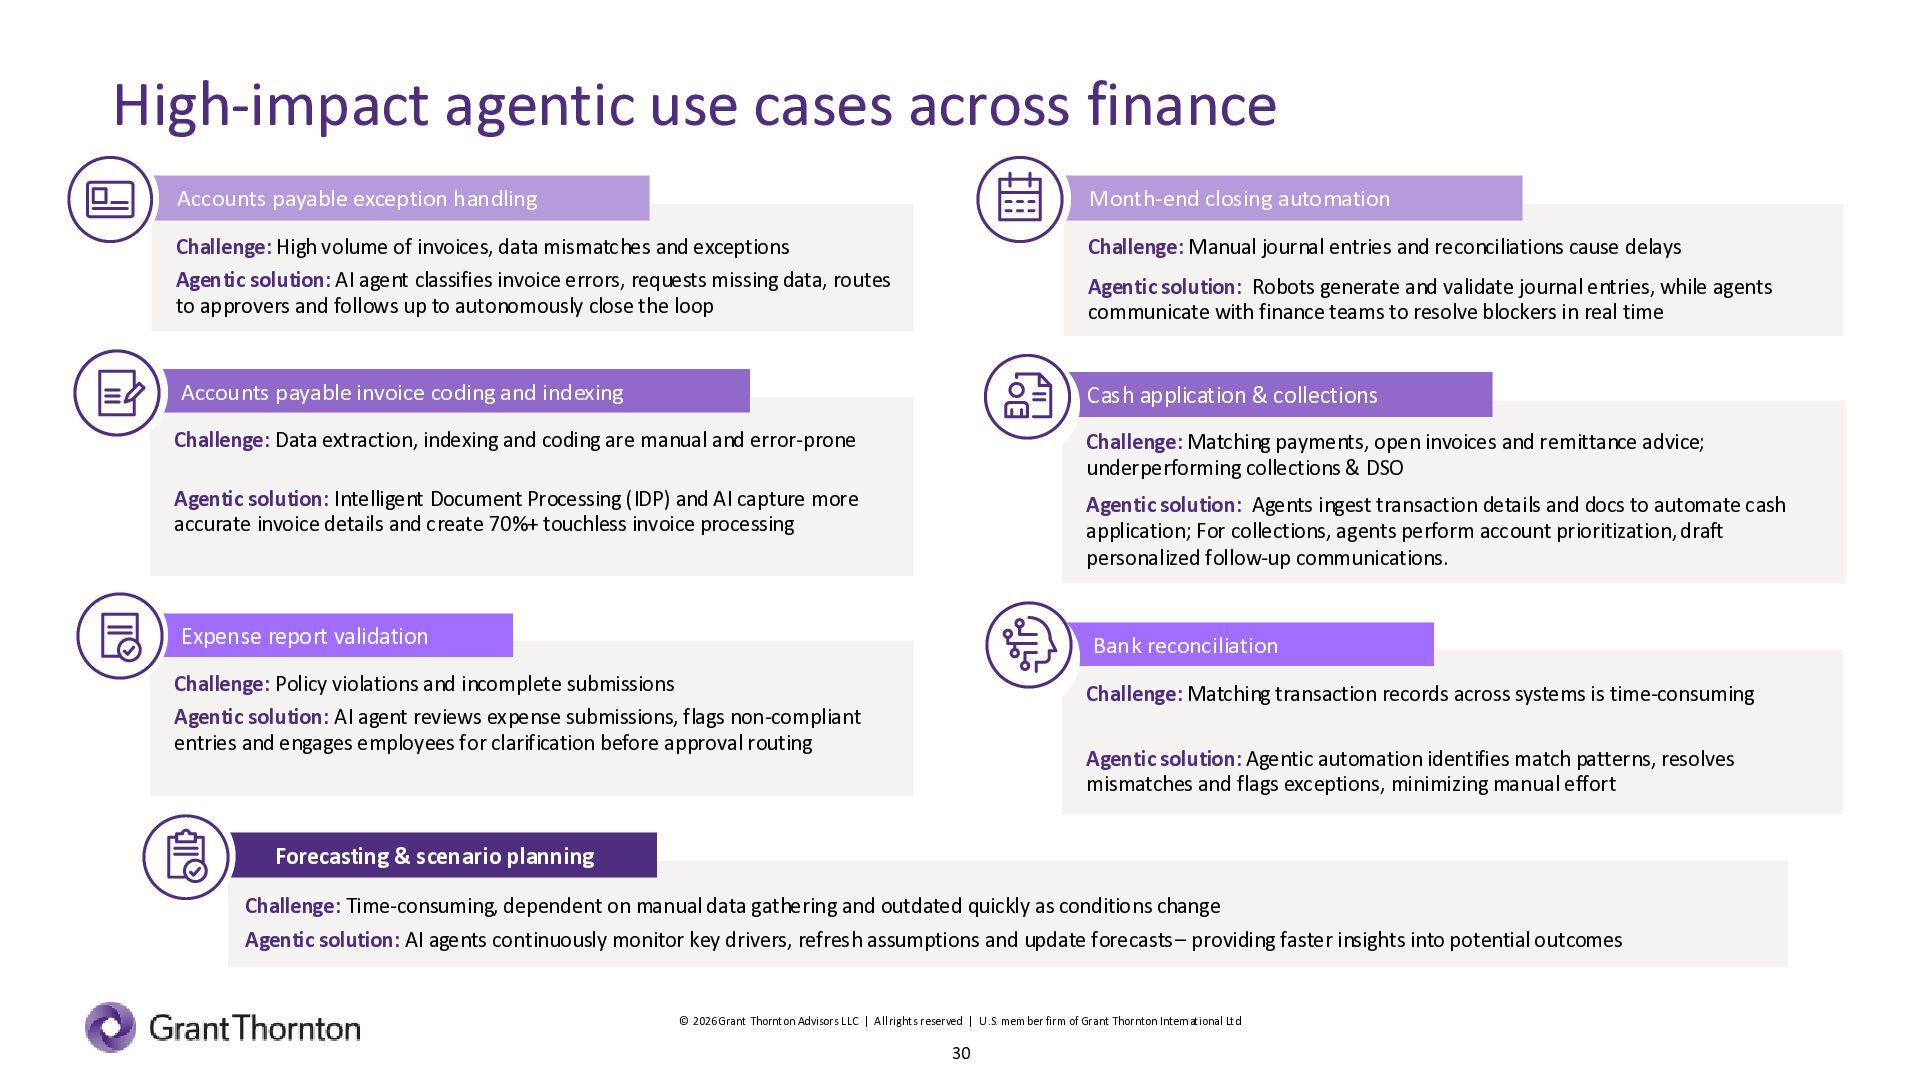
    Month-end closing automation Challenge: High volume of invoices, data mismatches and exceptions Agentic solution: AI agent classifies invoice errors, requests missing data, routes to approvers and follows up to autonomously close the loop Challenge: Manual journal entries and reconciliations cause delays Accounts payable invoice coding and indexing Cash application & collections Challenge: Data extraction, indexing and coding are manual and error-prone Challenge: Matching payments, open invoices and remittance advice; underperforming collections & DSO Agentic solution: Intelligent Document Processing (IDP) and AI capture more accurate invoice details and create 70%+ touchless invoice processing Agentic solution: Agents ingest transaction details and docs to automate cash application; For collections, agents perform account prioritization,draft personalized follow-up communications. Expense report validation Bank reconciliation Challenge: Policy violations and incomplete submissions Agentic solution: AI agent reviews expense submissions, flags non-compliant entries and engages employees for clarification before approval routing Challenge: Matching transaction records across systems is time-consuming Agentic solution: Robots generate and validate journal entries, while agents communicate with finance teams to resolve blockers in real time Agentic solution: Agentic automation identifies match patterns, resolves mismatches and flags exceptions, minimizing manual effort Forecasting & scenario planning Challenge: Time-consuming, dependent on manual data gathering and outdated quickly as conditions change Agentic solution: AI agents continuously monitor key drivers, refresh assumptions and update forecasts – providing faster insights into potential outcomes © 2026 Grant Thornton Advisors LLC | All rights reserved | U .S. member firm of Grant Thornton International Ltd 30
  31. Agentic in action: an AP case study Business challenge IDP

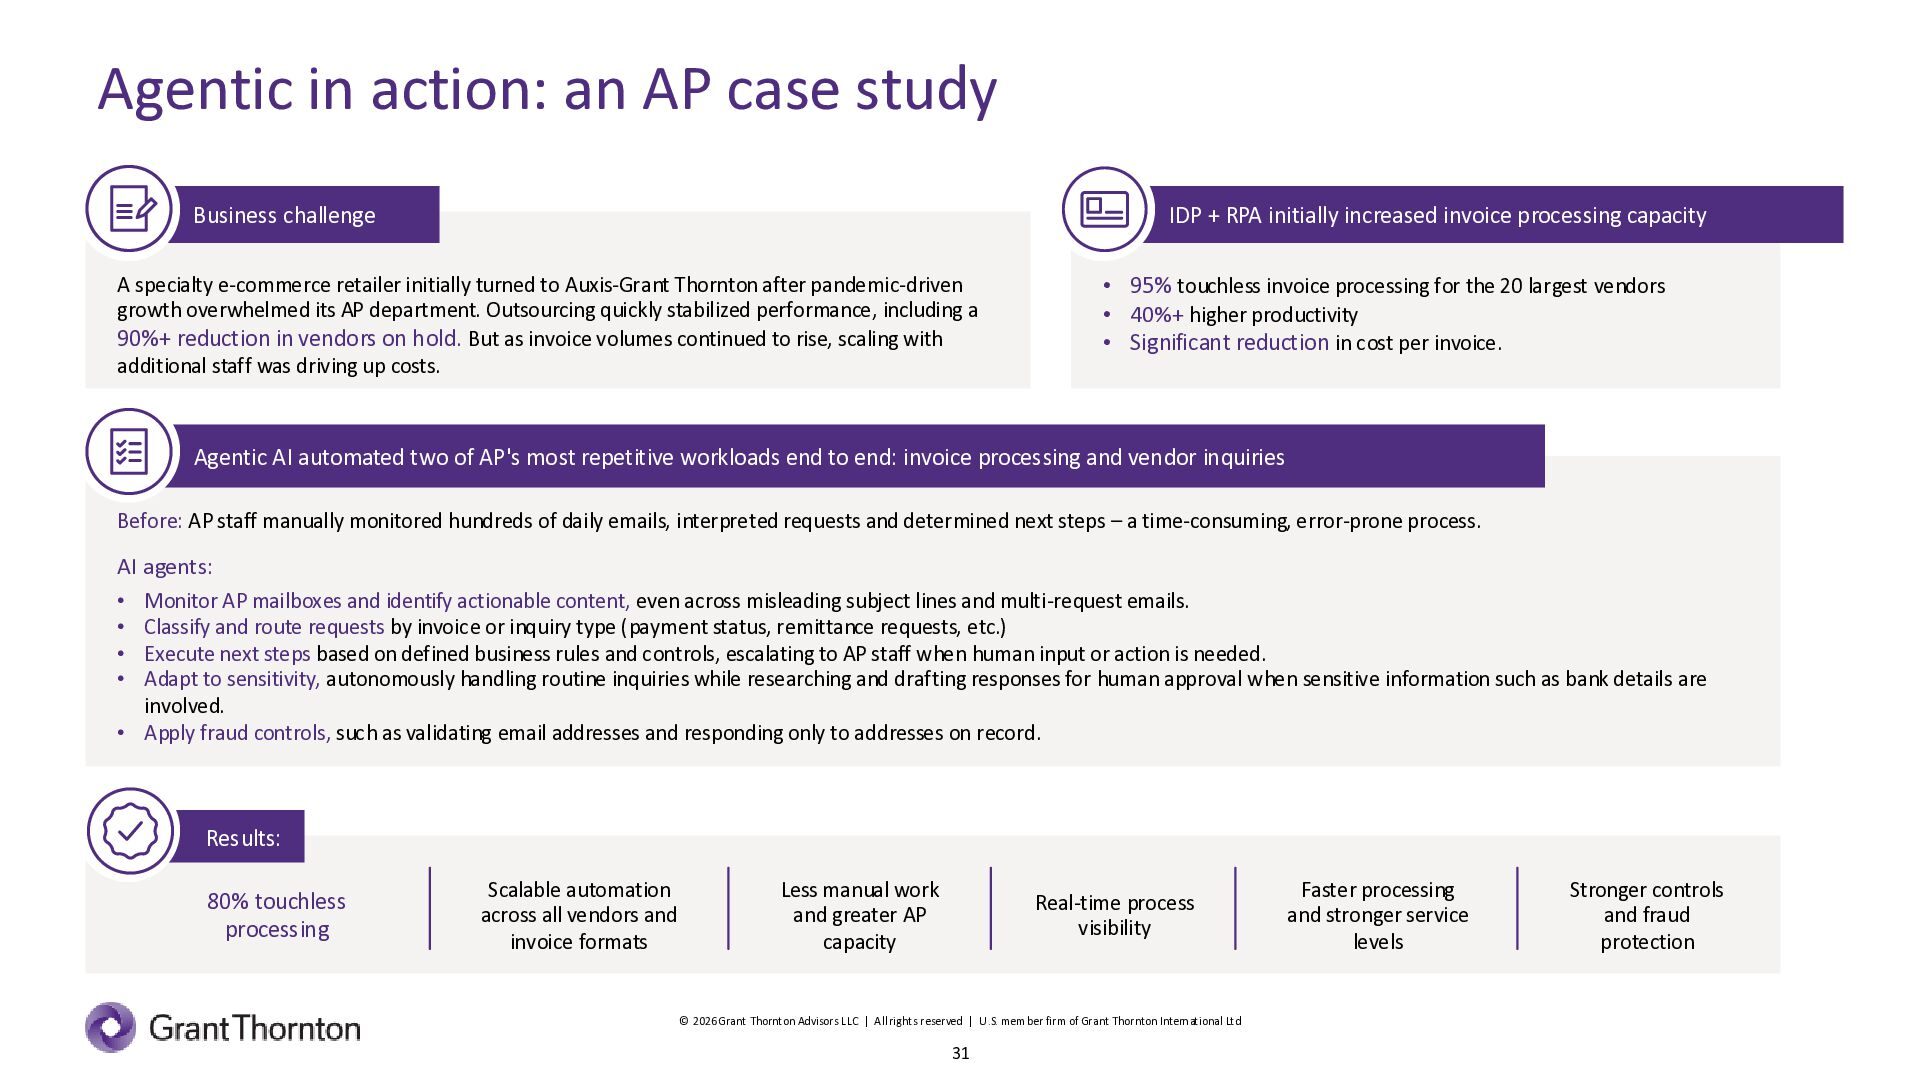
    + RPA initially increased invoice processing capacity A specialty e-commerce retailer initially turned to Auxis-Grant Thornton after pandemic-driven growth overwhelmed its AP department. Outsourcing quickly stabilized performance, including a 90%+ reduction in vendors on hold. But as invoice volumes continued to rise, scaling with additional staff was driving up costs. • 95% touchless invoice processing for the 20 largest vendors • 40%+ higher productivity • Significant reduction in cost per invoice. Agentic AI automated two of AP's most repetitive workloads end to end: invoice processing and vendor inquiries Before: AP staff manually monitored hundreds of daily emails, interpreted requests and determined next steps – a time-consuming, error-prone process. AI agents: Monitor AP mailboxes and identify actionable content, even across misleading subject lines and multi-request emails. Classify and route requests by invoice or inquiry type (payment status, remittance requests, etc.) Execute next steps based on defined business rules and controls, escalating to AP staff when human input or action is needed. Adapt to sensitivity, autonomously handling routine inquiries while researching and drafting responses for human approval when sensitive information such as bank details are involved. • Apply fraud controls, such as validating email addresses and responding only to addresses on record. • • • • Results: 80% touchless processing Scalable automation across all vendors and invoice formats Less manual work and greater AP capacity Real-time process visibility © 2026 Grant Thornton Advisors LLC | All rights reserved | U .S. member firm of Grant Thornton International Ltd 31 Faster processing and stronger service levels Stronger controls and fraud protection
  32. Explore more finance benchmarking insights Get the new AI-era edition

    of our best-read finance benchmarking report Get the report Get the report © 2026 Grant Thornton Advisors LLC | All rights reserved | U .S. member firm of Grant Thornton International Ltd 32
  33. Q&A © 2026 Grant Thornton Advisors LLC | All rights

    reserved | U .S. member firm of Grant Thornton International Ltd 33 33
  34. Thank you for joining us today! Keith Sayewitz Eric Liebross

    Dan Day Bill Woodford Partner, Finance Transformation & BPO Partner, Finance Transformation & BPO Partner, Finance Transformation & BPO Partner, AI & Digital Transformation © 2026 Grant Thornton Advisors LLC | All rights reserved | U .S. member firm of Grant Thornton International Ltd 34 Moderator – Fabiana Corredor Vice President, Finance Transformation & BPO
  35. Visit us online linkedin.com/company/grant-thornton-us/ www.gt.com For questions regarding your CPE

    certificate, contact [email protected] © 2026 Grant Thornton Advisors LLC | All rights reserved | U .S. member firm of Grant Thornton International Ltd 35
  36. Thank you for attending To retrieve your CPE certificate •

    Respond to the online evaluation form. Please note, you may need to disable pop-up blocking software to complete this evaluation. • Print your CPE certificate and retain for your records. Participants are responsible to maintain CPE completion records. • Those receiving CPE will also receive the certificate at the email address used to register for the webcast. • We are unable to grant CPE credit in cases where technical difficulties preclude eligibility. CPE program sponsorship guidelines prohibit us from issuing credit to those not verified by the technology to have satisfied the minimum requirements in monitoring response and viewing time. If you experience any technical difficulties, please email [email protected] © 2026 Grant Thornton Advisors LLC | All rights reserved | U .S. member firm of Grant Thornton International Ltd 36
  37. This Grant Thornton Advisors LLC presentation is not a comprehensive

    analysis of the subject matters covered and may include proposed guidance that is subject to change before it is issued in final form. All relevant facts and circumstances, including the pertinent authoritative literature, need to be considered to arrive at conclusions that comply with matters addressed in this presentation. The views and interpretations expressed in the presentation are those of the presenters, and the presentation is not intended to provide advice or guidance with respect to the matters covered. It is not, and should not be construed as, accounting, legal, tax, or professional advice provided by Grant Thornton Advisors LLC. Grant Thornton Advisors LLC and its subsidiary entities are not licensed CPA firms. For additional information on matters covered in this presentation, contact a Grant Thornton Advisors LLC professional. This Grant Thornton Advisors LLC content provides information and comments on current issues and developments. It is not a comprehensive analysis of the subject matter covered. It is not, and should not be construed as, accounting, legal, tax, or professional advice provided by Grant Thornton Advisors LLC. All relevant facts and circumstances, including the pertinent authoritative literature, need to be considered to arrive at conclusions that comply with matters addressed in this content. Grant Thornton Advisors LLC and its subsidiary entities are not licensed CPA firms. For additional information on topics covered in this content, contact a Grant Thornton Advisors LLC professional. “Grant Thornton” refers to the brand name under which the Grant Thornton member firms provide services to their clients and/or refers to one or more member firms, as the context requires. Grant Thornton LLP and Grant Thornton Advisors LLC (and their respective subsidiary entities) practice as an alternative practice structure in accordance with the AICPA Code of Professional Conduct and applicable law, regulations and professional standards. Grant Thornton LLP is a licensed independent CPA firm that provides attest services to its clients, and Grant Thornton Advisors LLC and its subsidiary entities provide tax and business consulting services to their clients. Grant Thornton Advisors LLC and its subsidiary entities are not licensed CPA firms. Grant Thornton International Limited (GTIL) and the member firms, including Grant Thornton LLP and Grant Thornton Advisors LLC, are not a worldwide partnership. GTIL and each member firm are separate legal entities. Services are delivered by the member firms, GTIL does not provide services to clients. GTIL and its member firms are not agents of, and do not obligate, one another and are not liable for one another’s acts or omissions. © 2026 Grant Thornton Advisors LLC | All rights reserved | U .S. member firm of Grant Thornton International Ltd 37