Earth Analysis, Seattle, WA Global Earthquake Model Foundation, Pavia, Italy Brian Sherrod US Geological Survey, Seattle, WA BIG THANKS TO DATA COLLECTORS!
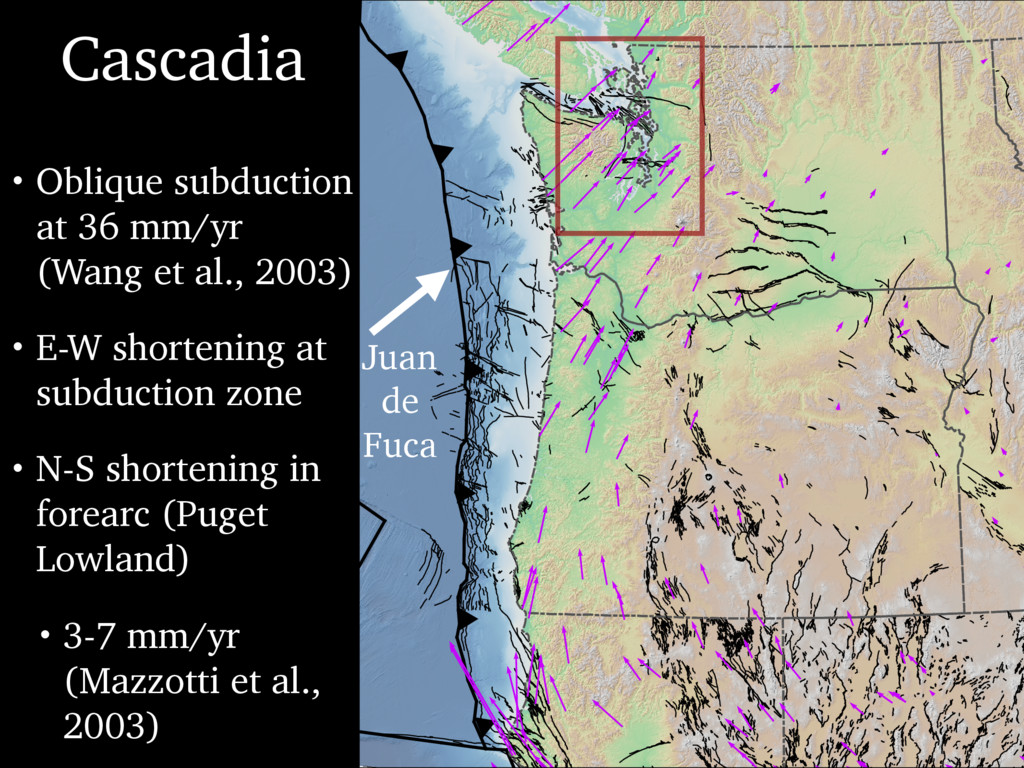
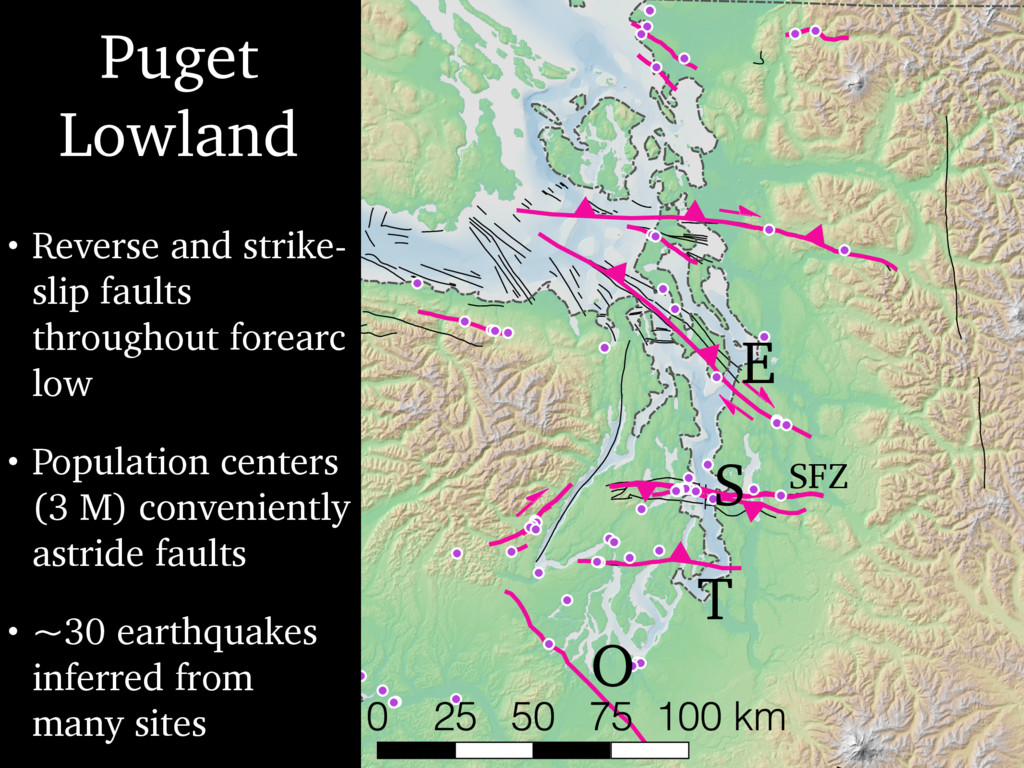
mapping of ~30 paleoearthquakes in Puget Sound region over ~16,000 years (post-glacial tabula rasa) • Improved methods for estimating paleoearthquake magnitude and recurrence intervals • Demographic statistical methods (survival analysis) aid in time-dependent earthquake hazard estimates
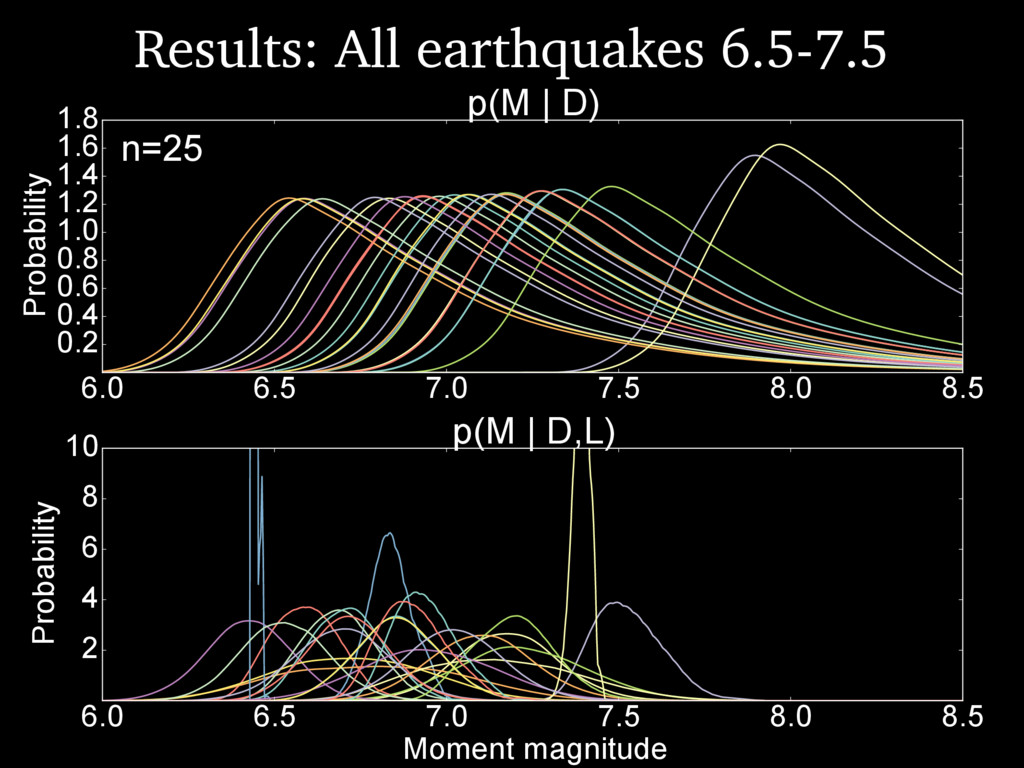
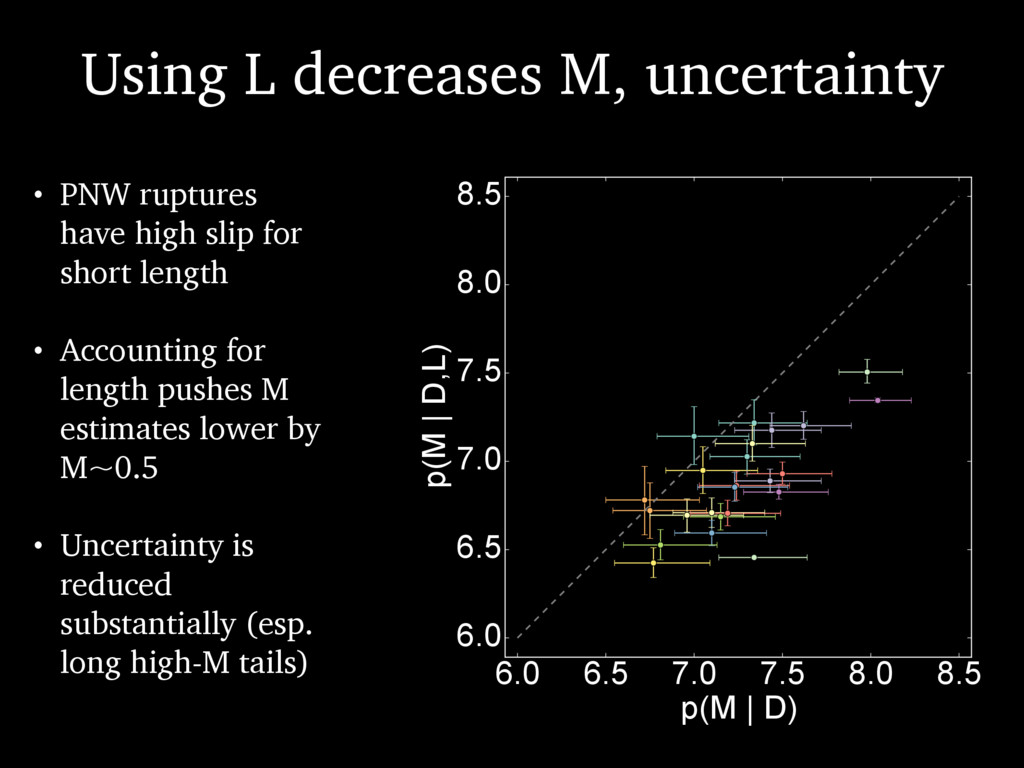
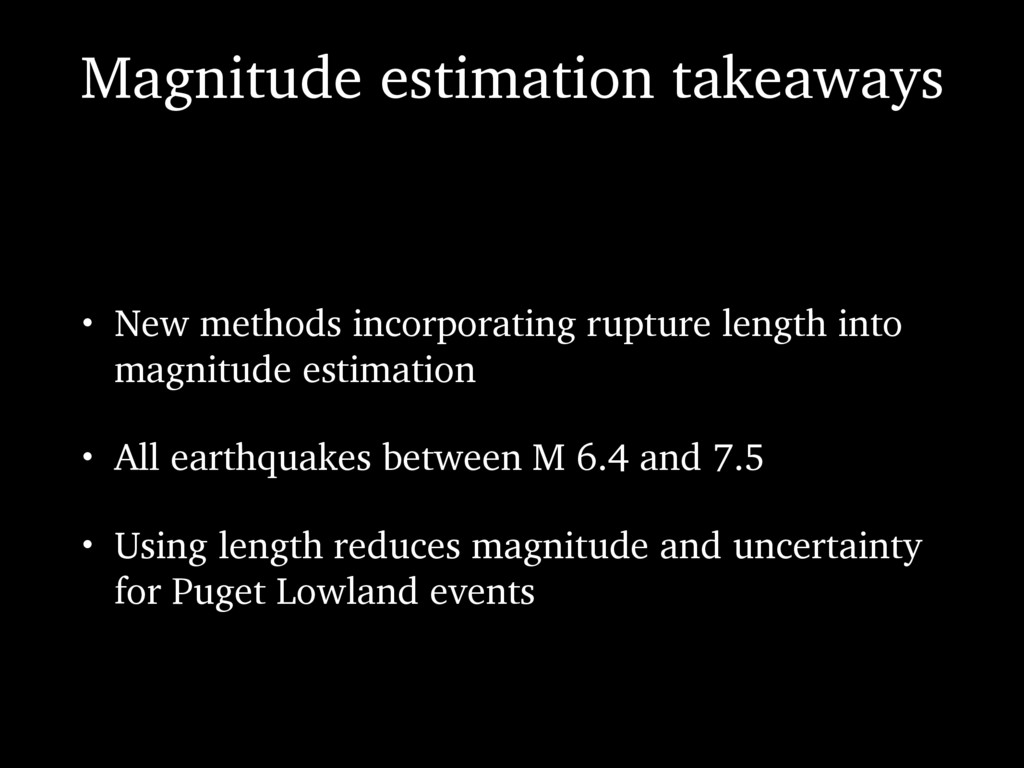
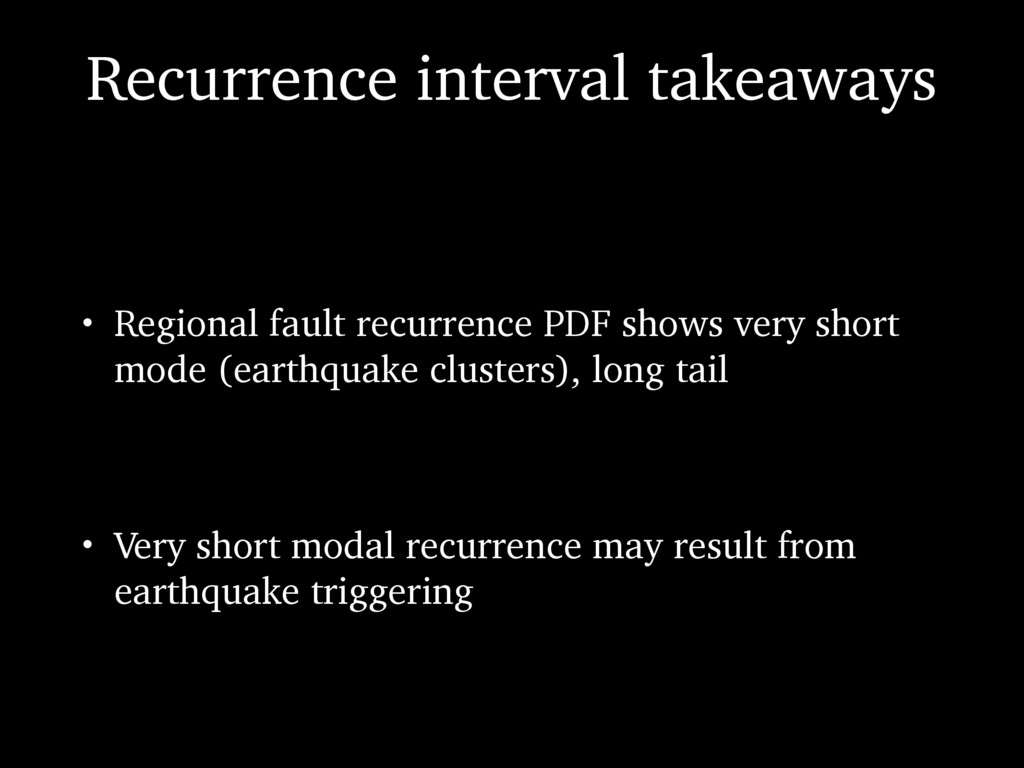
offsets and short rupture lengths -> Magnitudes between 6.5-7.5 • Earthquakes are clustered in time, and recurrence modes are 20-200 years • Elevated post-earthquake seismic hazard
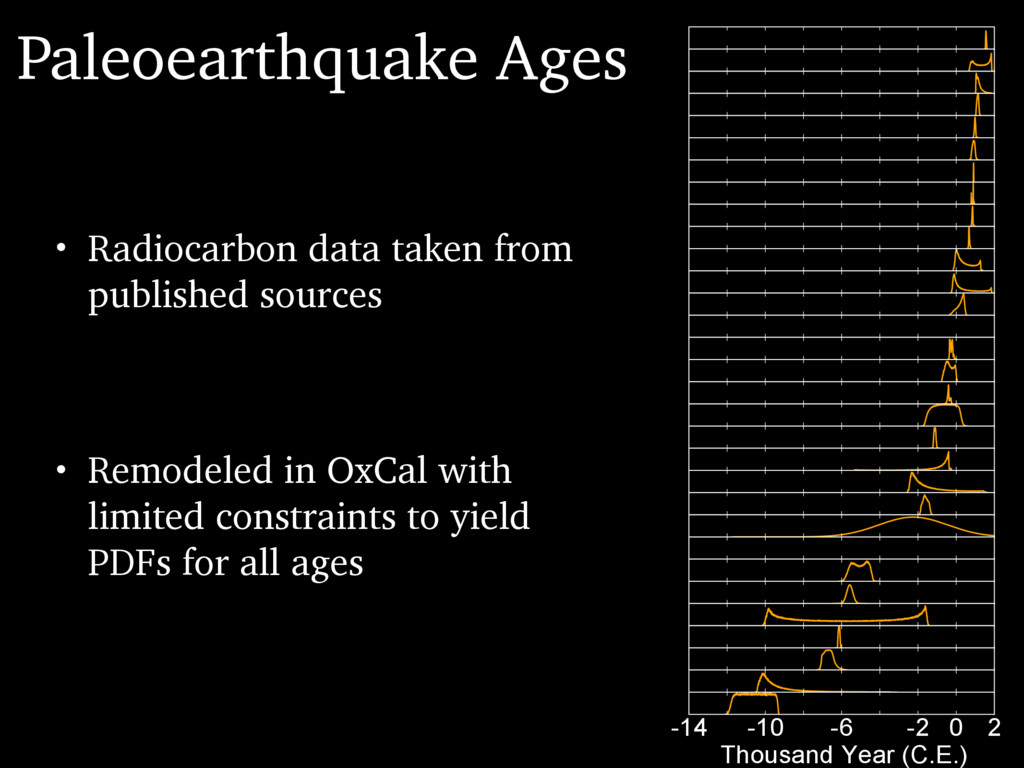
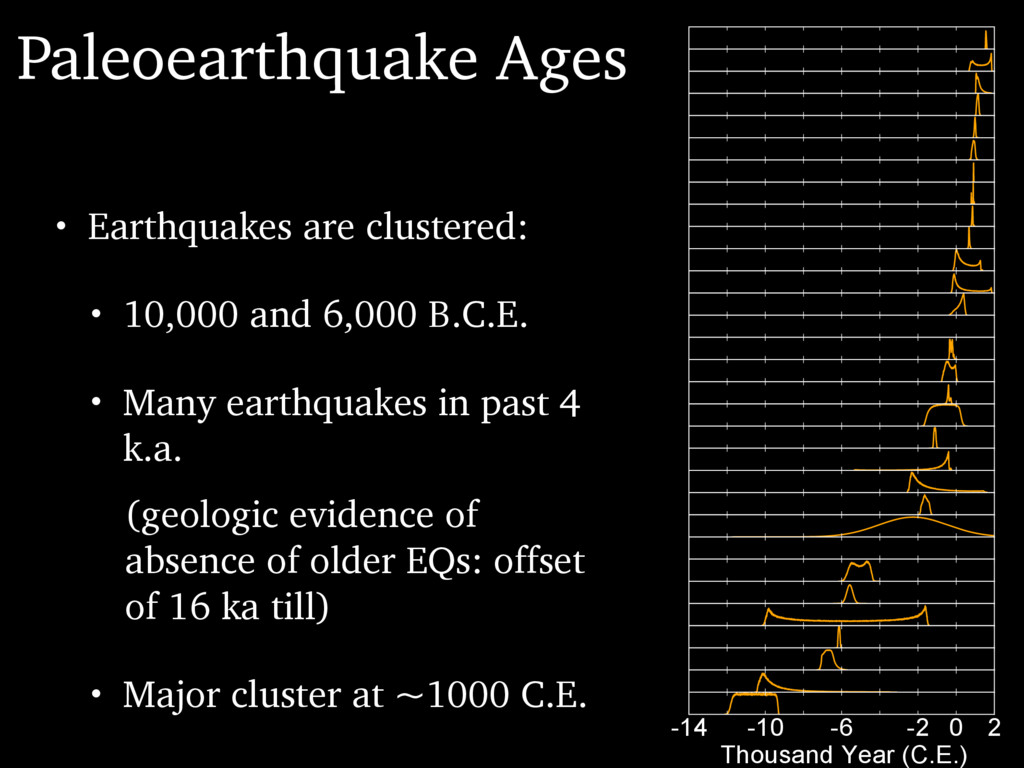
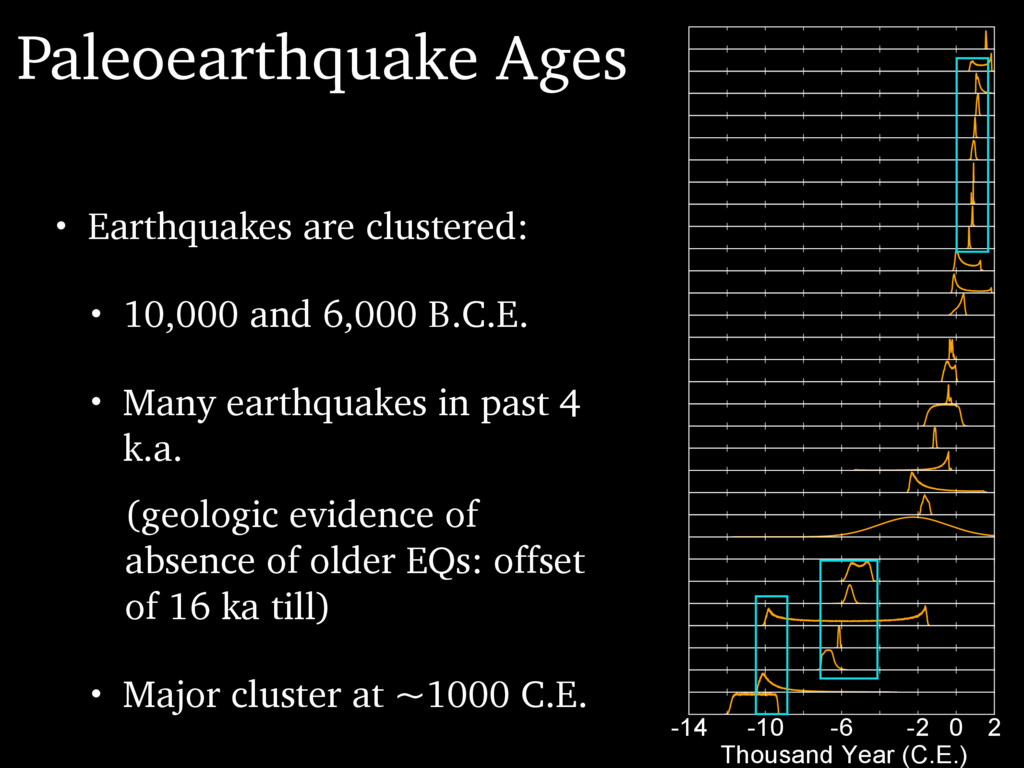
B.C.E. • Many earthquakes in past 4 k.a. (geologic evidence of absence of older EQs: offset of 16 ka till) • Major cluster at ~1000 C.E. -14 -10 -6 -2 0 2 Thousand Year (C.E.)
B.C.E. • Many earthquakes in past 4 k.a. (geologic evidence of absence of older EQs: offset of 16 ka till) • Major cluster at ~1000 C.E. -14 -10 -6 -2 0 2 Thousand Year (C.E.)
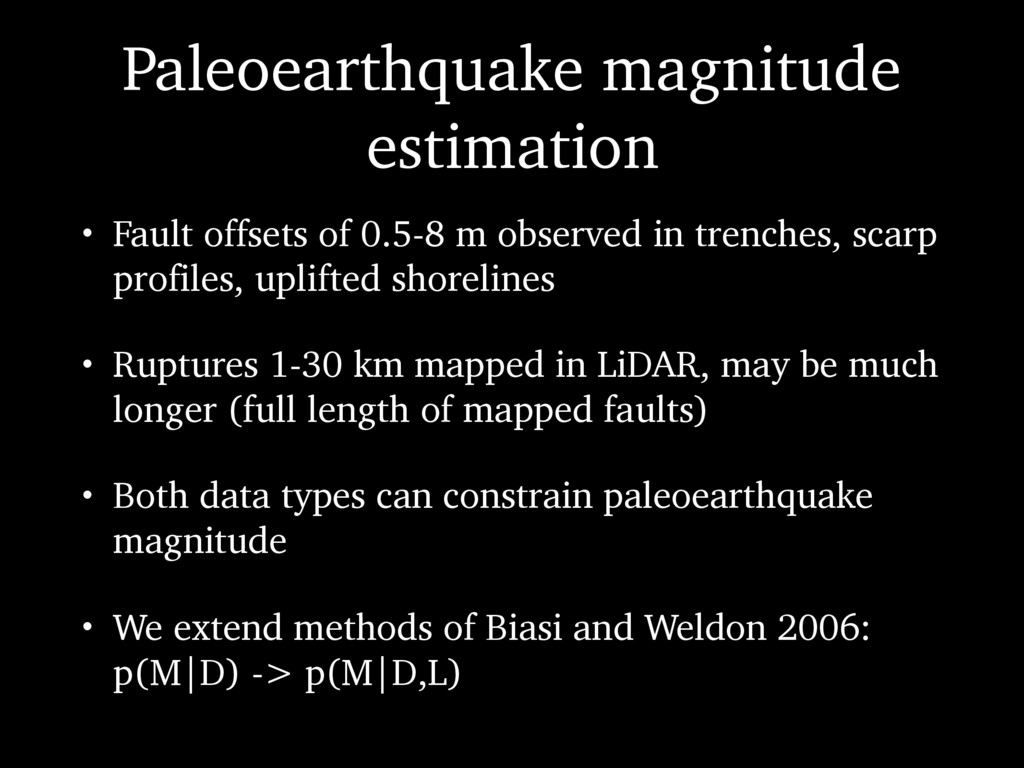
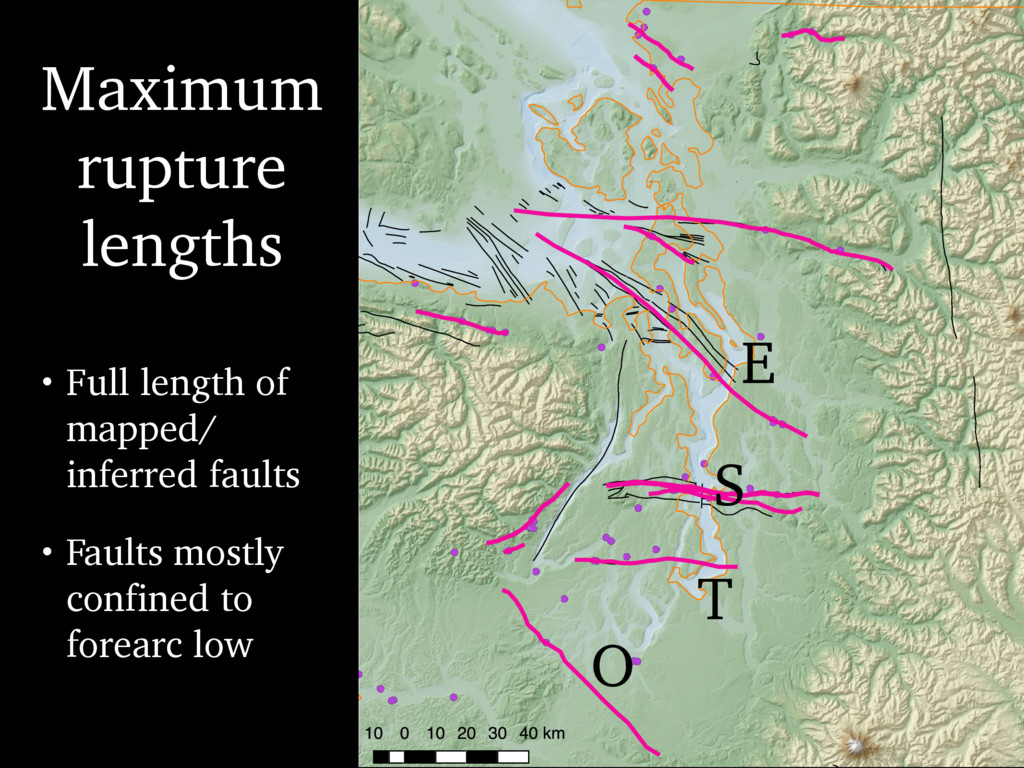
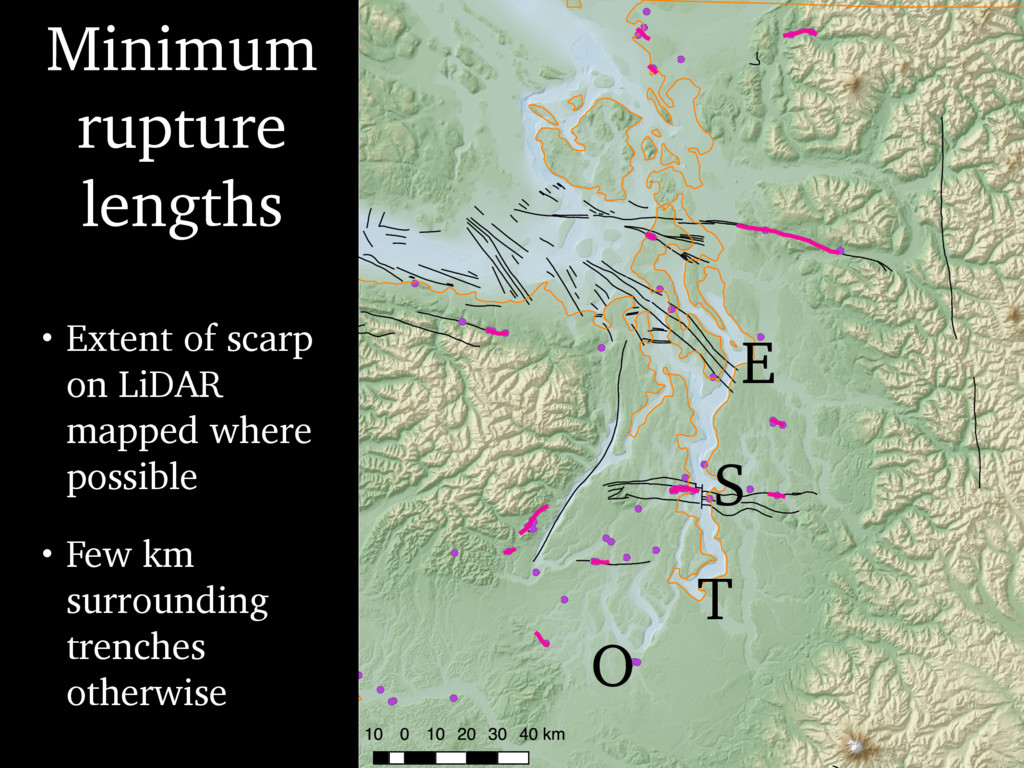
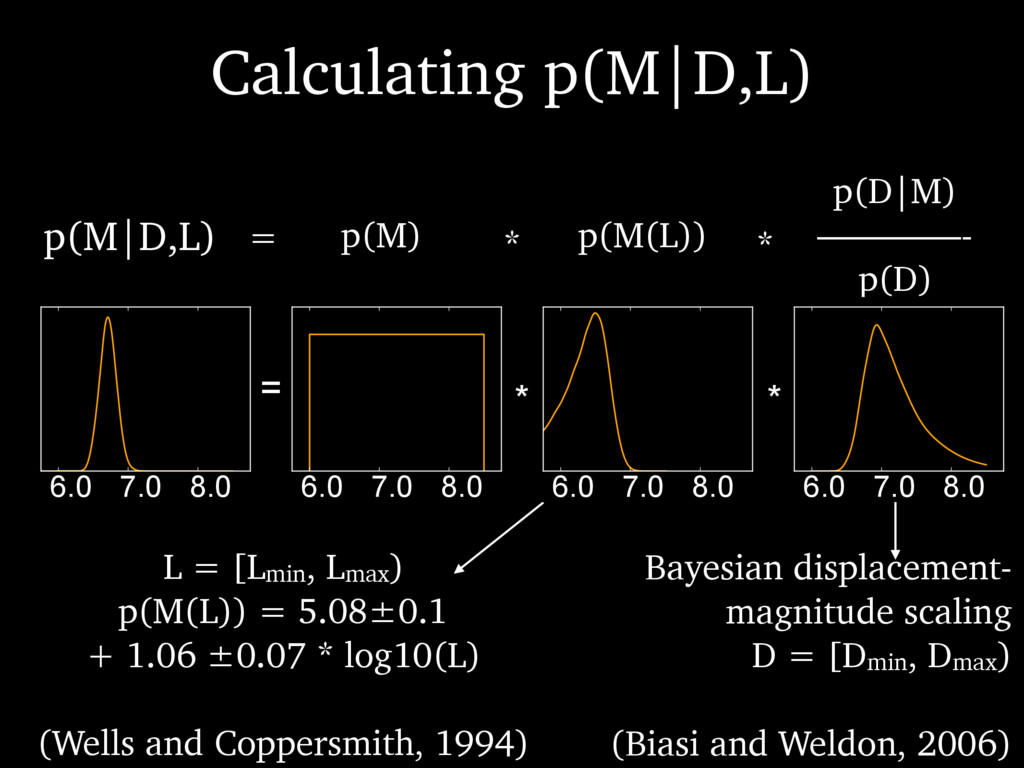
in trenches, scarp profiles, uplifted shorelines • Ruptures 1-30 km mapped in LiDAR, may be much longer (full length of mapped faults) • Both data types can constrain paleoearthquake magnitude • We extend methods of Biasi and Weldon 2006: p(M|D) -> p(M|D,L)
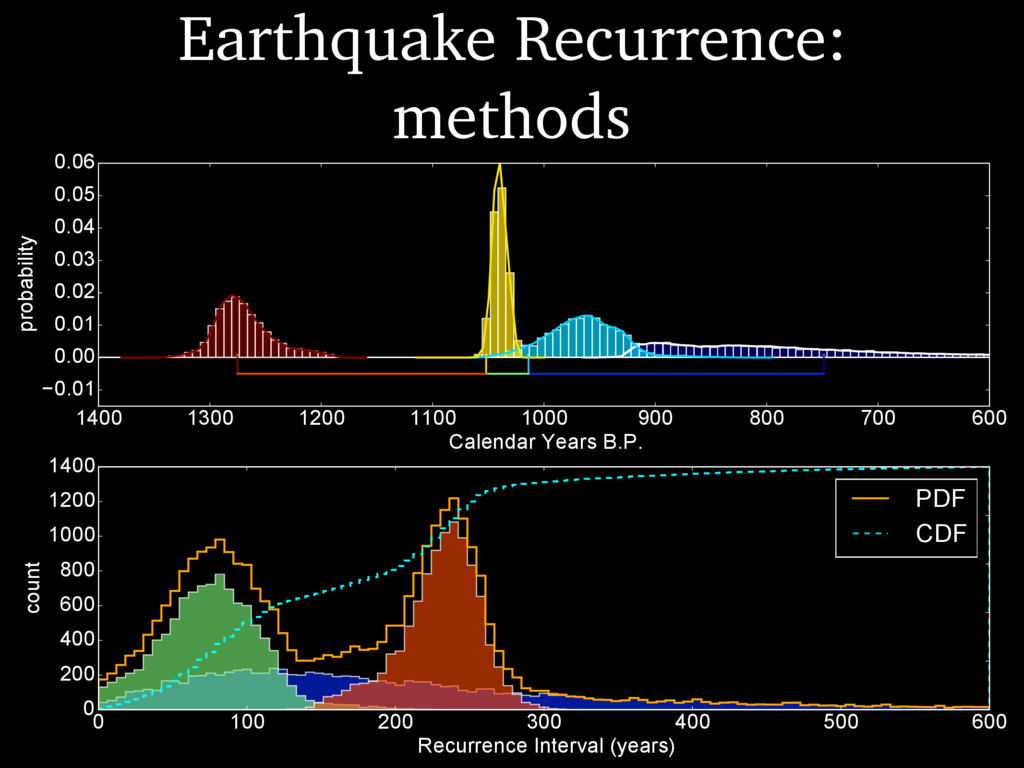
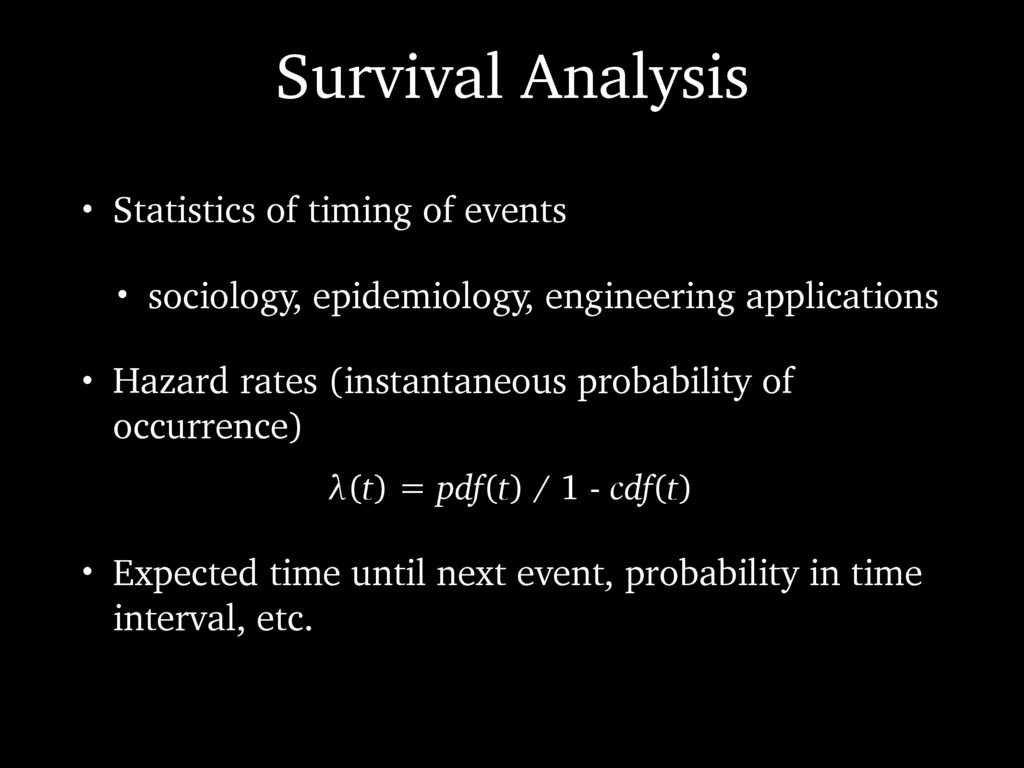
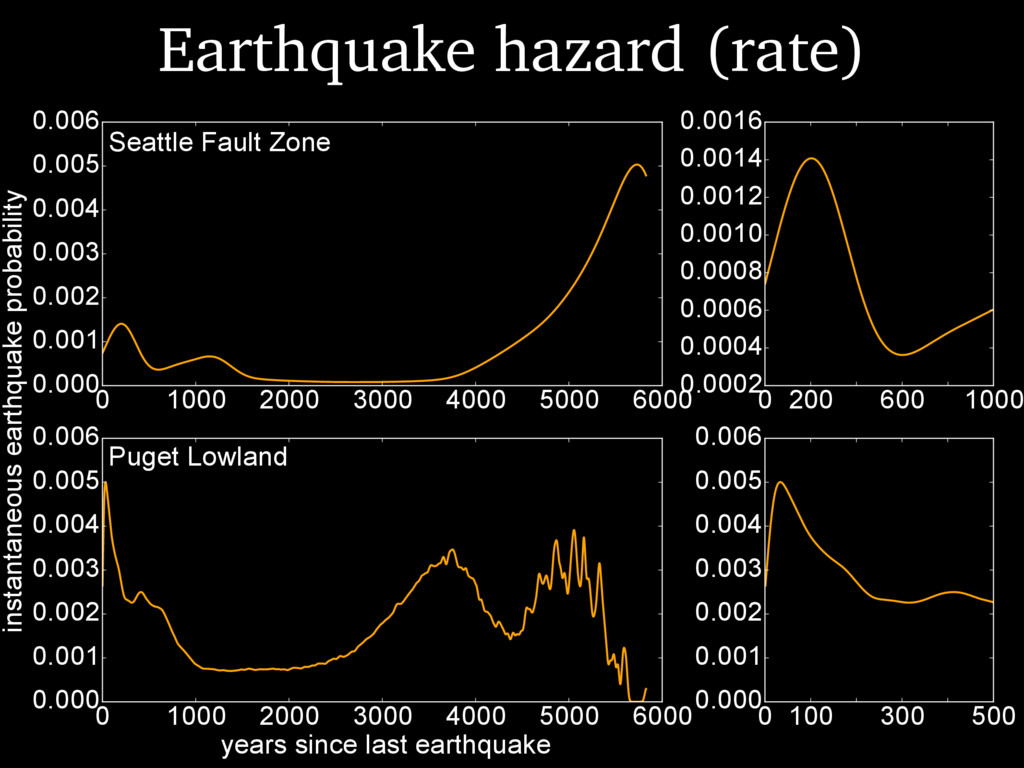
epidemiology, engineering applications • Hazard rates (instantaneous probability of occurrence) λ(t) = pdf(t) / 1 - cdf(t) • Expected time until next event, probability in time interval, etc.
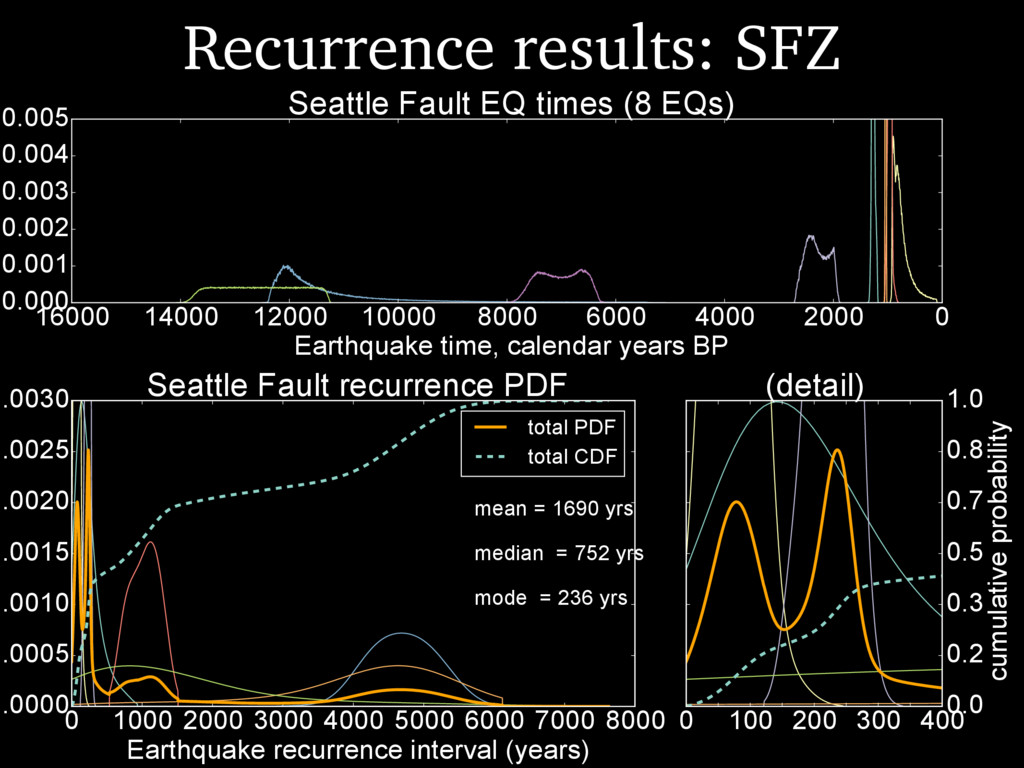
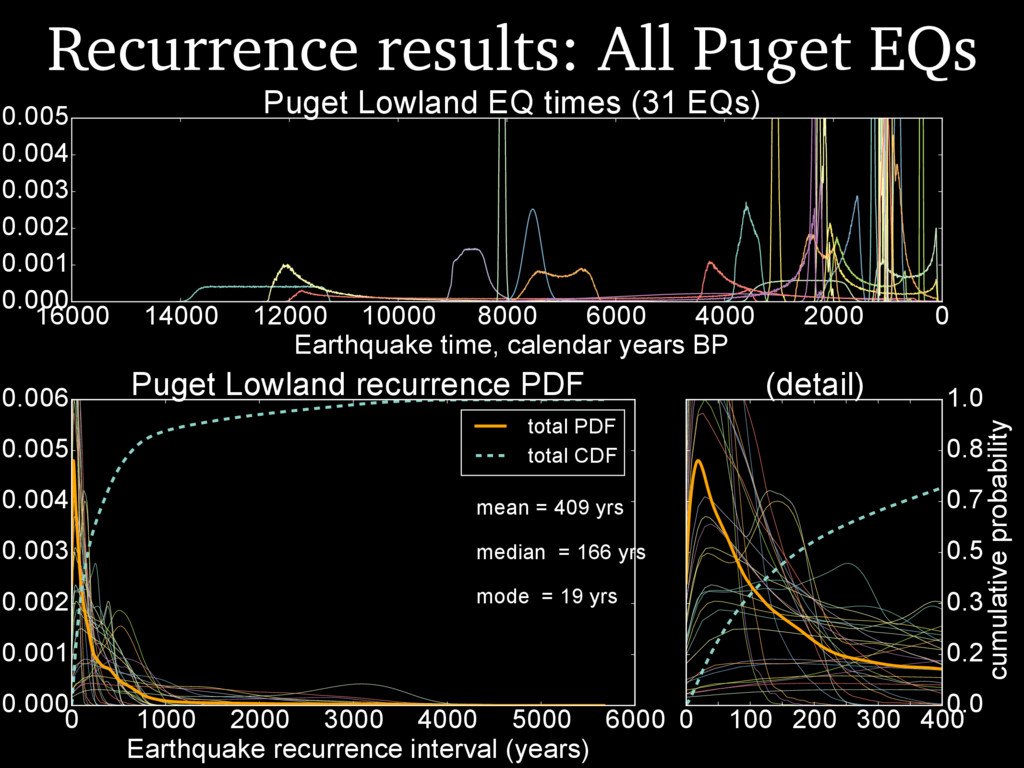
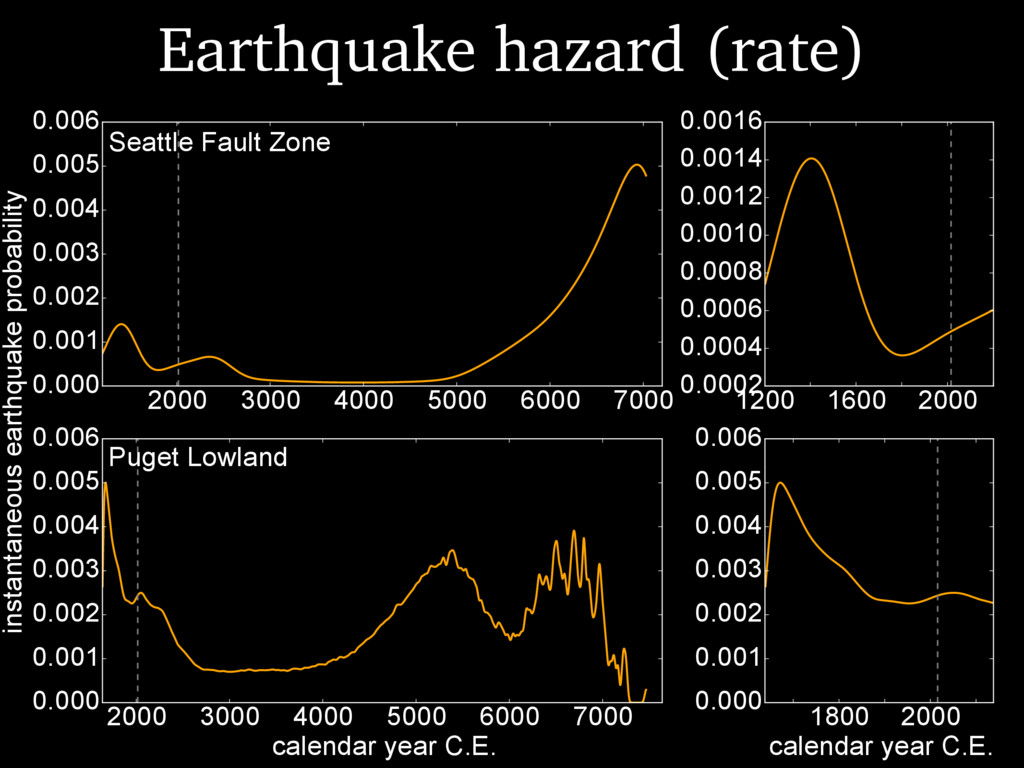
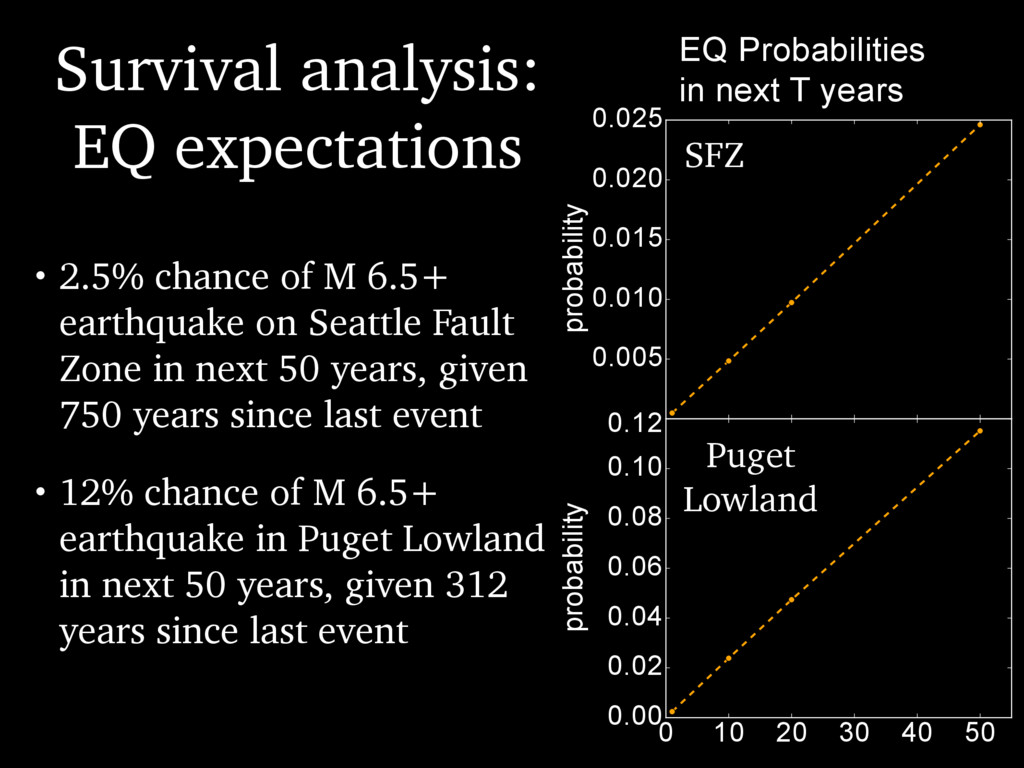
earthquake on Seattle Fault Zone in next 50 years, given 750 years since last event • 12% chance of M 6.5+ earthquake in Puget Lowland in next 50 years, given 312 years since last event 10 20 30 40 50 0.005 0.010 0.015 0.020 0.025 probability EQ Probabilities in next T years 0 10 20 30 40 50 0.00 0.02 0.04 0.06 0.08 0.10 0.12 probability SFZ Puget Lowland
Puget Lowland faults • Earthquake hazard is highest in decades following an earthquake • Previously-damaged infrastructure may be very risky • Mitigation plans need to account for repeated events
• Magnitudes between 6.5-7.5 for all events • Short modal recurrence (20-200 years), with longer (1000s of years) tails • Elevated seismic hazard following earthquake