Upgrade to Pro — share decks privately, control downloads, hide ads and more …

Estimating stresses, fault friction and fluid pressure from topography and coseismic slip models

Richard Styron
December 17, 2014

Estimating stresses, fault friction and fluid pressure from topography and coseismic slip models

Talk by Richard Styron and Eric Hetland from the American Geophysical Union conference, December 2014

Richard Styron

December 17, 2014
Tweet

More Decks by Richard Styron

Other Decks in Science

Transcript

  1. Estimating  stresses,  fault   friction  and  3luid  pressure   from

     topography  and   coseismic  slip  models Richard  Styron1  and  Eric  Hetland2   1Earth  Analysis,  Seattle  WA    2U.  Michigan
  2. Hypothesis:   If  topographic  stresses  modulate   fault  kinematics,  we

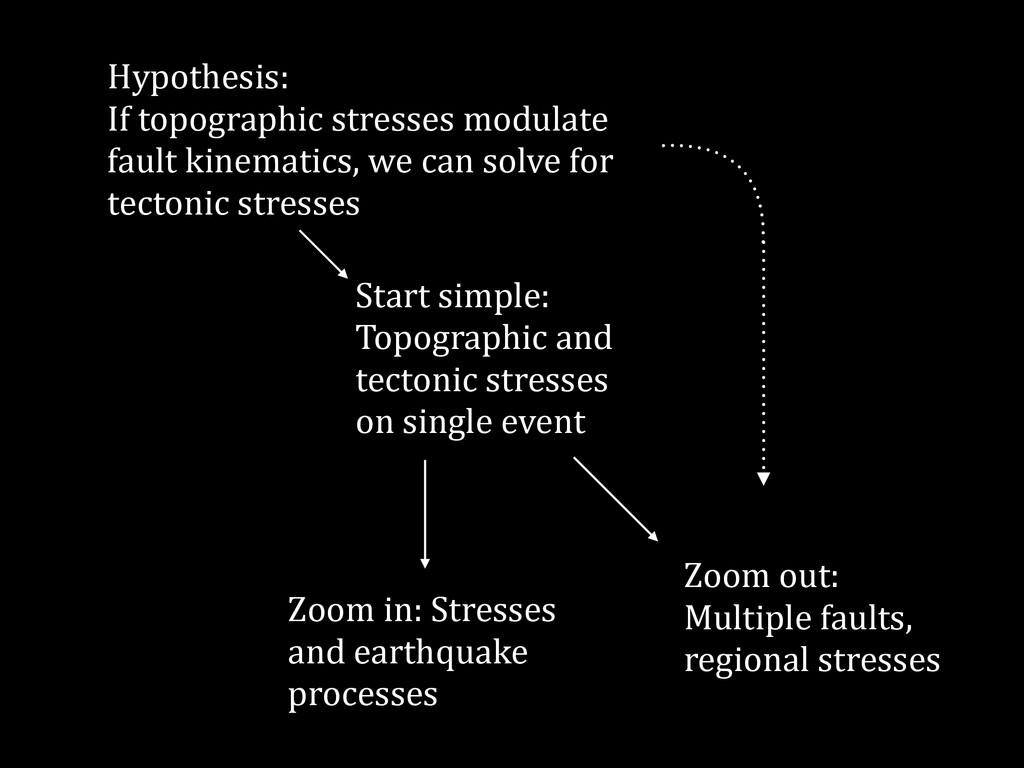
     can  solve  for   tectonic  stresses Start  simple:   Topographic  and   tectonic  stresses   on  single  event Zoom  in:  Stresses   and  earthquake   processes Zoom  out:   Multiple  faults,   regional  stresses
  3. Calculating  topographic   stress  3ields ‣ Convolve  solutions  for  point-­‐source

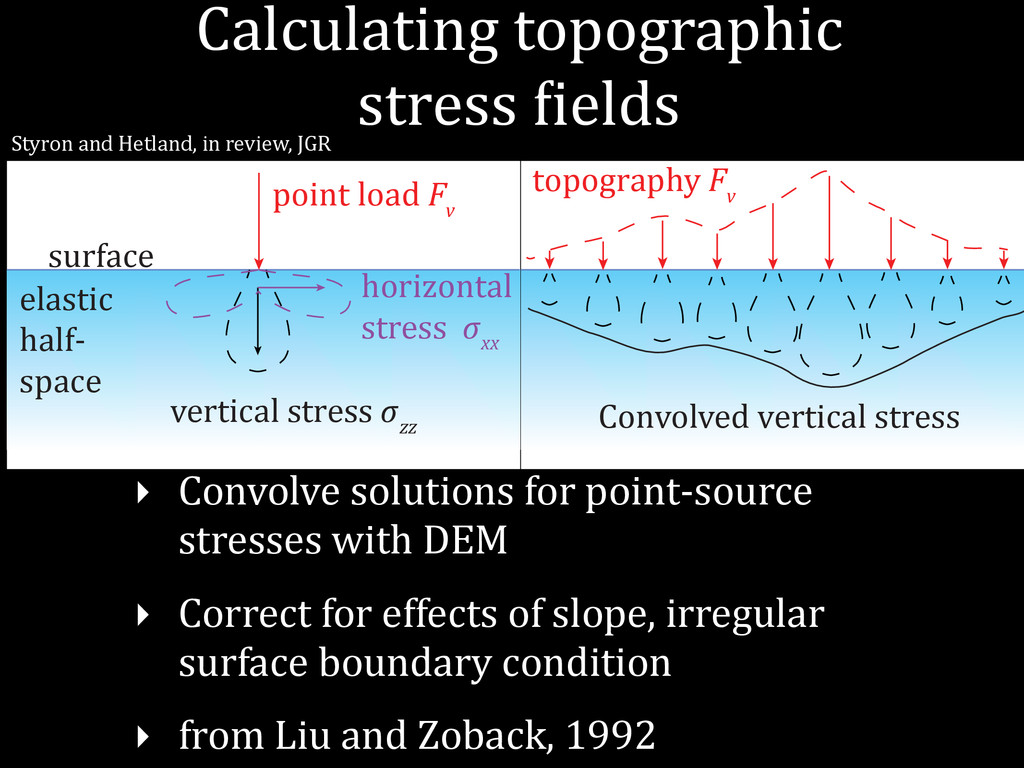
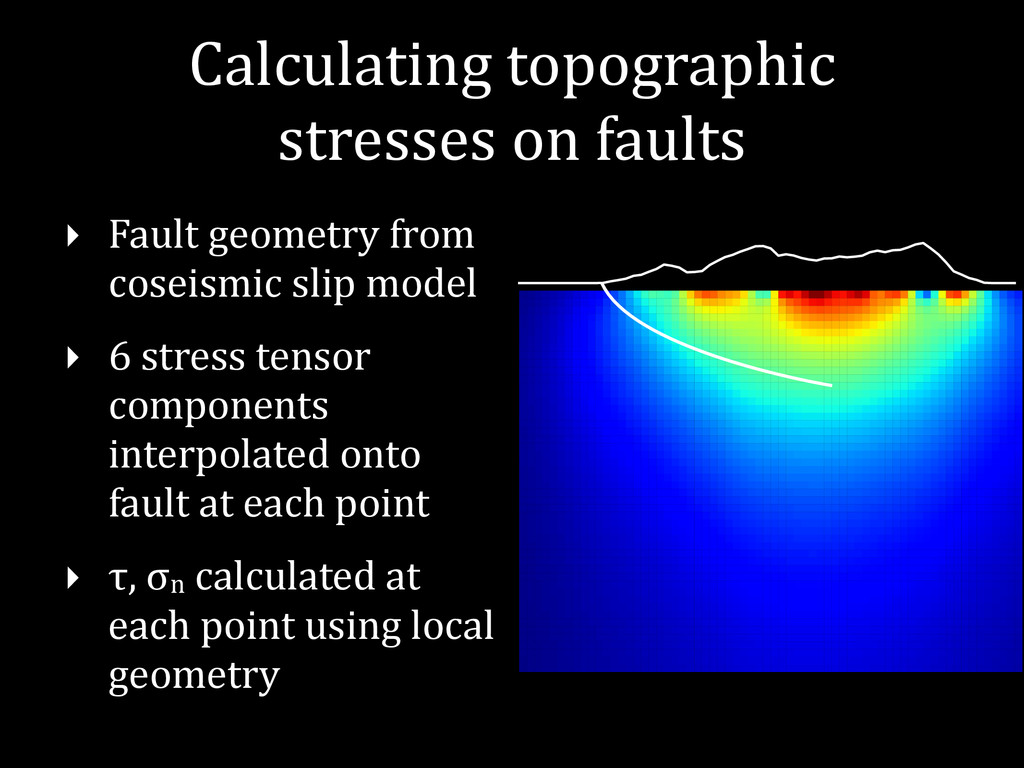
      stresses  with  DEM   ‣ Correct  for  effects  of  slope,  irregular   surface  boundary  condition   ‣ from  Liu  and  Zoback,  1992 point load F v surface horizontal stress σ xx vertical stress σ zz elastic half- space topography F v Convolved vertical stress Styron  and  Hetland,  in  review,  JGR
  4. Calculating  topographic   stresses  on  faults ‣ Fault  geometry  from

      coseismic  slip  model   ‣ 6  stress  tensor   components   interpolated  onto   fault  at  each  point   ‣ τ,  σn  calculated  at   each  point  using  local   geometry
  5. How  does  topography  affect   faulting? Topo  stress  with  shear

     sense Fault  with  slip  sense topographic  stresses   promote  slip topographic  stresses   resist  slip Styron  and  Hetland,  in  review,  JGR
  6. PF BF 101˚ 102˚ 103˚ 104˚ 105˚ 106˚ 107˚ 108˚

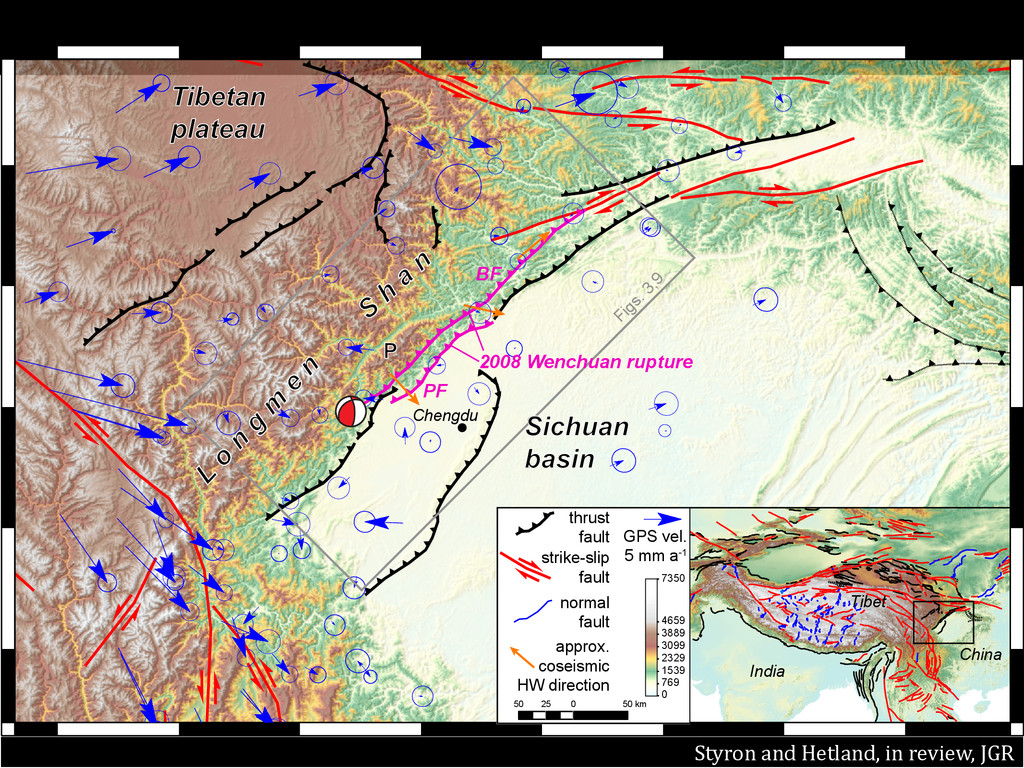
    ˚ ˚ ˚ ˚ ˚ 50 0 50 25 km 7350 4659 3889 3099 2329 1539 769 0 thrust fault strike-slip fault approx. coseismic HW direction India Tibet China normal fault GPS vel. 5 mm a-1 L o n g m e n S h a n 2008 Wenchuan rupture Tibetan plateau P Sichuan basin Chengdu Figs. 3,9 Styron  and  Hetland,  in  review,  JGR
  7. Topographic  shear  stresses  oppose   tectonic  slip reverse normal Coseismic

     dip  slip  (Feng  et  al  2010), up-­‐dip  topo.  shear  stress Styron  and  Hetland,  in  review,  JGR
  8. Topographic  normal  stress  high,   suppresses  tectonic  slip Coseismic  net

     slip  (Feng  et  al  2010), topo.  normal  stress Styron  and  Hetland,  in  review,  JGR
  9. Bayesian  tectonic  stress   inversions:  Priors ‣ Tectonic  stresses  considered

     horizontal,   linearly  increasing  with  depth   ‣ Maximum  (T’max),  Minimum  (T’min),   azimuth  of  T’max   ‣ Set  priors  for  each:   ‣ T’max:  0–2.5  or  0–3.5  *  ρgz   ‣ T’min:  0–1  or  -­‐1  –1  *  T’max   ‣ azimuth:  0–180°/360°
  10. Bayesian  tectonic  stress  inversions:   Likelihood  calculation  and  posterior  sampling

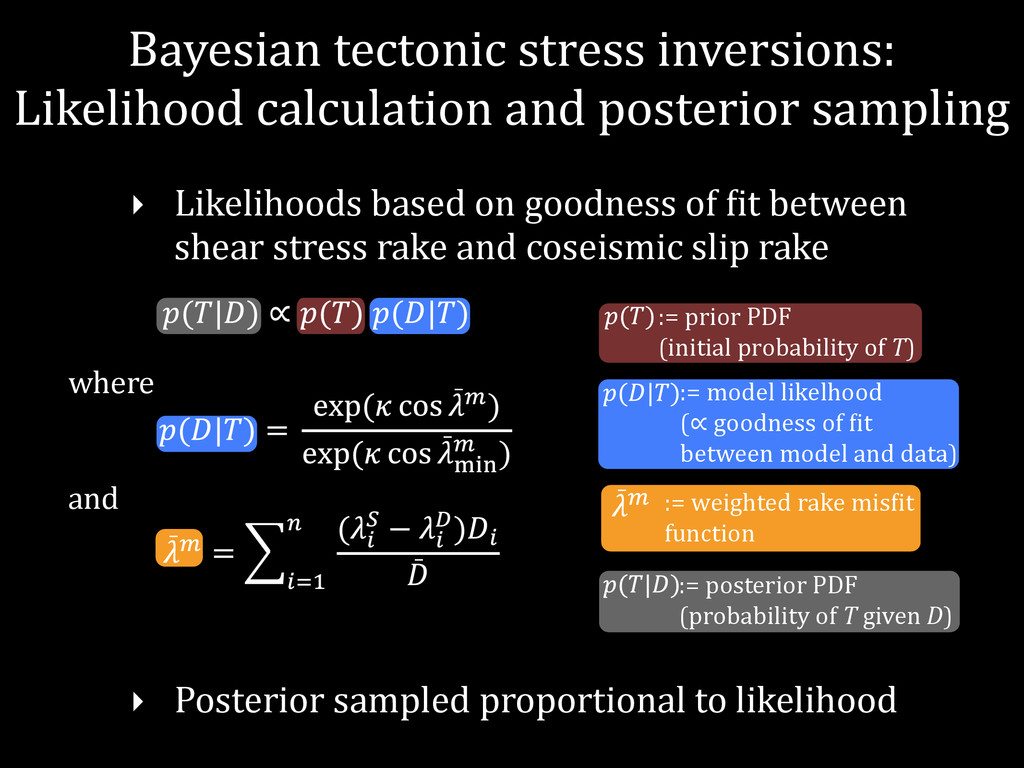
    ‣ Likelihoods  based  on  goodness  of  3it  between   shear  stress  rake  and  coseismic  slip  rake ̄ ̄ ̄ ) ̄ ) where and := posterior PDF (probability of T given D) := prior PDF (initial probability of T) := model likelhood (∝ goodness of �it between model and data) ̄ := weighted rake mis�it function ‣ Posterior  sampled  proportional  to  likelihood
  11. Fault  3luid  pressure  and   friction  inversion ‣ Sample  3luid

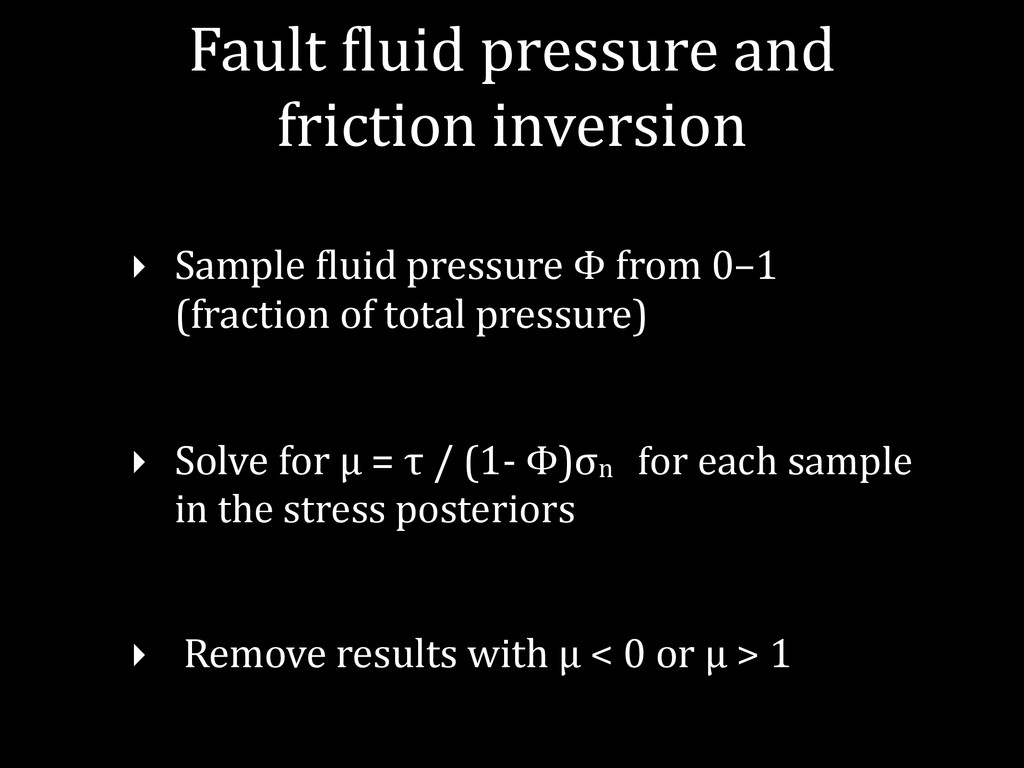
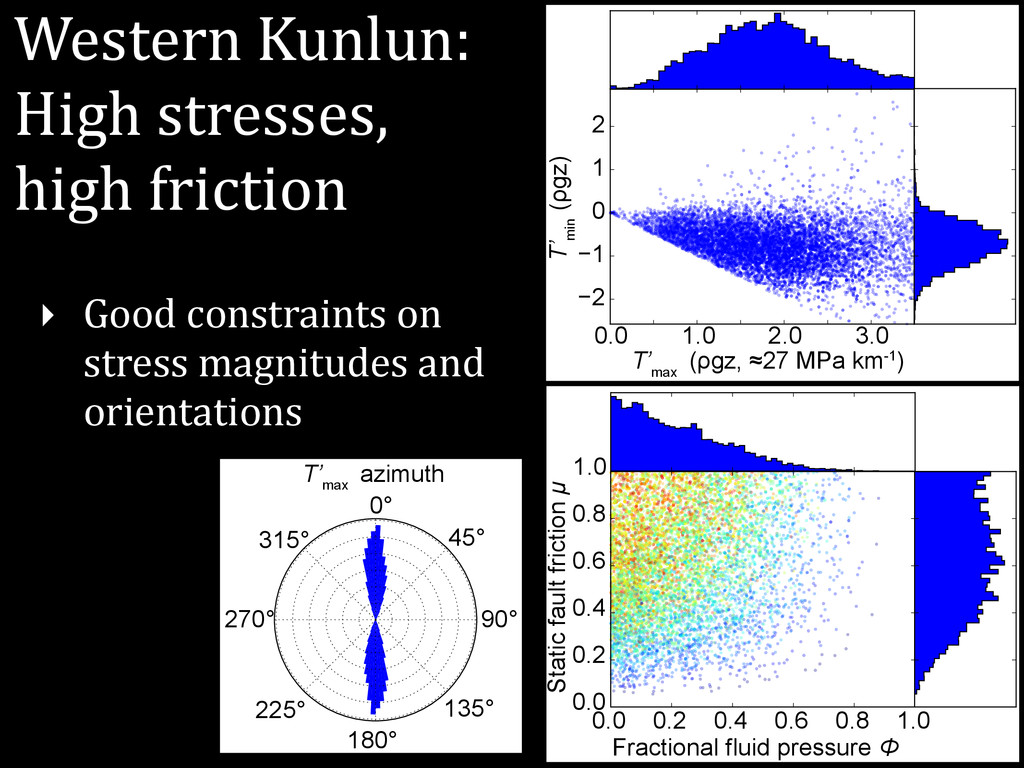
     pressure  Φ  from  0–1   (fraction  of  total  pressure)     ‣ Solve  for  μ  =  τ  /  (1-­‐  Φ)σn        for  each  sample   in  the  stress  posteriors     ‣  Remove  results  with  μ  <  0  or  μ  >  1
  12. 0.0 0.5 1.0 1.5 2.0 2.5 0.0 0.5 1.0 1.5

    2.0 2.5 T’ max (ρgz, ≈27 MPa km-1) T’ min (ρgz) 0° 45° 90° 135° 180° 225° 270° 315° Wenchuan  tectonic   stresses   ‣ T’max  ~E-­‐W   ‣ T’max  most  likely   0.6–1  ρgz   ‣ T’min  most  likely   0–0.4  ρgz Styron  and  Hetland,  in  review,  JGR
  13. Low  friction  and  3luid   pressure  on  Wenchuan  faults 0.0

    0.2 0.4 0.6 0.8 1.0 0.0 0.2 0.4 0.6 0.8 1.0 0.0 0.5 1.0 1.5 2.0 2.5 T’ max Fractional fluid pressure Φ Static fault friction μ ‣ μ  =  0.1–0.4   ‣ Φ  =  0–0.4   ‣ High  T’max     -­‐>  lo  Φ,  hi  μ Styron  and  Hetland,  in  review,  JGR
  14. Our  results,  World   Stress  Map  agree   well 103°

    104° 104° 105° 106° 105° 103° 102° 32° 32° 31° 31° 30° 30° 33° 33° 106° σ Hmax from WSM N σM+T Hmax (black, 80 MPa σM+T Hmin (red), σM+T zz ,40 MPa, 5 km depth σ Hmax from WFSD-1 ‣ Pre-­‐EQ  stresses  from   WSM,  our  results  all  E-­‐W   ‣ Post-­‐EQ  stresses  from   drilling  are  rotated  ~35°   CW WSM:  Heidbach  et  al  2009 Styron  and  Hetland,  in  review,  JGR
  15. Fault  type  modulated     by  topography? normal strike–slip thrust

    Kunlun Shan Tarim Basin M 6.9 14 Feb 2014 Mw 7.1 21 Mar 2008
  16. Three  faults  in  stress  inversion normal strike–slip thrust Kunlun Shan

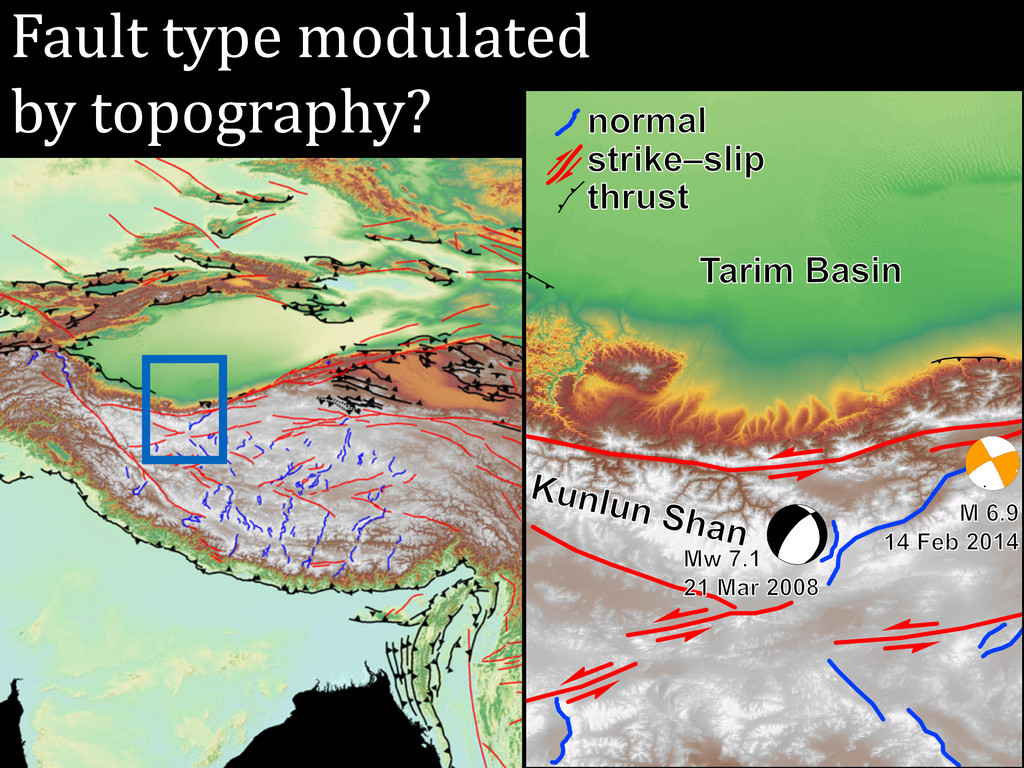
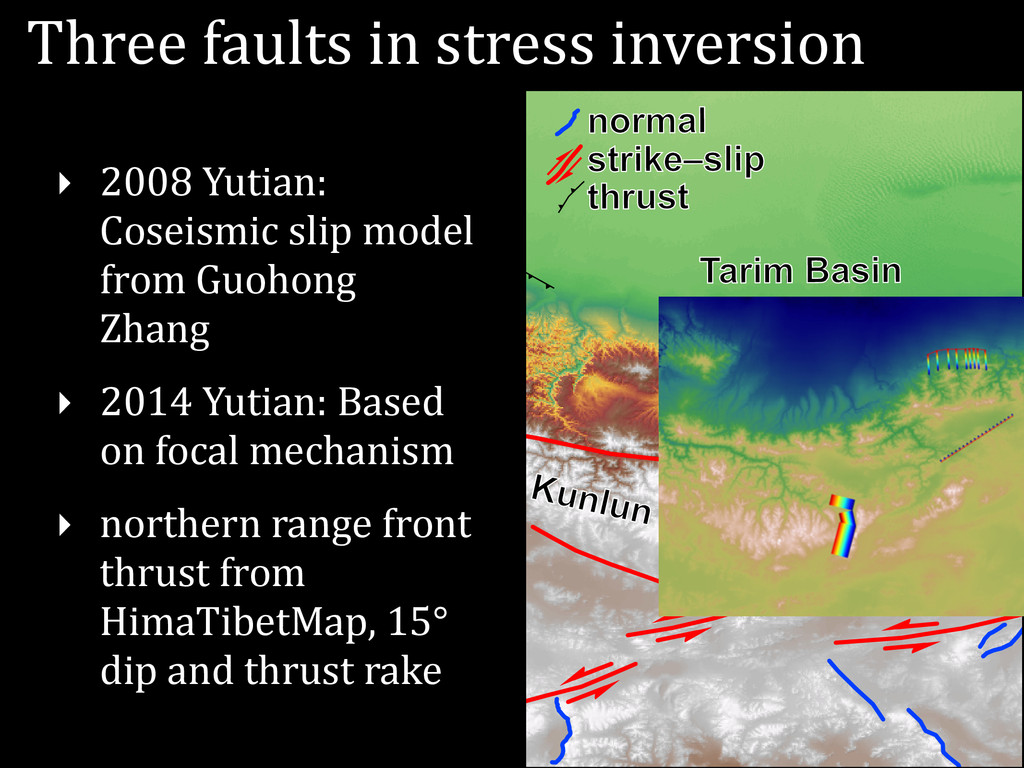
    Tarim Basin M 6.9 14 Feb 2014 Mw 7.1 21 Mar 2008 ‣ 2008  Yutian:   Coseismic  slip  model   from  Guohong   Zhang   ‣ 2014  Yutian:  Based   on  focal  mechanism   ‣ northern  range  front   thrust  from   HimaTibetMap,  15°   dip  and  thrust  rake
  17. Western  Kunlun:   High  stresses,     high  friction 0.0

    1.0 2.0 3.0 −2 −1 0 1 2 T’ max (ρgz, ≈27 MPa km-1) T’ min (ρgz) 0.0 0.2 0.4 0.6 0.8 1.0 0.0 0.2 0.4 0.6 0.8 1.0 Fractional fluid pressure Φ Static fault friction μ 0° 45° 90° 135° 180° 225° 270° 315° T’ max azimuth ‣ Good  constraints  on   stress  magnitudes  and   orientations
  18. Summary  and  future   directions ‣ Topographic  stresses  are  signi3icant,

     and  can  effect   earthquake  slip  distributions   ‣ Look  at  how  faults  rupture  under  these   heterogeneous  stresses:  slip  distribution,   recurrence  intervals,  rupture  segmentation   ‣ Looking  for  rupture  modelers:  contact  me  please!   ‣ Topographic  stresses  and  coseismic  slip  models  can   provide  strong  constraints  on  allowable  tectonic   stresses  and  fault  properties   ‣ Look  at  regional  stress  patterns,  geodynamics,   ‣ Variation  of  fault  properties  with  geologic  context