Upgrade to Pro — share decks privately, control downloads, hide ads and more …

Measuring Web Performance - ALT.NET Sessions Night Dec '14

cowchimp
December 29, 2014

Measuring Web Performance - ALT.NET Sessions Night Dec '14

is your site as fast as you think?

cowchimp

December 29, 2014
Tweet

More Decks by cowchimp

Other Decks in Programming

Transcript

  1. • Just around the corner • We build shopyourway.com •

    Serverside is (mainly) .net • Hiring!!! 15%
  2. “No science attains maturity until it acquires methods of measurement”

    - Dr. Logan Clendening MEASUREMENT (science wins!) 18%
  3. Only 10-20% of the end user response time is spent

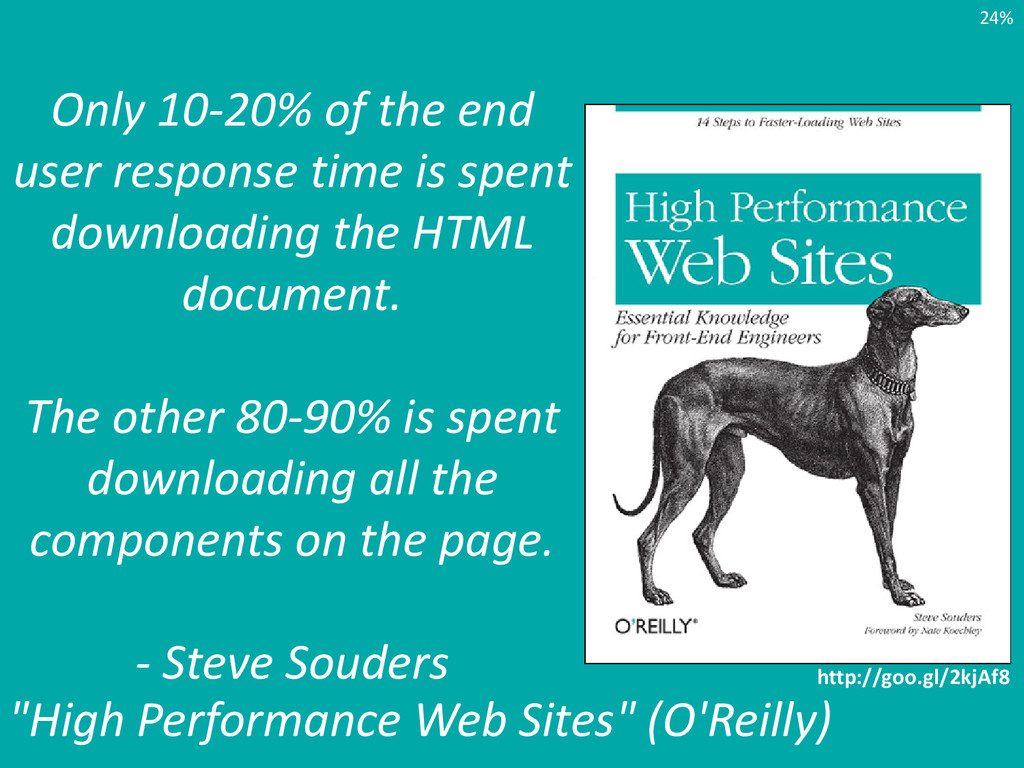
    downloading the HTML document. The other 80-90% is spent downloading all the components on the page. - Steve Souders "High Performance Web Sites" (O'Reilly) http://goo.gl/2kjAf8 24%
  4. http://flic.kr/p/62hNF6 Metrics We need to be consistent in • What

    point in time? • What is the cache status? • What machine do we use? (location, connection, browser) • Based on how many samples? cb 27%
  5. http://flic.kr/p/62hNF6 Example Metric • x = Page load time -

    Navigation start time • Of cached view • As measured by Webpagetest • Running a Chrome with a DSL connection in Virginia cb 30%
  6. http://flic.kr/p/62hNF6 from start until... • Time to First Byte (TTFB)

    • Start Render • Page Load (aka Load time) cb Top Level Metrics 33%
  7. Good enough? • These metrics do a good job at

    measuring generic network\browser events • But do they do a good job of reflecting the User Experience? http://goo.gl/2hIlGQ 36%
  8. Source: http://goo.gl/kJF9JU Video frame analysis WPT captures screenshots at 10

    frames / 1 sec 3.3 s 2.8 s 2.2 s 0.0 s 7.6 s 4.2 s 4.0 s 3.6 s 57%
  9. Source: http://goo.gl/kJF9JU Video frame analysis For each frame it calculates

    % of visual completeness compared the last frame 60%
  10. Source: http://goo.gl/kJF9JU “Speed Index” • New metric defined by WPT

    • Provides an excellent representation of the User Experience • Aggregates the visual completeness score of all frames into 1 final score 63%
  11. var startDate = new Date().getTime(); $(window).on('load', function() { var endDate

    = new Date().getTime(); var diff = endDate - startDate; $.ajax('/-/my-rum-endpoint', { url: window.location.href, pageLoad: diff }); }); Poor Man’s RUM 75%
  12. $(window).on('load', function() { var pageName = $('body').attr('id'); var t =

    window.performance.timing; var diff = t.loadEventStart - t.navigationStart; var url = baseUrl + '?' + pageName + '=' diff; new Image().src = url; }); Do It Yourself grafana.org
  13. Timing Browser APIs • New browser APIs –Navigation timing –Resource

    Timing –User Timing measure custom events with performance.mark("task1") • navigationStart is the real navigation start Spec: http://goo.gl/c79glK 84%
  14. • Identify a scenario which optimizing will move the needle

    of a business metric • Measure the scenario • Calculate light speed • Approach the speed of light http://flic.kr/p/bF1gCw cbn By Tony Gentilcore AN ENGINEER'S GUIDE TO OPTIMIZATION Source: http://goo.gl/B6ePS2 90%