Upgrade to Pro — share decks privately, control downloads, hide ads and more …

Observability to the rescue! Monitoring and testing APIs with OpenTelemetry

Observability to the rescue! Monitoring and testing APIs with OpenTelemetry

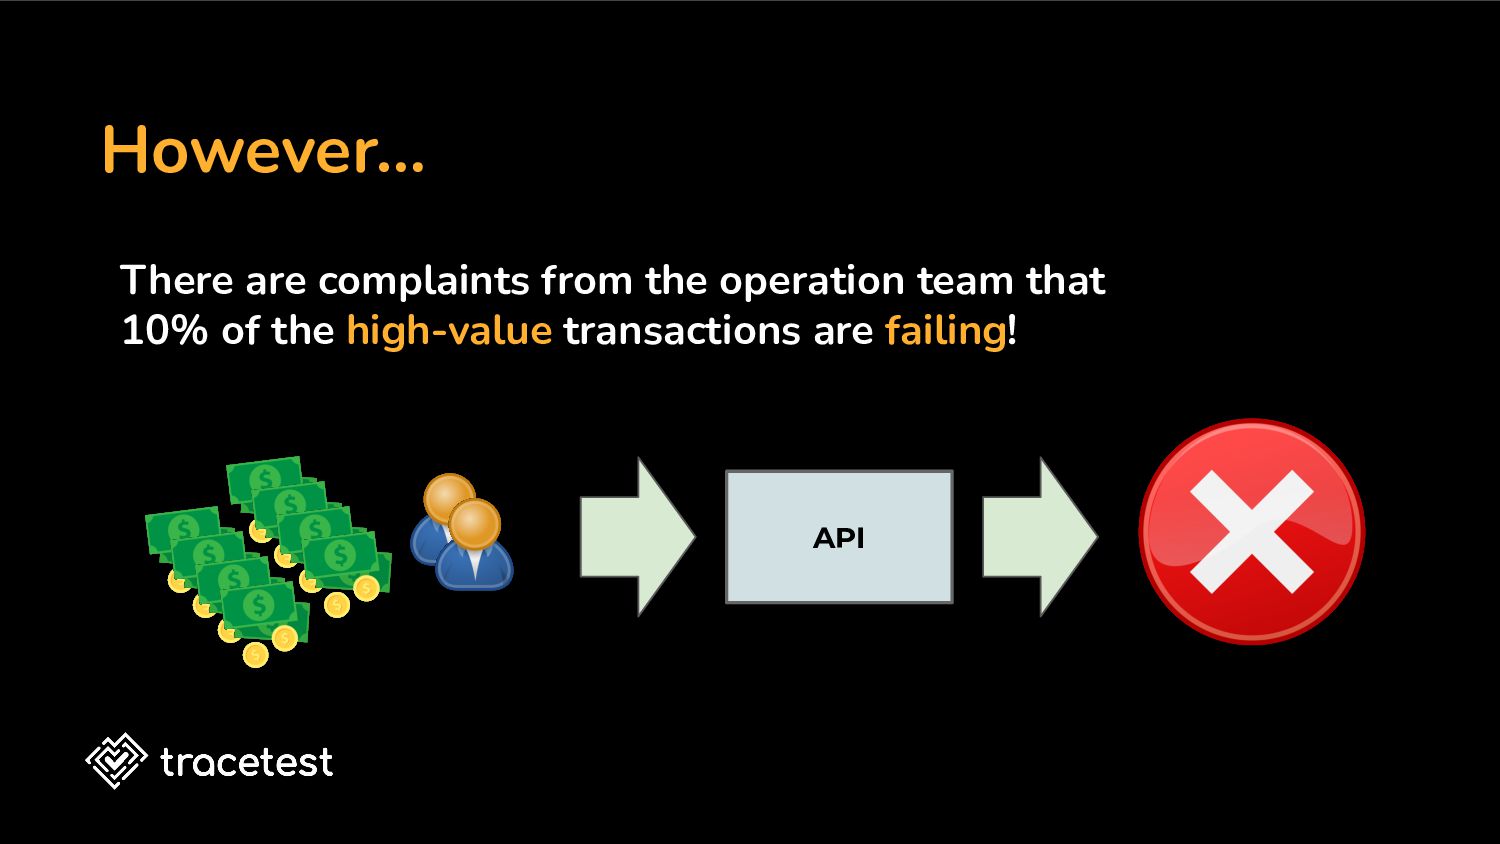
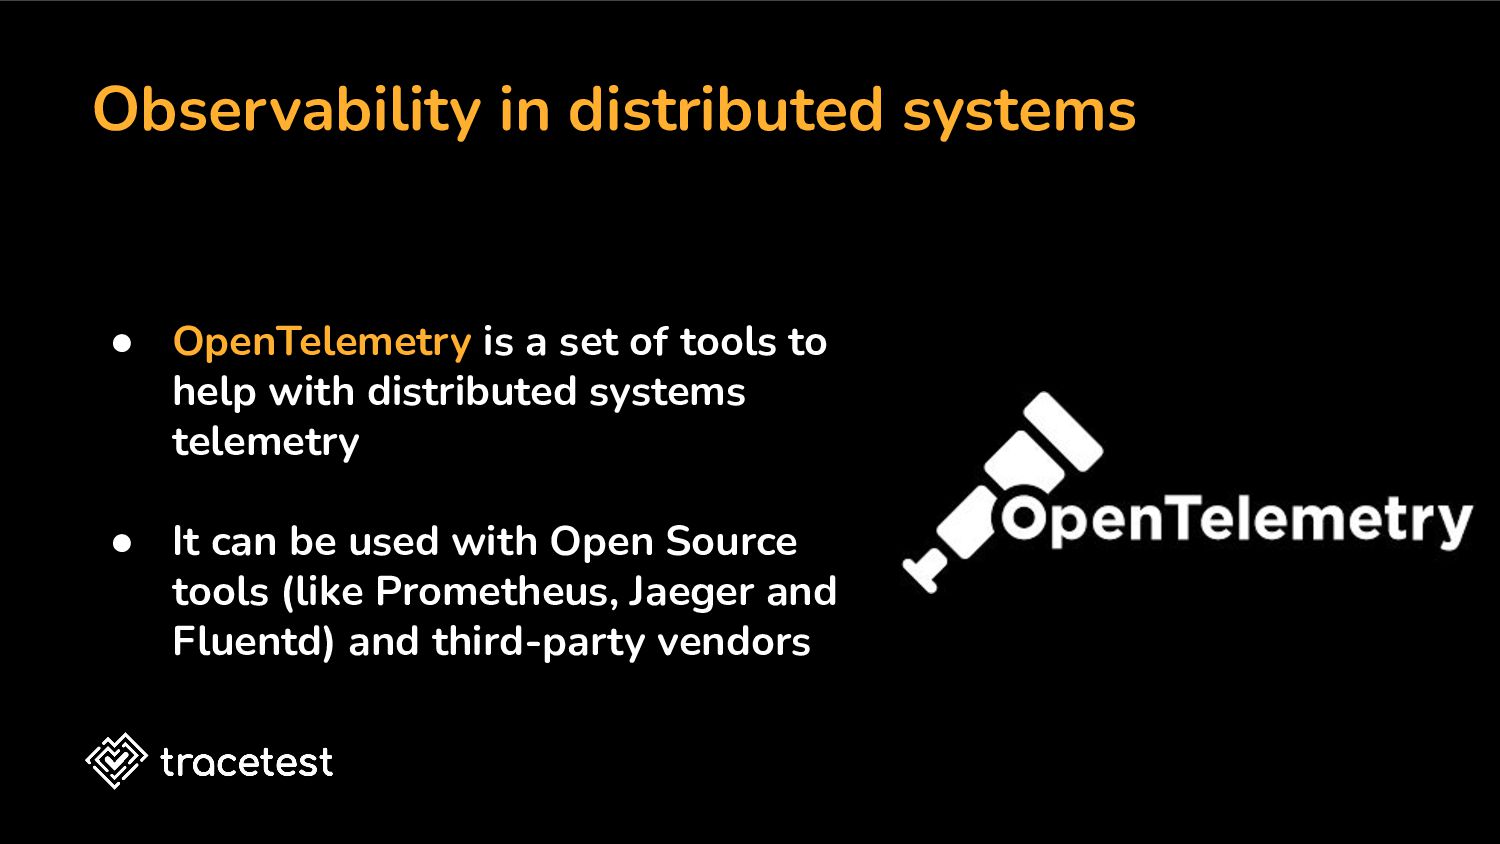
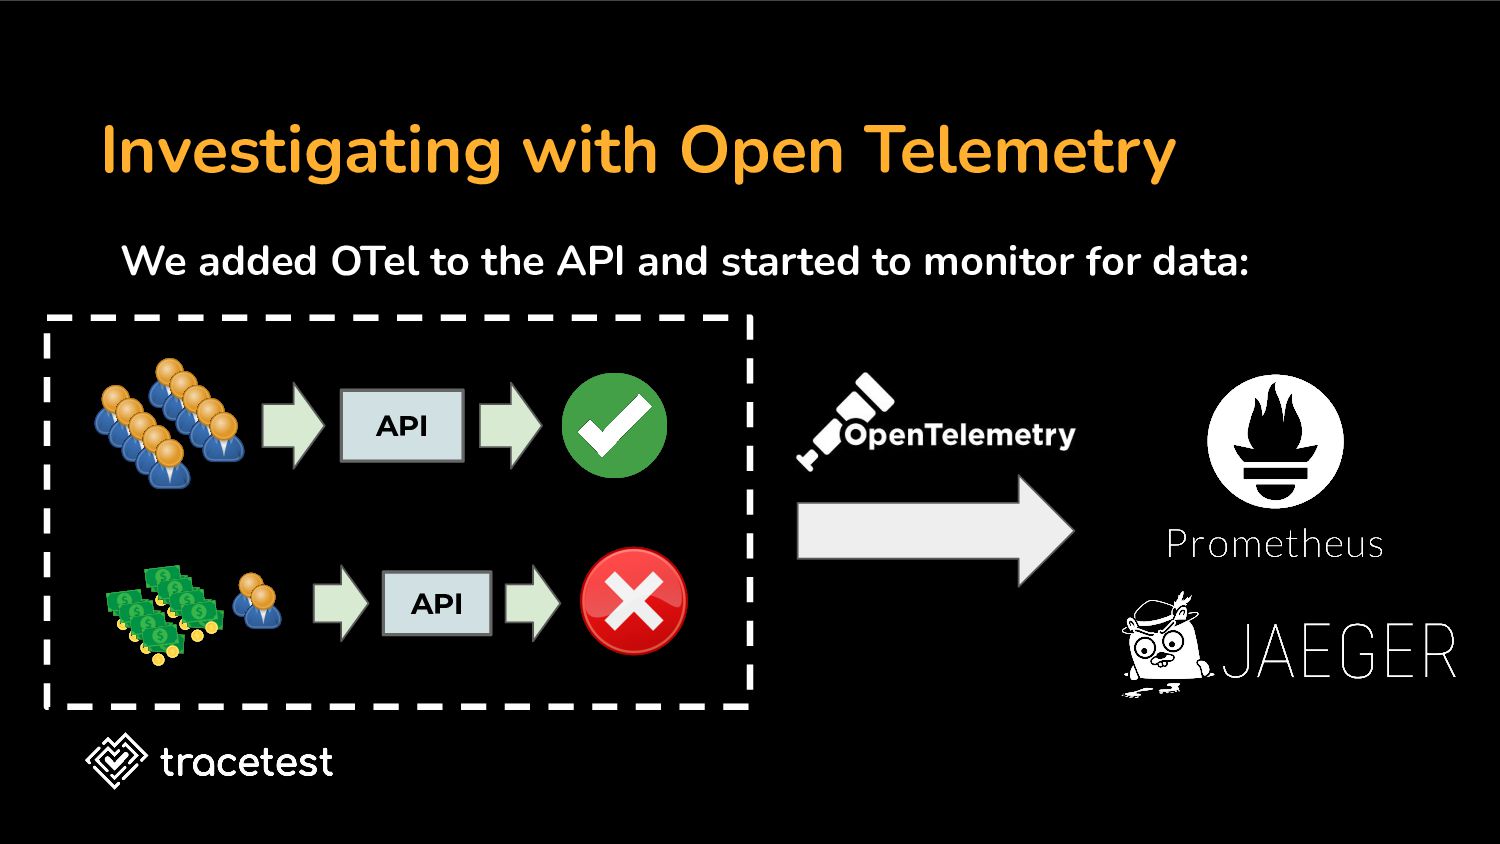
Checking the state of an API in production can be challenging. You can have different factors and infrastructures to deal with, making it hard to pinpoint problems on your API. In this talk, I'll show how you can set up OpenTelemetry to help monitor your API and even test it to guarantee that your application is healthy.

Daniel Baptista Dias

June 21, 2023
Tweet

More Decks by Daniel Baptista Dias

Other Decks in Programming

Transcript

  1. About the presenter Daniel Dias ❏ Software Engineer at tracetest.io

    ❏ 󰎙 developer, living in 󰎆 ❏ Doctorate student, passionate about building Dev Tools ❏ Linkedin: @danielbdias ❏ Github: @danielbdias
  2. A scenario: User-facing API You are a developer of a

    Payment Order API that interacts with a Payment Ecosystem, split into multiple services with different owners and languages Payment Order API Payment Executor Wallet Risk Analysis … Payment Providers Code: https://github.com/kubeshop/tracetest/tree/main/examples/observability-to-the-rescue
  3. A scenario: User-facing API As users access the system, your

    API scales and supports thousands of requests per hour API
  4. However… There are complaints from the operation team that 10%

    of the high-value transactions are failing! API
  5. You start to investigate • The unit tests for this

    case are successful • Tests done on your staging environment don't show any problem • What about testing in production?
  6. You start to investigate • The unit tests for this

    case are successful • Tests done on your staging environment don't show any problem • What about testing in production? ◦ It is expensive and risky!
  7. What is Observability? Observability is the ability to measure the

    internal states of a system by examining its outputs. API Payment Executor Wallet Risk Analysis … Payment Providers System State
  8. • OpenTelemetry is a set of tools to help with

    distributed systems telemetry • It can be used with Open Source tools (like Prometheus, Jaeger and Fluentd) and third-party vendors Observability in distributed systems
  9. Observability concept: Metrics Metrics Metrics are aggregations over a period

    of time of numeric data about your infrastructure or application. Examples include: system error rate, CPU utilization, request rate for a given service. – Metrics on OpenTelemetry.io
  10. Observability concept: Logs A log is a timestamped message emitted

    by services or other components. – Logs on OpenTelemetry.io Logs
  11. Observability concept: Traces Traces A distributed trace, records the paths

    taken by requests as they propagate through multi-service architectures, like microservice and serverless applications. – Traces on OpenTelemetry.io
  12. Implementing OTel in our App • We can start instrumenting

    our App with one of the OpenTelemetry SDKs, written in many languages: See https://opentelemetry.io/docs/instrumentation/ for more details
  13. Investigating with Open Telemetry We added OTel to the API

    and started to monitor for data: API API
  14. Investigating with data After looking at your instrumentation: • You

    notice that your metrics are normal on Prometeus. • However, looking at the failed traces on Jaeger you find a curious behavior…
  15. Found it! • You discover that an input parameter set

    as 0 is propagated and causes a chain of errors: ◦ Risk Analysis API send a inconsistent case ◦ Both top services crashes because of it • Now we just need to handle this parameter and talk with other teams about this behavior.
  16. • Concept shown by Ted Young, on the 2018 “Trace

    driven development” presentation. • Traces can be obtained independently of the transaction failing or not, and the metadata can be evaluated to check if they are logged as expected. • We can define a test specification to validate these traces. Trace-based Testing
  17. Tracetest • Open-source tool used to do Trace-based tests •

    Located on the tracing quadrant of CNCF landscape • Uses a test specification based on trace selector and assertions
  18. How it works Payment Order API Payment Executor Wallet Risk

    Analysis … Payment Providers Tracetest Runner API call to start a test
  19. How it works Payment Order API Payment Executor Wallet Risk

    Analysis … Payment Providers Tracetest Runner OTel Tracing data OTel Tracing data
  20. How it works Payment Order API Payment Executor Wallet Risk

    Analysis … Payment Providers Tracetest Runner Assertion on OTel Tracing data
  21. How it works Tracetest Runner • Tracetest summarizes the data

    and returns the assertion results for us: ◦ We have three assertions in this test, one for each API involved on the call. ◦ We notice that due to "Risk Analysis" breaking with an invalid value, the other two APIs break as well.
  22. Trace-based testing advantages • Test against real data • No

    need to spend time on mocks • No black boxes when testing, you can observe your system as it is
  23. To know more: • OpenTelemetry: https://opentelemetry.io/ • Jaeger Tracing: https://www.jaegertracing.io/

    • Prometheus: https://prometheus.io/ • Example API in this presentation: ◦ https://github.com/kubeshop/tracetest/tree/main/examples/observability-to-the-rescue