Upgrade to Pro — share decks privately, control downloads, hide ads and more …

Electricity consumption and household characteristics: Implications for census-taking in a smart metered future (MRS CGG 2016)

Electricity consumption and household characteristics: Implications for census-taking in a smart metered future (MRS CGG 2016)

Invited presentation to the MRS Census and Geodemographics Group Meeting on 'Can Big Data replace the Census?', March 10, 2016

More: https://www.mrs.org.uk/resources/cgg/events/bigdata

Ben Anderson

March 10, 2016
Tweet

More Decks by Ben Anderson

Other Decks in Science

Transcript

  1. Electricity consumption and household characteristics: Implications for census-taking in a

    smart metered future Ben Anderson ([email protected], @dataknut) Sharon Lin ([email protected]) Engineering & Environment (Energy & Climate Change)
  2. Transformative Research Programme: #Census2022 www.energy.soton.ac.uk/tag/census2022/ The menu § Background §

    Smart meter electricity data § Example: – Inferring household attributes § Implications § Where next? 2
  3. Transformative Research Programme: #Census2022 www.energy.soton.ac.uk/tag/census2022/ Background •Timeliness & cost •Indicators

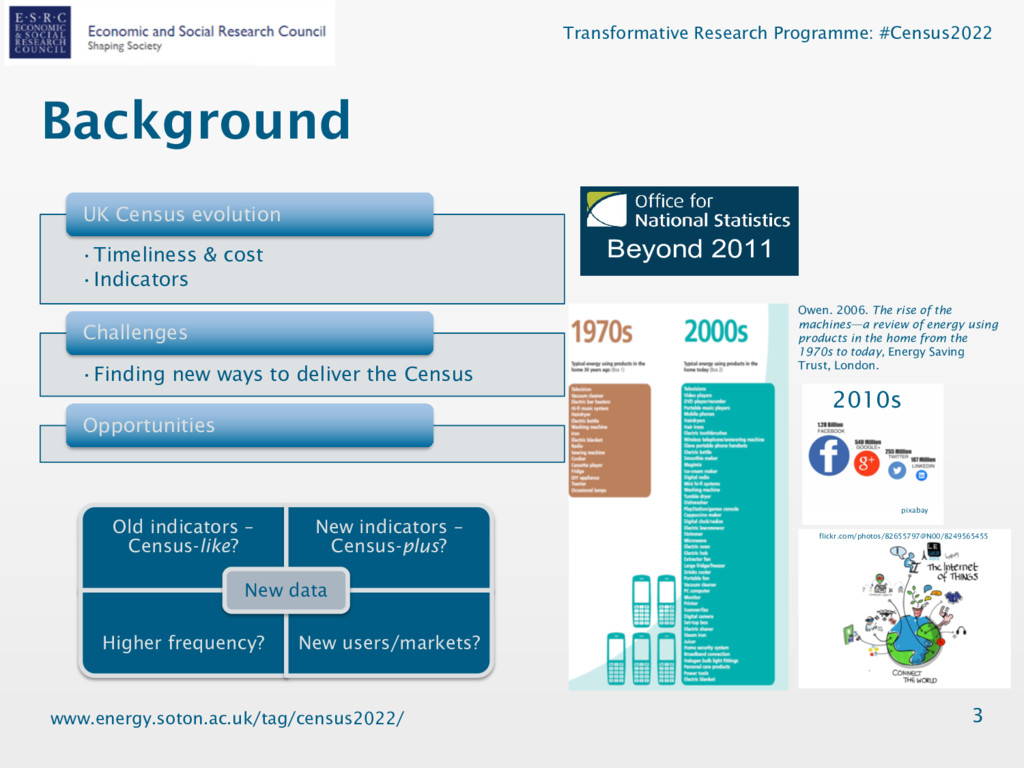
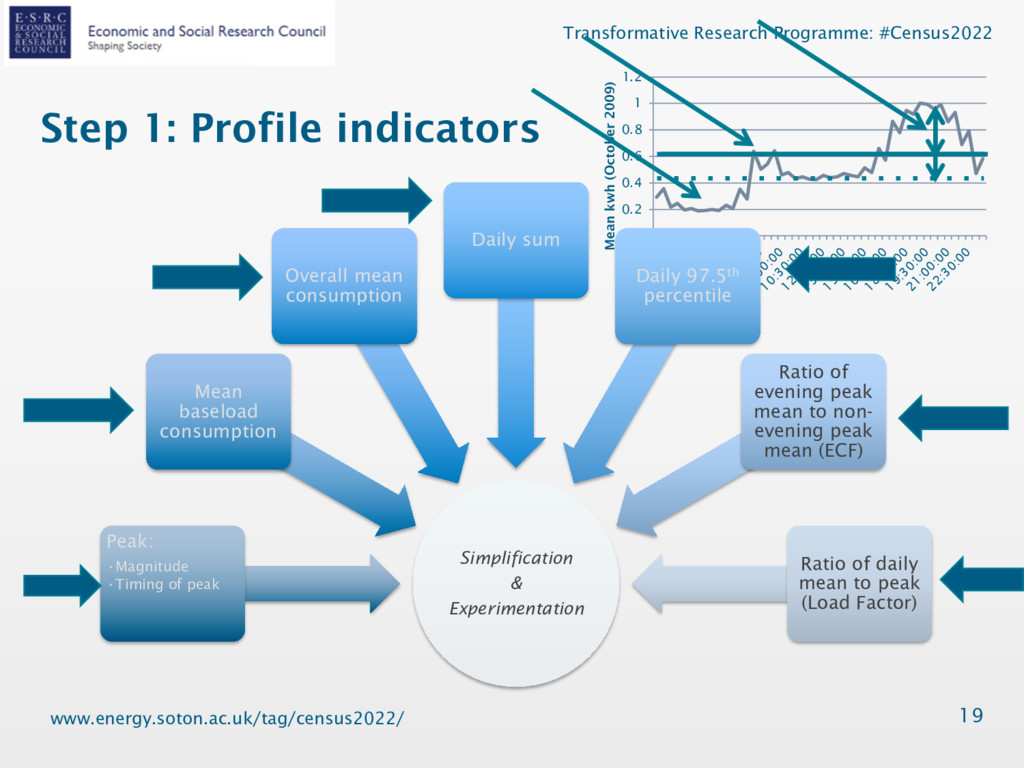
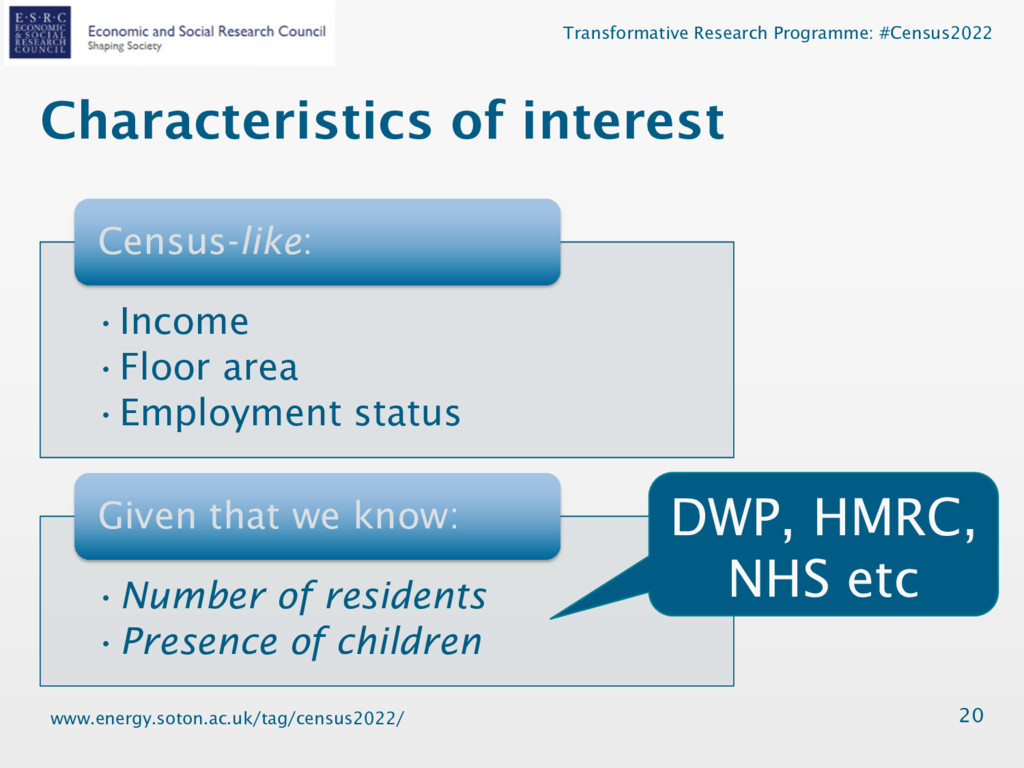
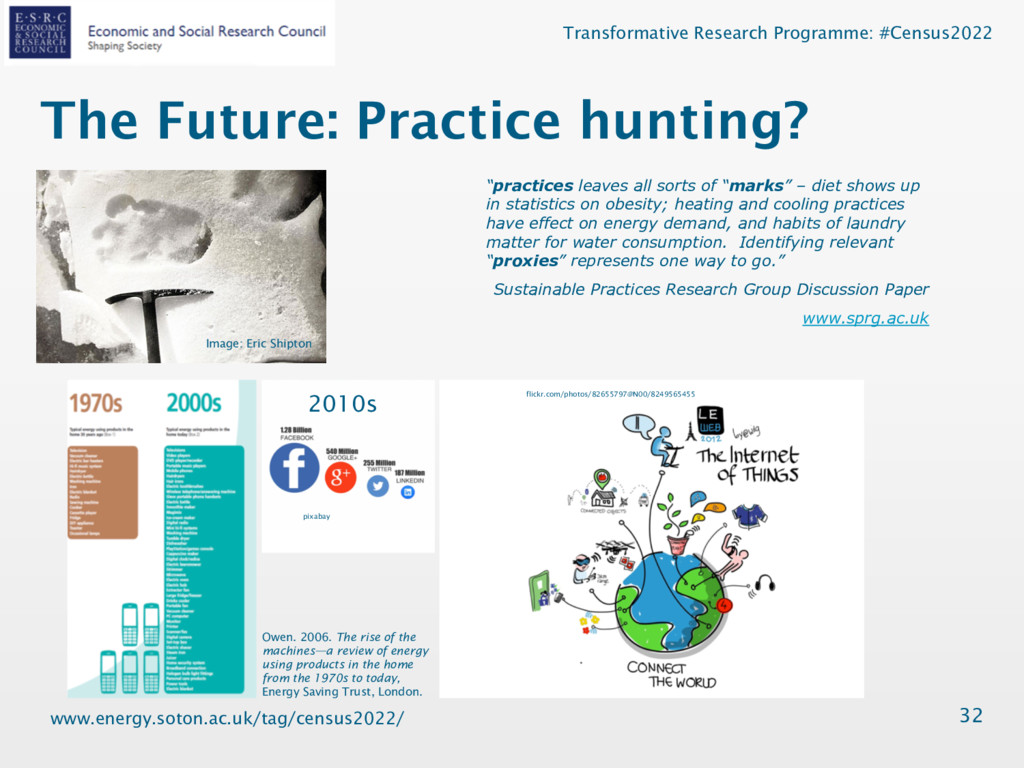
    UK Census evolution •Finding new ways to deliver the Census Challenges Opportunities 3 Beyond 2011: Administrative Data Models - R Aggregate Data Martin Ralphs, Meghan Elkin, Simon Whitworth, Jennifer Wall, Domen Huynh Background The Office for National Statistics is currently taking a fresh look at o population and small area socio-demographic statistics for England an Programme has been established to carry out research on the options way forward to meet future user needs. Improvements in technology and administrative data sources o modernise the existing census process, or to develop an alternativ already held within government. Since methods for taking the tra relatively well understood most of the research is focussing on how su by better re-use of ‘administrative’ data already collected from the publ The final recommendation, which will be made in 2014, will balanc statistical quality, and the public acceptability of all of the options. The for all population-based statistics in England and Wales and, potentia as a whole. About this paper This paper reports findings from trials of models that estimate populatio counts by age and sex at national and local level using aggregated adm the rationale for the models, describes the methods that have been ap of how the estimates that they produce compare with 2011 Census pop the unadjusted administrative data. Beyond 2011 Beyond 2011: Administrative Data Models - Research Using Aggregate Data Martin Ralphs, Meghan Elkin, Simon Whitworth, Jennifer Wall, Domenica Rasulo and Jennifer Huynh Background The Office for National Statistics is currently taking a fresh look at options for the production of population and small area socio-demographic statistics for England and Wales. The Beyond 2011 Programme has been established to carry out research on the options and to recommend the best way forward to meet future user needs. Improvements in technology and administrative data sources offer opportunities to either modernise the existing census process, or to develop an alternative by re-using existing data already held within government. Since methods for taking the traditional census are already relatively well understood most of the research is focussing on how surveys can be supplemented by better re-use of ‘administrative’ data already collected from the public. The final recommendation, which will be made in 2014, will balance user needs, cost, benefit, statistical quality, and the public acceptability of all of the options. The results will have implications for all population-based statistics in England and Wales and, potentially, for the statistical system as a whole. About this paper This paper reports findings from trials of models that estimate population totals and sub group counts by age and sex at national and local level using aggregated administrative data. It sets out the rationale for the models, describes the methods that have been applied and gives an overview Owen. 2006. The rise of the machines—a review of energy using products in the home from the 1970s to today, Energy Saving Trust, London. flickr.com/photos/82655797@N00/8249565455 2010s pixabay Old indicators – Census-like? New indicators – Census-plus? Higher frequency? New users/markets? New data
  4. Transformative Research Programme: #Census2022 www.energy.soton.ac.uk/tag/census2022/ Distribution of Gas Central Heating,

    Census 2011 Source: http://datashine.org.uk Special interest: Electricity •Unlike gas (c. 90%) Near universal availability •Unlike gas (c. 85%) Near universal uptake •Unlike water (c. 45%) 100% metered 4
  5. Transformative Research Programme: #Census2022 www.energy.soton.ac.uk/tag/census2022/ Distribution of Gas Central Heating,

    Census 2011 Source: http://datashine.org.uk children are present show more pronounced morning peak demand, potentially driven by routines associated with preparation for school. Even if the underlying cause of these observed such as cooking (Yohanis et al., 2008). Figure 3 supports this to an extent, yet daytime loads among ‘inactive’ households are not noticeably higher than those in employment although we Figure 2. Household load profiles by household composition. Collecting Population Statistics via Smart Metered Electricity Load Data Special interest: Electricity •Unlike gas (c. 90%) Near universal availability •Unlike gas (c. 85%) Near universal uptake •Unlike water (c. 45%) 100% metered 5
  6. Transformative Research Programme: #Census2022 www.energy.soton.ac.uk/tag/census2022/ Inspiration I: Census-like 6 Census

    2011 household level variables* Existing evidence for links to load profiles Household Number of persons (Beckel et al., 2013) Presence of person with limiting long term illness Number of children (Yohanis et al., 2008) Age distributions of all persons Dwelling Household dwelling type (Firth et al., 2008; McLoughlin et al., 2012) Household tenure (Druckman and Jackson, 2008) Number of (bed)rooms dwelling floor area as a proxy Number of cars/vans Presence of and fuel used for heating (McLoughlin et al., 2013) Householder Ethnic group/country of birth of HRP/main language Age of HRP (McLoughlin et al., 2013) NS-SEC of household reference person (HRP) (Druckman and Jackson, 2008; Hughes and Moreno, 2013; McLoughlin et al., 2013) Economic activity of HRP/hours worked (Yohanis et al., 2008; McLoughlin et al., 2013) HRP Education level Marital Status * Taken from ONS. 2014a. 2011 Census User Guide - 2011 Census Variable and Classification Information: Part 3. Newport: Office for National Statistics. Using ‘profile indicators’
  7. Transformative Research Programme: #Census2022 www.energy.soton.ac.uk/tag/census2022/ Inspiration II: Census-plus 7 Census-plus

    indicators Existing evidence for links to load profiles Other Dwelling floor area (Beckel et al., 2013; Craig et al., 2014; McLoughlin et al., 2013) Household Income (Beckel et al., 2013; Craig et al., 2014; McLoughlin et al., 2013) Consumption profile segments Haben et al (2013) Indicators of routine ? Using ‘profile indicators’ Source: Newing, Andy, Ben Anderson, AbuBakr Bahaj, and Patrick James. 2015. ‘The Role of Digital Trace Data in Supporting the Collection of Population Statistics - the Case for Smart Metered Electricity Consumption Data’. Population, Space and Place, July, doi:10.1002/psp.1972.
  8. Transformative Research Programme: #Census2022 www.energy.soton.ac.uk/tag/census2022/ Inspiration III: Data 8 Data:

    UoS Small Scale Smart Meter Trial (n = 95) ildren are present show more pronounced orning peak demand, potentially driven by utines associated with preparation for school. en if the underlying cause of these observed haviours are uncertain, Figure 2 suggests that y household compositional indicators such as such as cooking (Yohanis et al., 2008). Figure 3 supports this to an extent, yet daytime loads among ‘inactive’ households are not noticeably higher than those in employment although we should remember that we are representing an en- tire household’s employment status via that of Figure 2. Household load profiles by household composition. llecting Population Statistics via Smart Metered Electricity Load Data Source: Newing, Andy, Ben Anderson, AbuBakr Bahaj, and Patrick James. 2015. ‘The Role of Digital Trace Data in Supporting the Collection of Population Statistics - the Case for Smart Metered Electricity Consumption Data’. Population, Space and Place, July, doi:10.1002/psp.1972.
  9. Transformative Research Programme: #Census2022 www.energy.soton.ac.uk/tag/census2022/ Inspiration IV: Data 9 Weekdays

    Weekends Source: Irish CER Smart Meter Trial data October 2009 ( n = 3,488) www.ucd.ie/issda/data/c ommissionforenergyregu lationcer/ 0 0.2 0.4 0.6 0.8 1 1.2 00:00:00 01:30:00 03:00:00 04:30:00 06:00:00 07:30:00 09:00:00 10:30:00 12:00:00 13:30:00 15:00:00 16:30:00 18:00:00 19:30:00 21:00:00 22:30:00 Mean kwh (October 2009) 0 0.2 0.4 0.6 0.8 1 1.2 00:00:00 01:30:00 03:00:00 04:30:00 06:00:00 07:30:00 09:00:00 10:30:00 12:00:00 13:30:00 15:00:00 16:30:00 18:00:00 19:30:00 21:00:00 22:30:00 Mean kwh (October 2009) In work Caring for family/relative Unemployed Retired HRP work status
  10. Transformative Research Programme: #Census2022 www.energy.soton.ac.uk/tag/census2022/ Inspiration IV: Data 10 Source:

    Irish CER Smart Meter Trial data October 2009 ( n = 3,488) www.ucd.ie/issda/data/c ommissionforenergyregu lationcer/ Weekend HRP work status Week 1, October 2009
  11. Transformative Research Programme: #Census2022 www.energy.soton.ac.uk/tag/census2022/ Research Pathway Sample data •‘Labelled’

    consumption data •Models Sample of small areas •‘Unlabelled’ consumption •Geo-coded •~100% coverage Validate models •Using Census 2011 LSOA/OA data 11 This project
  12. Transformative Research Programme: #Census2022 www.energy.soton.ac.uk/tag/census2022/ The menu § Background §

    Smart meter electricity data § Example: – Inferring household attributes § Implications § Where next? 12
  13. Transformative Research Programme: #Census2022 www.energy.soton.ac.uk/tag/census2022/ ‘Smart Meter’ data options •UoS

    Energy Study (n = ~180) •Irish CER Smart Meter Trial (n = 4,000) •Energy Demand Reduction Project (n= 14,000) ‘Labelled’ consumption data •? ‘Unlabelled’ but geocoded data 13
  14. Transformative Research Programme: #Census2022 www.energy.soton.ac.uk/tag/census2022/ ‘Smart Meter’ data options •

    UoS Energy Study (n ~= 180) • Irish CER Smart Meter Trial (n ~= 4,000) ‘Labelled’ data • Energy Demand Reduction Project (n ~= 14,000) ‘Unlabelled’ and non-geocoded • ? ‘Unlabelled’ but geocoded data 14
  15. Transformative Research Programme: #Census2022 www.energy.soton.ac.uk/tag/census2022/ CER Irish Smart Meter Trials

    15 Sample Method unclear N = ~ 4,000 Geography unknown Study groups Trial & control Household Survey Pre trial (2009) Post trial (2010) Electricity kWh per half hour for 24months
  16. Transformative Research Programme: #Census2022 www.energy.soton.ac.uk/tag/census2022/ Processing & Cleaning 16 Analytic

    sample October 2009 – 5.6 million ½ hour records October 2009 Outliers Non- domestic 157 million ½ hour records
  17. Transformative Research Programme: #Census2022 www.energy.soton.ac.uk/tag/census2022/ The menu § Background §

    Smart meter electricity data § Example: – Inferring household attributes § Implications § Where next? 17
  18. Transformative Research Programme: #Census2022 www.energy.soton.ac.uk/tag/census2022/ Steps: • Select potential power

    consumption (profile) indicators Step 1 • Test if household characteristics can predict indicators Step 2 • Estimate household characteristics from indicators Step 3 (reverse step 2) 18
  19. Transformative Research Programme: #Census2022 www.energy.soton.ac.uk/tag/census2022/ 0 0.2 0.4 0.6 0.8

    1 1.2 00:00:00 01:30:00 03:00:00 04:30:00 06:00:00 07:30:00 09:00:00 10:30:00 12:00:00 13:30:00 15:00:00 16:30:00 18:00:00 19:30:00 21:00:00 22:30:00 Mean kwh (October 2009) Step 1: Profile indicators 19 Simplification & Experimentation Peak: •Magnitude •Timing of peak Mean baseload consumption Overall mean consumption Daily sum Daily 97.5th percentile Ratio of evening peak mean to non- evening peak mean (ECF) Ratio of daily mean to peak (Load Factor)
  20. Transformative Research Programme: #Census2022 www.energy.soton.ac.uk/tag/census2022/ Characteristics of interest •Income •Floor

    area •Employment status Census-like: •Number of residents •Presence of children Given that we know: 20 DWP, HMRC, NHS etc
  21. Transformative Research Programme: #Census2022 www.energy.soton.ac.uk/tag/census2022/ Step 2: Profile indicators prediction

    •October 2009 Mixed effects model •3 * 4 =12 repeat observations Mid-week (Tues – Thurs) •2 * 4 = 8 repeated observations Weekend (Sat & Sun) 21
  22. Transformative Research Programme: #Census2022 www.energy.soton.ac.uk/tag/census2022/ Step 2: Profile indicators prediction

    22 Profile indicators (LHS) Predictors (RHS) Daily Peak time Income Daily peak demand 06:00 to 10.30 Floor area Daily average baseload demand (02:00 - 05:00) Employed (response person) Daily mean consumption Retired (response person) Daily sum of consumption [Number of residents] Daily 97.5th percentile consumption [Presence of children] Evening Consumption Factor Load factor
  23. Transformative Research Programme: #Census2022 www.energy.soton.ac.uk/tag/census2022/ Results: Weekend 23 Daily peak

    time Daily peak 06:00 to 10.30 Daily average baseload (02:00 - 05:00) Daily average Daily sum Daily 97.5th percentile Evening Consumptio n Factor Load factor Predictors Number of residents - ✔ ✔ ✔ Presence of children - ✔ ✔ ✔ ✔ Income Not when employme nt & floor area included - ✔ Not when employme nt included Not when employme nt included Not when employment & floor area included - - Floor area - - ✔ - - - - ✔ Employment - - - - - - - - Retired - - - - - - - - Residual 78% 35% 40% 21% 21% 34% 65% 50% Data: Irish CER Smart Meter Trial data October 2009 ( n = 3,488) www.ucd.ie/issda/data/commissionforenergyregulationcer/
  24. Transformative Research Programme: #Census2022 www.energy.soton.ac.uk/tag/census2022/ Results: Midweek 24 Daily peak

    time Daily peak 06:00 to 10.30 Daily average baseloa d (02:00 - 05:00) Daily average Daily sum Daily 97.5th percenti le Evening Consum ption Factor Load factor Predictors Number of residents - ✔ Not when employme nt & floor area included ✔ ✔ ✔ Presence of children Not when employme nt & floor area included ✔ ✔ ✔ ✔ Not when employme nt & floor area included Income - Not when employme nt included ✔ Not when employme nt & floor area included Not when employme nt & floor area included Not when employme nt & floor area included - - Floor area - - - - - - - - Employment - - - - - - ✔ ✔ Retired - - - - - - - - Residual 80% 37% 46% 23% 23% 36% 72% 51% Data: Irish CER Smart Meter Trial data October 2009 ( n = 3,488) www.ucd.ie/issda/data/commissionforenergyregulationcer/
  25. Transformative Research Programme: #Census2022 www.energy.soton.ac.uk/tag/census2022/ Step 3: Can we predict

    attributes? • HRP in Employment Logit model • Income • Floor area Linear model • Assume we know n people & n children As before 25 DWP, HMRC, NHS etc
  26. Transformative Research Programme: #Census2022 www.energy.soton.ac.uk/tag/census2022/ Employment Status Model I §

    Midweek: 26 § Correct classification – Without ‘energy’ = 65.01% Data: Irish CER Smart Meter Trial data October 2009 ( n = 3,488) www.ucd.ie/issda/data/commissionforenergyregulationcer/
  27. Transformative Research Programme: #Census2022 www.energy.soton.ac.uk/tag/census2022/ Employment Status Model I §

    Midweek: 27 § Correct classification – Without ‘energy’ = 65.01% – With ‘energy’ = 65.42% ! Data: Irish CER Smart Meter Trial data October 2009 ( n = 3,488) www.ucd.ie/issda/data/commissionforenergyregulationcer/
  28. Transformative Research Programme: #Census2022 www.energy.soton.ac.uk/tag/census2022/ 1. Profile indicators 2. Profile

    cluster membership (new) 3. Indicator of habit (new) 4. ‘Admin’ data Employment Status Model II 28 0 0.2 0.4 0.6 0.8 1 1.2 1.4 1.6 1.8 2 00:00 01:30 03:00 04:30 06:00 07:30 09:00 10:30 12:00 13:30 15:00 16:30 18:00 19:30 21:00 22:30 Mean kWh (weekdays) 1 2 3 4 5 6
  29. Transformative Research Programme: #Census2022 www.energy.soton.ac.uk/tag/census2022/ Employment Status Model II 29

    Data: Irish CER Smart Meter Trial data October 2009 ( n = 3,488) www.ucd.ie/issda/data/commissionforenergyregulationcer/ ‘Habit: Tomorrow’ ‘Habit: Day after tomorrow’ ‘HRP in employment’ ‘Admin’ data Profile indicators Profile cluster membership
  30. Transformative Research Programme: #Census2022 www.energy.soton.ac.uk/tag/census2022/ Implications? •‘Energy’ may not help

    much •But it could help to validate If we have admin data •Profile indicators may have value But if we don’t… 30 For the variables tested…
  31. Transformative Research Programme: #Census2022 www.energy.soton.ac.uk/tag/census2022/ Where next? Sample data •‘Labelled’

    consumption data •Models Sample of small areas •‘Unlabelled’ consumption •Geo-coded •~100% coverage Validate models •Using Census 2011 LSOA/OA data 31 This project We need
  32. Transformative Research Programme: #Census2022 www.energy.soton.ac.uk/tag/census2022/ “practices leaves all sorts of

    “marks” – diet shows up in statistics on obesity; heating and cooling practices have effect on energy demand, and habits of laundry matter for water consumption. Identifying relevant “proxies” represents one way to go.” Sustainable Practices Research Group Discussion Paper www.sprg.ac.uk Image: Eric Shipton The Future: Practice hunting? 32 Owen. 2006. The rise of the machines—a review of energy using products in the home from the 1970s to today, Energy Saving Trust, London. flickr.com/photos/82655797@N00/8249565455 2010s pixabay
  33. Transformative Research Programme: #Census2022 www.energy.soton.ac.uk/tag/census2022/ Thank you § Contact: –

    [email protected] – @dataknut § Project: – www.energy.soton.ac.uk/tag/census2022/ § Selected code: – github.com/dataknut/Census2022 § Papers to date: – Claxton, R, J Reades, and B Anderson. (2012). ‘On the Value of Digital Traces for Commercial Strategy and Public Policy: Telecommunications Data as a Case Study’. In The Global Information Technology Report 2012, edited by S Dutta and B Bilbao-Osorio. Geneva: World Economic Forum. – Newing et al (2015) ‘The Role of Digital Trace Data in Supporting the Collection of Population Statistics - the Case for Smart Metered Electricity Consumption Data’. Population, Space and Place, July, doi:10.1002/psp.1972. 33