NZ, 6/7/2016 Ben Anderson @dataknut Energy & Climate Change Faculty of Engineering & Environment University of Southampton, UK 'Energy PracCces’ Through Time Using Time Use Data
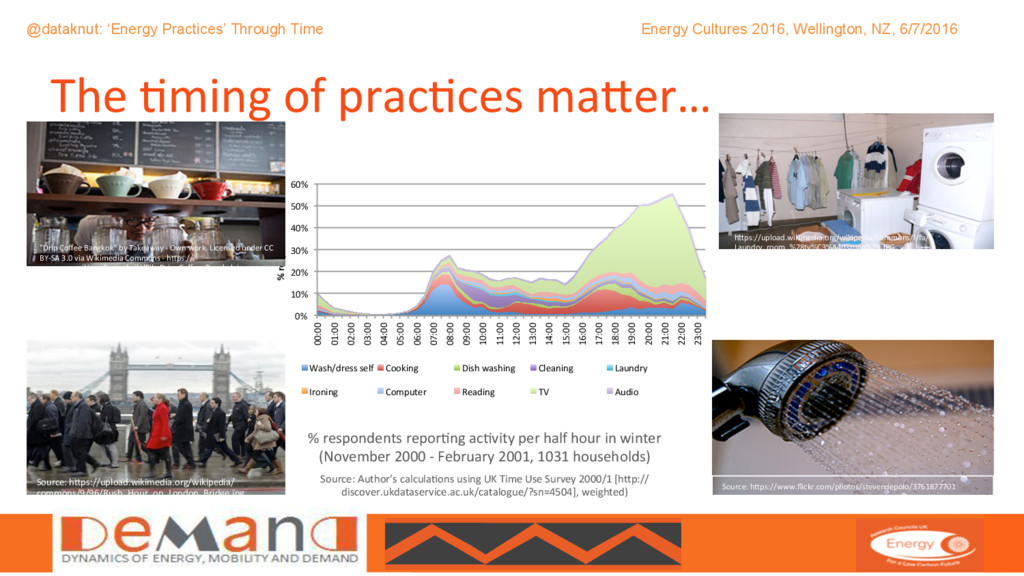
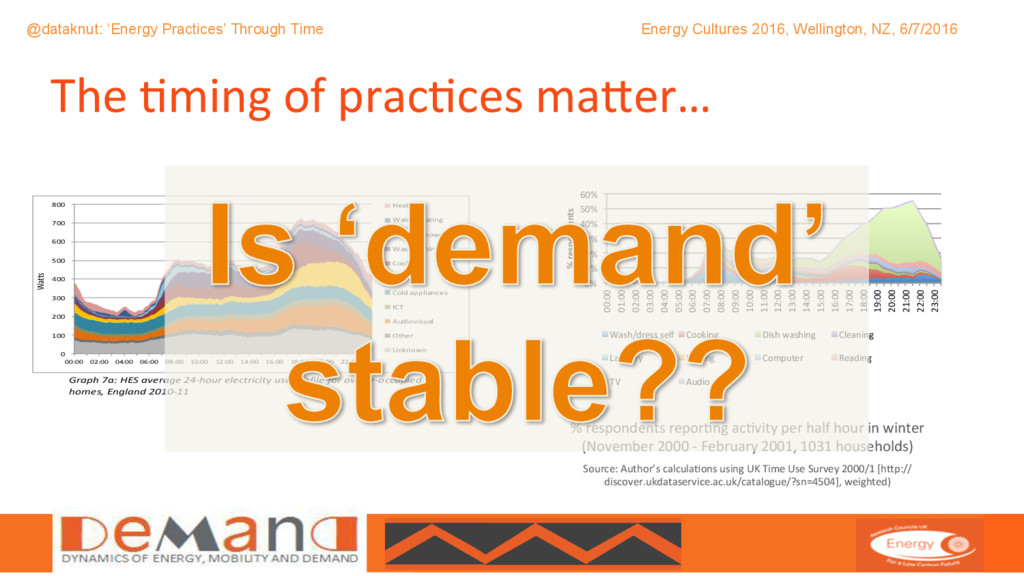
NZ, 6/7/2016 The Cming of pracCces maQer… % respondents reporCng acCvity per half hour in winter (November 2000 - February 2001, 1031 households) Source: Author’s calculaCons using UK Time Use Survey 2000/1 [hQp:// discover.ukdataservice.ac.uk/catalogue/?sn=4504], weighted) 0% 10% 20% 30% 40% 50% 60% 00:00 01:00 02:00 03:00 04:00 05:00 06:00 07:00 08:00 09:00 10:00 11:00 12:00 13:00 14:00 15:00 16:00 17:00 18:00 19:00 20:00 21:00 22:00 23:00 % respondents Wash/dress self Cooking Dish washing Cleaning Laundry Ironing Computer Reading TV Audio UK Housing Energy Fact File Graph 7a: HES average 24-hour electricity use profile for owner-occupied homes, England 2010-11 Gas consumption The amount of gas consumed in the UK varies dramatically between households. The top 10% of households consume at least four times as much gas as the bottom 10%.60 Modelling to predict households’ energy consumption – based on the property, household income and tenure – has so far been able to explain less than 40% of this variation. Households with especially high or low consumption do not have particular behaviours that make them easy to identify. Instead they tend to have a cluster of very ordinary behaviours that happen to culminate in high or low gas use. There are, it seems, many different ways to be a high or low gas user. The behaviours in question can be clustered under three broad m the s are 0 100 200 300 400 500 600 700 800 00:00 02:00 04:00 06:00 08:00 10:00 12:00 14:00 16:00 18:00 20:00 22:00 Heating Water heating Electric showers Washing/drying Cooking Lighting Cold appliances ICT Audiovisual Other Unknown Watts
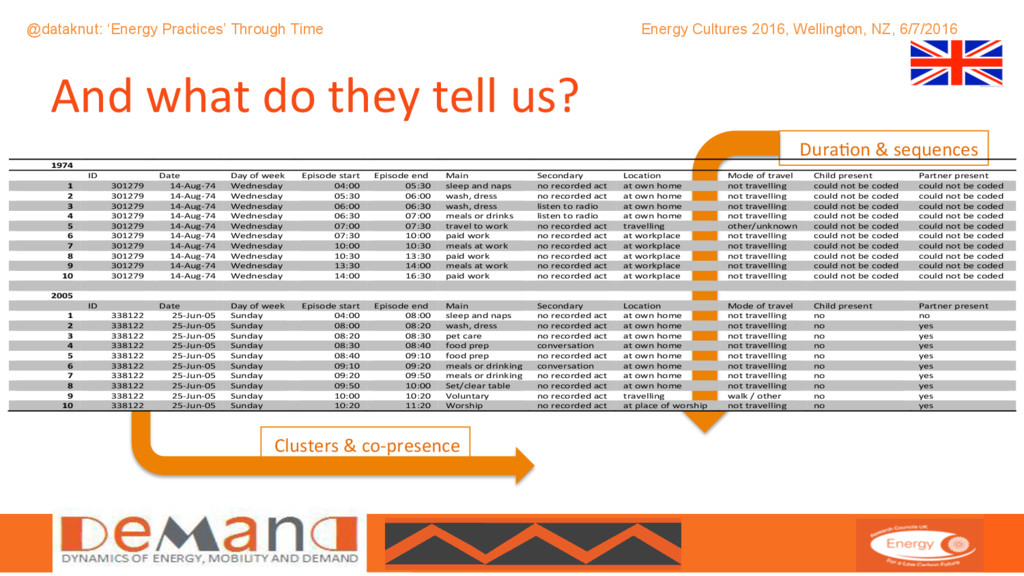
NZ, 6/7/2016 And what do they tell us? DuraCon & sequences Clusters & co-presence Anderson, B (2016) DEMANDing Times, Paper prepared for DEMAND Centre Conference, Lancaster, 13-15 April 2016 Table 2: Example time-use data (MTUS, 1974 and 2000 samples) 1974 ID Date Day of week Episode start Episode end Main Secondary Location Mode of travel Child present Partner present 1 301279 14-Aug-74 Wednesday 04:00 05:30 sleep and naps no recorded act at own home not travelling could not be coded could not be coded 2 301279 14-Aug-74 Wednesday 05:30 06:00 wash, dress no recorded act at own home not travelling could not be coded could not be coded 3 301279 14-Aug-74 Wednesday 06:00 06:30 wash, dress listen to radio at own home not travelling could not be coded could not be coded 4 301279 14-Aug-74 Wednesday 06:30 07:00 meals or drinks listen to radio at own home not travelling could not be coded could not be coded 5 301279 14-Aug-74 Wednesday 07:00 07:30 travel to work no recorded act travelling other/unknown could not be coded could not be coded 6 301279 14-Aug-74 Wednesday 07:30 10:00 paid work no recorded act at workplace not travelling could not be coded could not be coded 7 301279 14-Aug-74 Wednesday 10:00 10:30 meals at work no recorded act at workplace not travelling could not be coded could not be coded 8 301279 14-Aug-74 Wednesday 10:30 13:30 paid work no recorded act at workplace not travelling could not be coded could not be coded 9 301279 14-Aug-74 Wednesday 13:30 14:00 meals at work no recorded act at workplace not travelling could not be coded could not be coded 10 301279 14-Aug-74 Wednesday 14:00 16:30 paid work no recorded act at workplace not travelling could not be coded could not be coded 2005 ID Date Day of week Episode start Episode end Main Secondary Location Mode of travel Child present Partner present 1 338122 25-Jun-05 Sunday 04:00 08:00 sleep and naps no recorded act at own home not travelling no no 2 338122 25-Jun-05 Sunday 08:00 08:20 wash, dress no recorded act at own home not travelling no yes 3 338122 25-Jun-05 Sunday 08:20 08:30 pet care no recorded act at own home not travelling no yes 4 338122 25-Jun-05 Sunday 08:30 08:40 food prep conversation at own home not travelling no yes 5 338122 25-Jun-05 Sunday 08:40 09:10 food prep no recorded act at own home not travelling no yes 6 338122 25-Jun-05 Sunday 09:10 09:20 meals or drinking conversation at own home not travelling no yes 7 338122 25-Jun-05 Sunday 09:20 09:50 meals or drinking no recorded act at own home not travelling no yes 8 338122 25-Jun-05 Sunday 09:50 10:00 Set/clear table no recorded act at own home not travelling no yes 9 338122 25-Jun-05 Sunday 10:00 10:20 Voluntary no recorded act travelling walk / other no yes 10 338122 25-Jun-05 Sunday 10:20 11:20 Worship no recorded act at place of worship not travelling no yes
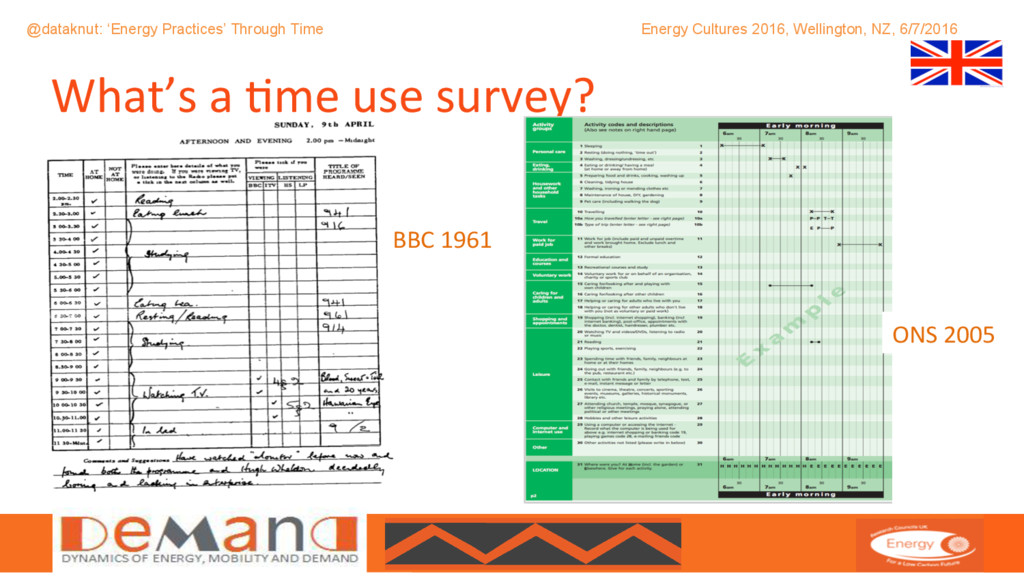
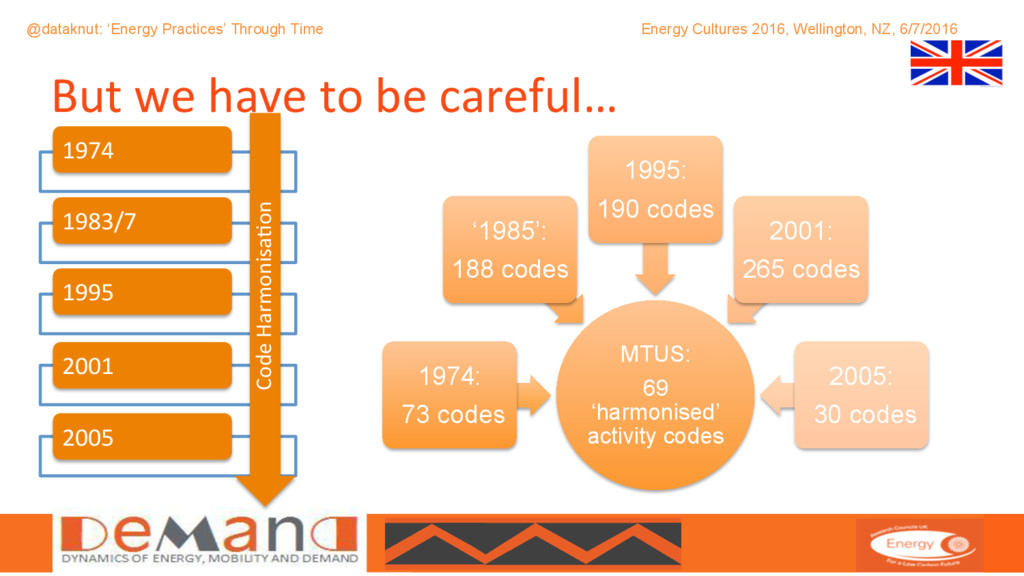
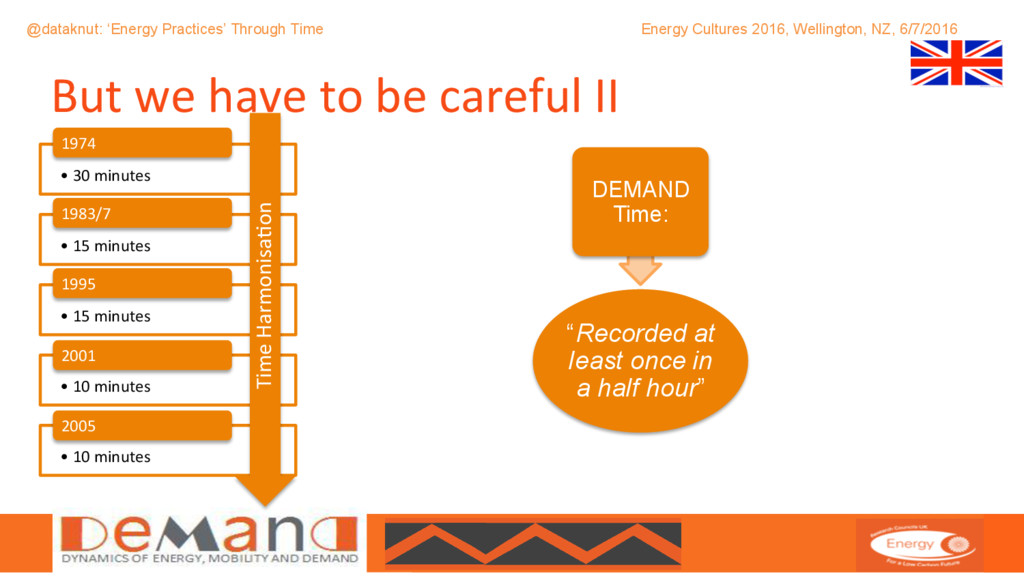
NZ, 6/7/2016 But we have to be careful II • 30 minutes 1974 • 15 minutes 1983/7 • 15 minutes 1995 • 10 minutes 2001 • 10 minutes 2005 Time HarmonisaCon “Recorded at least once in a half hour” DEMAND Time:
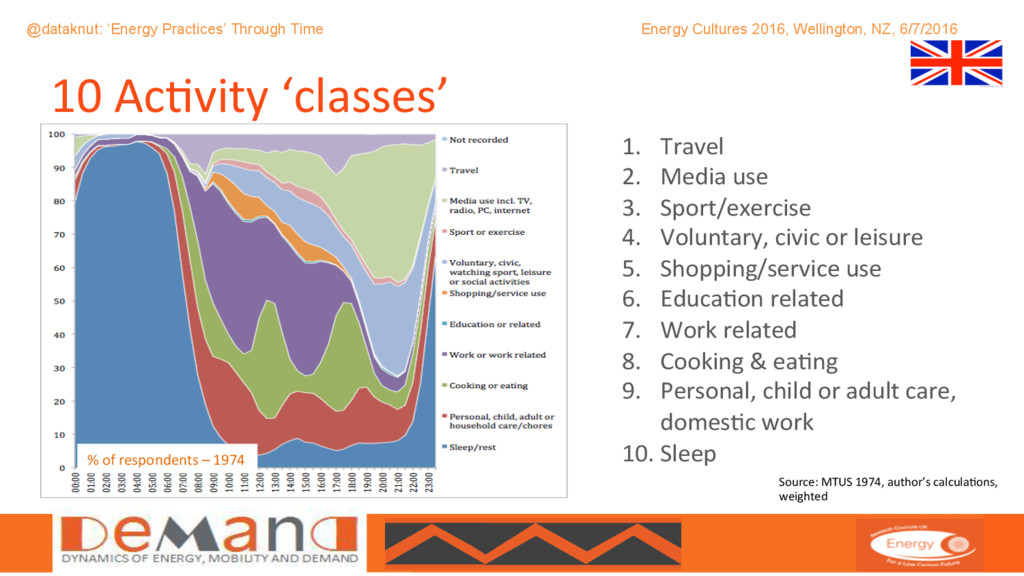
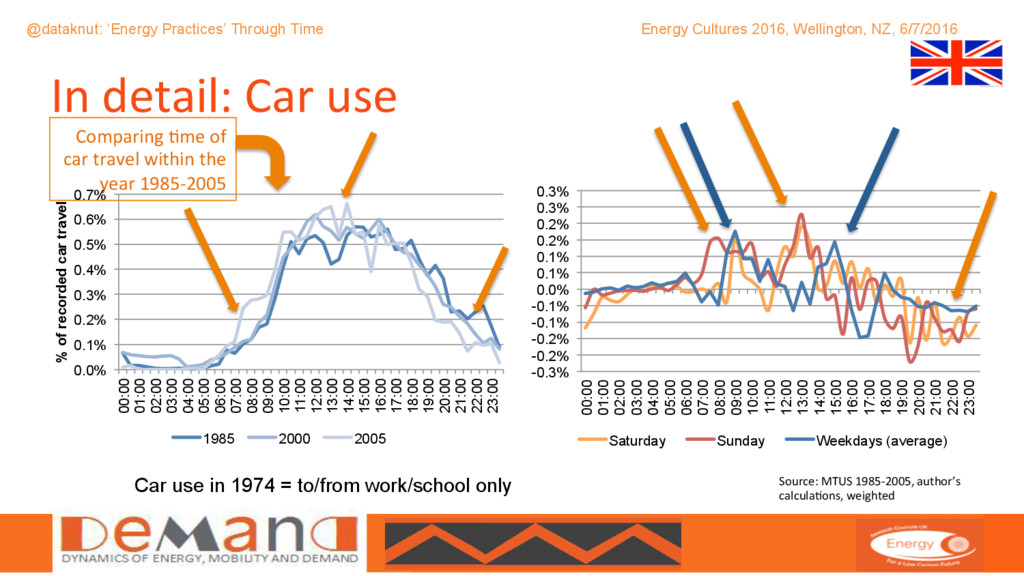
NZ, 6/7/2016 10 AcCvity ‘classes’ 1. Travel 2. Media use 3. Sport/exercise 4. Voluntary, civic or leisure 5. Shopping/service use 6. EducaCon related 7. Work related 8. Cooking & eaCng 9. Personal, child or adult care, domesCc work 10. Sleep % of respondents – 1974 Source: MTUS 1974, author’s calculaCons, weighted
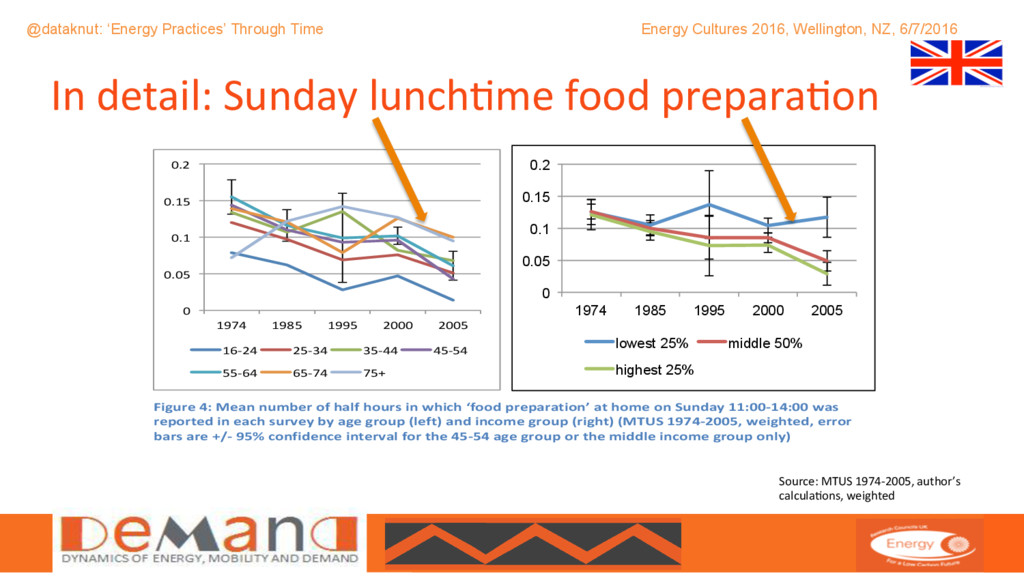
NZ, 6/7/2016 In detail: Sunday lunchCme food preparaCon Source: MTUS 1974-2005, author’s calculaCons, weighted Page 10 of 17 (MTUS 1974-2005, weighted) Further analysis focusing on ‘Sunday lunch’ (food preparation 11:00 – 14:00 on a Sunday) suggests that preparing ‘Sunday lunch’ has declined for most age groups and especially for those aged under 64 (Figure 4). Preparing Sunday lunch has also markedly declined for the middle and highest income groups but less so for the lowest income group who are also more likely to be over retirement age. This does not imply, of course, that less eating is done on Sunday – just that some of it, particularly for higher income groups, may now be done outside the home or later in the day (c.f. Figure 3 and also (Cheng et al. 2007)). Figure 4: Mean number of half hours in which ‘food preparation’ at home on Sunday 11:00-14:00 was reported in each survey by age group (left) and income group (right) (MTUS 1974-2005, weighted, error bars are +/- 95% confidence interval for the 45-54 age group or the middle income group only) 0 0.05 0.1 0.15 0.2 1974 1985 1995 2000 2005 16-24 25-34 35-44 45-54 55-64 65-74 75+ 0 0.05 0.1 0.15 0.2 1974 1985 1995 2000 2005 lowest 25% middle 50% highest 25% 0 0.05 0.1 0.15 0.2 1974 1985 1995 2000 2005 lowest 25% middle 50% highest 25%
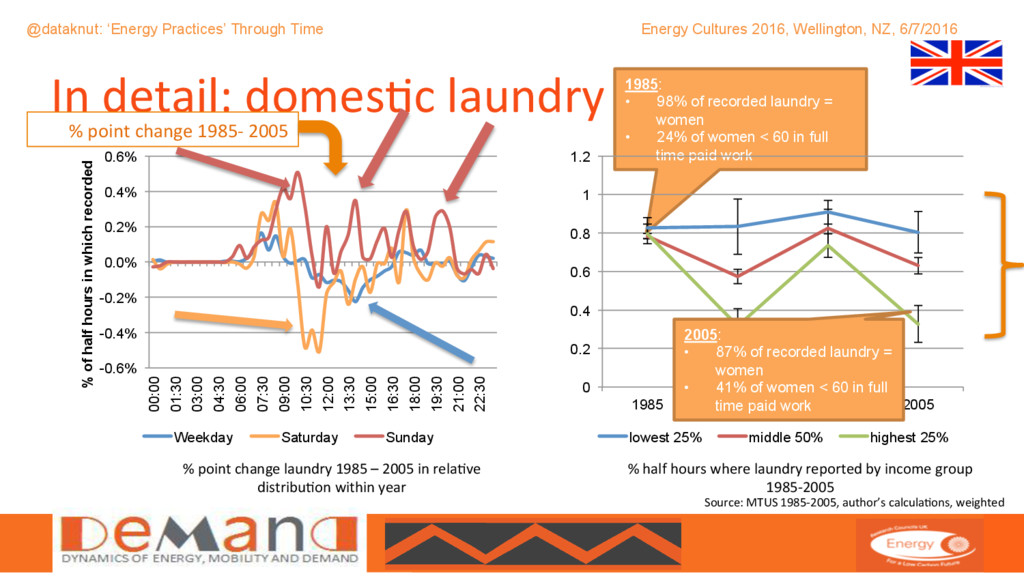
NZ, 6/7/2016 -0.6% -0.4% -0.2% 0.0% 0.2% 0.4% 0.6% 00:00 01:30 03:00 04:30 06:00 07:30 09:00 10:30 12:00 13:30 15:00 16:30 18:00 19:30 21:00 22:30 % of half hours in which recorded Weekday Saturday Sunday In detail: domesCc laundry % point change laundry 1985 – 2005 in relaCve distribuCon within year Source: MTUS 1985-2005, author’s calculaCons, weighted 1985: • 98% of recorded laundry = women • 24% of women < 60 in full time paid work % point change 1985- 2005 % half hours where laundry reported by income group 1985-2005 0 0.2 0.4 0.6 0.8 1 1.2 1985 1995 2000 2005 lowest 25% middle 50% highest 25% 2005: • 87% of recorded laundry = women • 41% of women < 60 in full time paid work
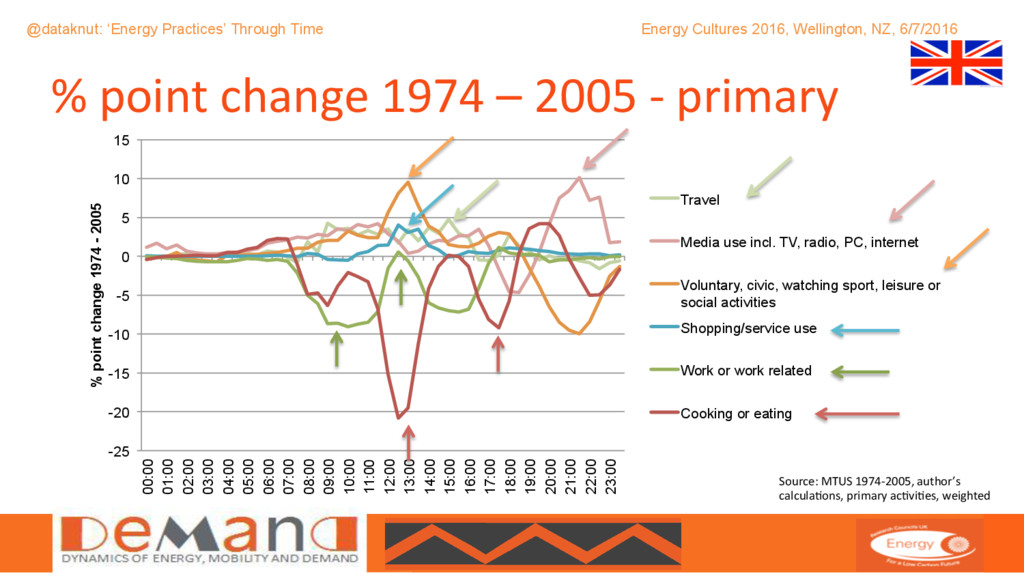
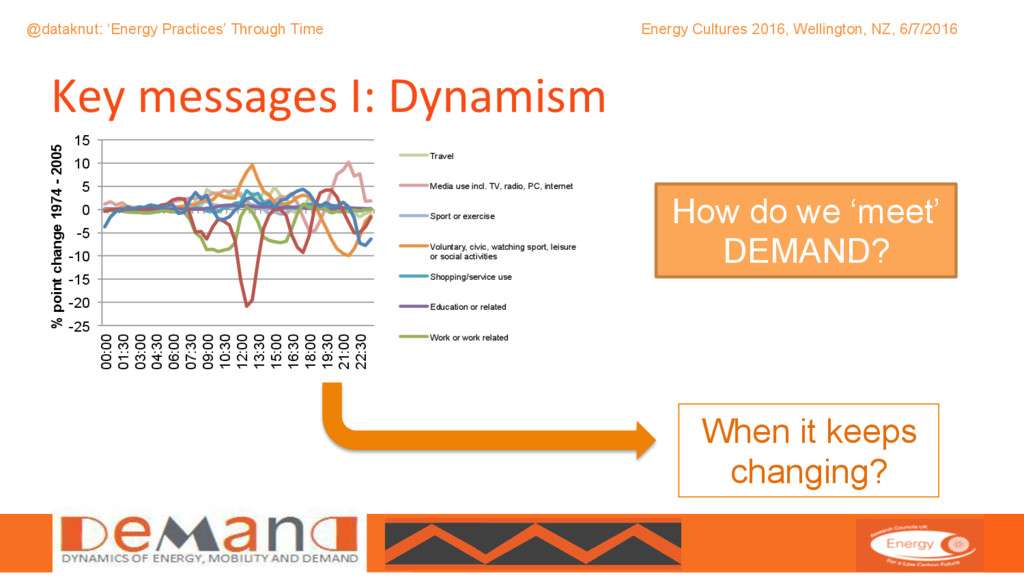
NZ, 6/7/2016 Key messages I: Dynamism How do we ‘meet’ DEMAND? -25 -20 -15 -10 -5 0 5 10 15 00:00 01:30 03:00 04:30 06:00 07:30 09:00 10:30 12:00 13:30 15:00 16:30 18:00 19:30 21:00 22:30 % point change 1974 - 2005 Travel Media use incl. TV, radio, PC, internet Sport or exercise Voluntary, civic, watching sport, leisure or social activities Shopping/service use Education or related Work or work related When it keeps changing?
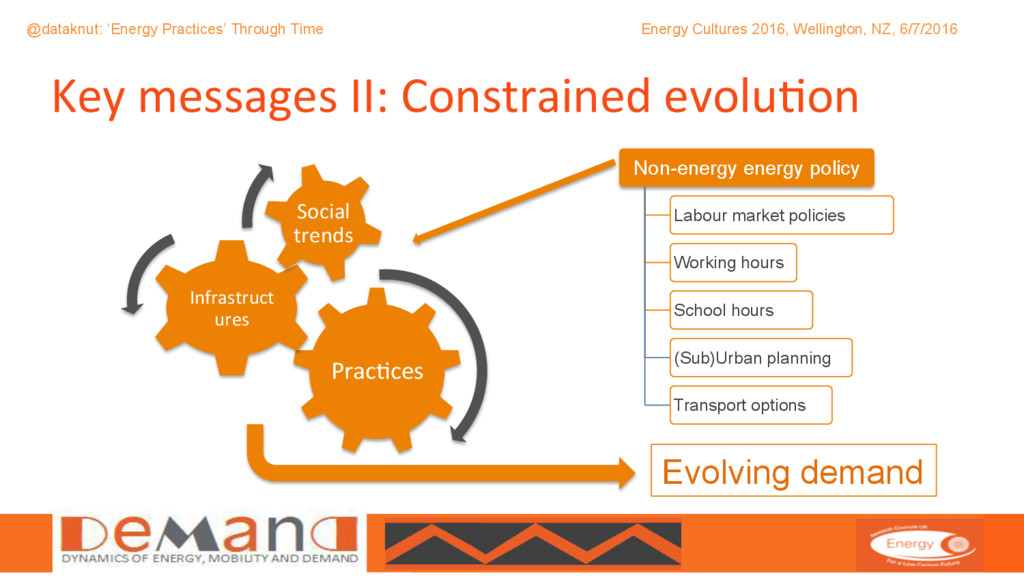
NZ, 6/7/2016 Key messages II: Constrained evoluCon PracCces Infrastruct ures Social trends Evolving demand Non-energy energy policy Labour market policies Working hours School hours (Sub)Urban planning Transport options
NZ, 6/7/2016 1 To be fi lled in from 4am on day one, which is Day Date all through day two, which is Day Date until 4am on day three, which is Time Use Survey Diary Thank you @dataknut [email protected] www.demand.ac.uk 2017 – 2019: Centre for Sustainability, University of Otago (EU Global Fellowship) pixabay.com