Planform and Profile Adjustments of a Gravel Barrier Beach. Case-study of Slapton, UK. Daniel Buscombe*#; Amaia Ruiz de Alegria*; Gerhard Masselink* * School of Geography, University of Plymouth, UK (
[email protected];
[email protected]); # present address: Dept. Earth & Planetary Sciences, University of California Santa Cruz (
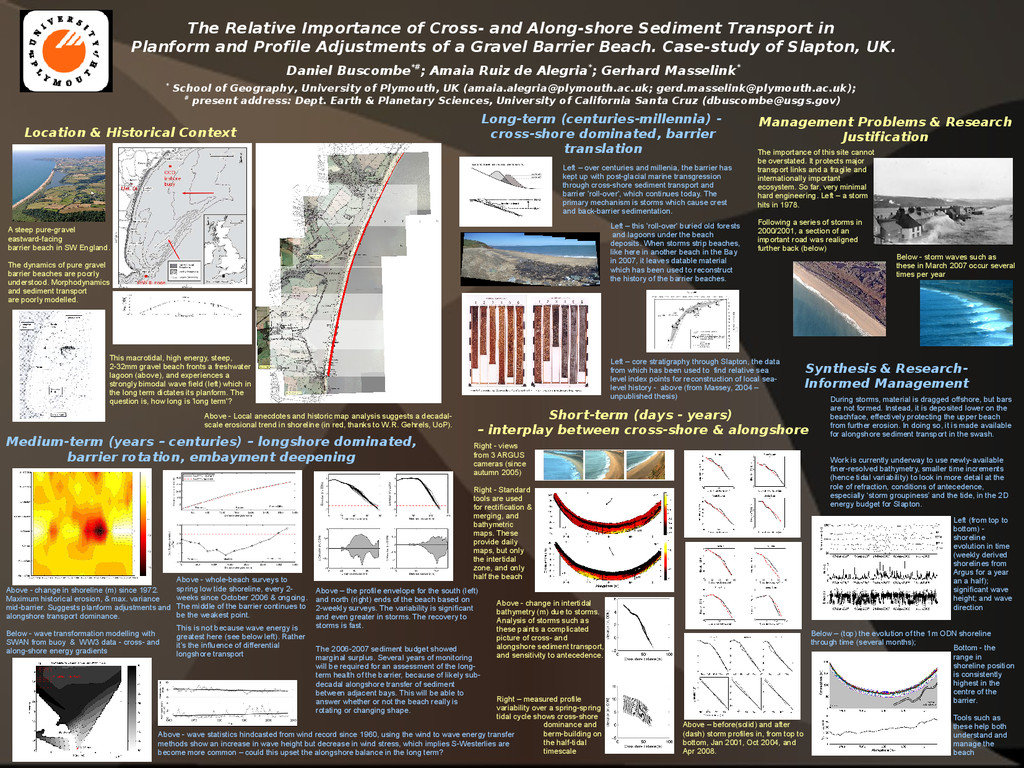
[email protected]) Location & Historical Context Long-term (centuries-millennia) - cross-shore dominated, barrier translation Medium-term (years – centuries) – longshore dominated, barrier rotation, embayment deepening Management Problems & Research Justification Synthesis & Research- Informed Management Short-term (days - years) – interplay between cross-shore & alongshore Above - Local anecdotes and historic map analysis suggests a decadal- scale erosional trend in shoreline (in red, thanks to W.R. Gehrels, UoP). Left – core stratigraphy through Slapton, the data from which has been used to find relative sea level index points for reconstruction of local sea- level history - above (from Massey, 2004 – unpublished thesis) A steep pure-gravel eastward-facing barrier beach in SW England. The dynamics of pure gravel barrier beaches are poorly understood. Morphodynamics and sediment transport are poorly modelled. Above - change in shoreline (m) since 1972. Maximum historical erosion, & max. variance mid-barrier. Suggests planform adjustments and alongshore transport dominance. Below - wave transformation modelling with SWAN from buoy & WW3 data - cross- and along-shore energy gradients The importance of this site cannot be overstated. It protects major transport links and a fragile and internationally important ecosystem. So far, very minimal hard engineering. Left – a storm hits in 1978. Following a series of storms in 2000/2001, a section of an important road was realigned further back (below) Above - wave statistics hindcasted from wind record since 1960, using the wind to wave energy transfer methods show an increase in wave height but decrease in wind stress, which implies S-Westerlies are become more common – could this upset the alongshore balance in the long term? The 2006-2007 sediment budget showed marginal surplus. Several years of monitoring will be required for an assessment of the long- term health of the barrier, because of likely sub- decadal alongshore transfer of sediment between adjacent bays. This will be able to answer whether or not the beach really is rotating or changing shape. Right - views from 3 ARGUS cameras (since autumn 2005) Right - Standard tools are used for rectification & merging, and bathymetric maps. These provide daily maps, but only the intertidal zone, and only half the beach This macrotidal, high energy, steep, 2-32mm gravel beach fronts a freshwater lagoon (above), and experiences a strongly bimodal wave field (left) which in the long term dictates its planform. The question is, how long is 'long term'? Above - whole-beach surveys to spring low tide shoreline, every 2- weeks since October 2006 & ongoing. The middle of the barrier continues to be the weakest point. This is not because wave energy is greatest here (see below left). Rather it’s the influence of differential longshore transport Above – the profile envelope for the south (left) and north (right) ends of the beach based on 2-weekly surveys. The variability is significant and even greater in storms. The recovery to storms is fast. Above - change in intertidal bathymetry (m) due to storms. Analysis of storms such as these paints a complicated picture of cross- and alongshore sediment transport, and sensitivity to antecedence. Right – measured profile variability over a spring-spring tidal cycle shows cross-shore dominance and berm-building on the half-tidal timescale During storms, material is dragged offshore, but bars are not formed. Instead, it is deposited lower on the beachface, effectively protecting the upper beach from further erosion. In doing so, it is made available for alongshore sediment transport in the swash. Work is currently underway to use newly-available finer-resolved bathymetry, smaller time increments (hence tidal variability) to look in more detail at the role of refraction, conditions of antecedence, especially ‘storm groupiness’ and the tide, in the 2D energy budget for Slapton. Above – before(solid) and after (dash) storm profiles in, from top to bottom, Jan 2001, Oct 2004, and Apr 2008. Below - storm waves such as these in March 2007 occur several times per year Left – over centuries and millenia, the barrier has kept up with post-glacial marine transgression through cross-shore sediment transport and barrier 'roll-over', which continues today. The primary mechanism is storms which cause crest and back-barrier sedimentation. Left – this 'roll-over' buried old forests and lagoons under the beach deposits. When storms strip beaches, like here in another beach in the Bay in 2007, it leaves datable material which has been used to reconstruct the history of the barrier beaches. Bottom - the range in shoreline position is consistently highest in the centre of the barrier. Tools such as these help both understand and manage the beach Below – (top) the evolution of the 1m ODN shoreline through time (several months); Left (from top to bottom) - shoreline evolution in time (weekly derived shorelines from Argus for a year an a half); significant wave height; and wave direction