Upgrade to Pro — share decks privately, control downloads, hide ads and more …

Exploring Variability in Reflood Simulation Results: an Application of Functional Data Analysis

Exploring Variability in Reflood Simulation Results: an Application of Functional Data Analysis

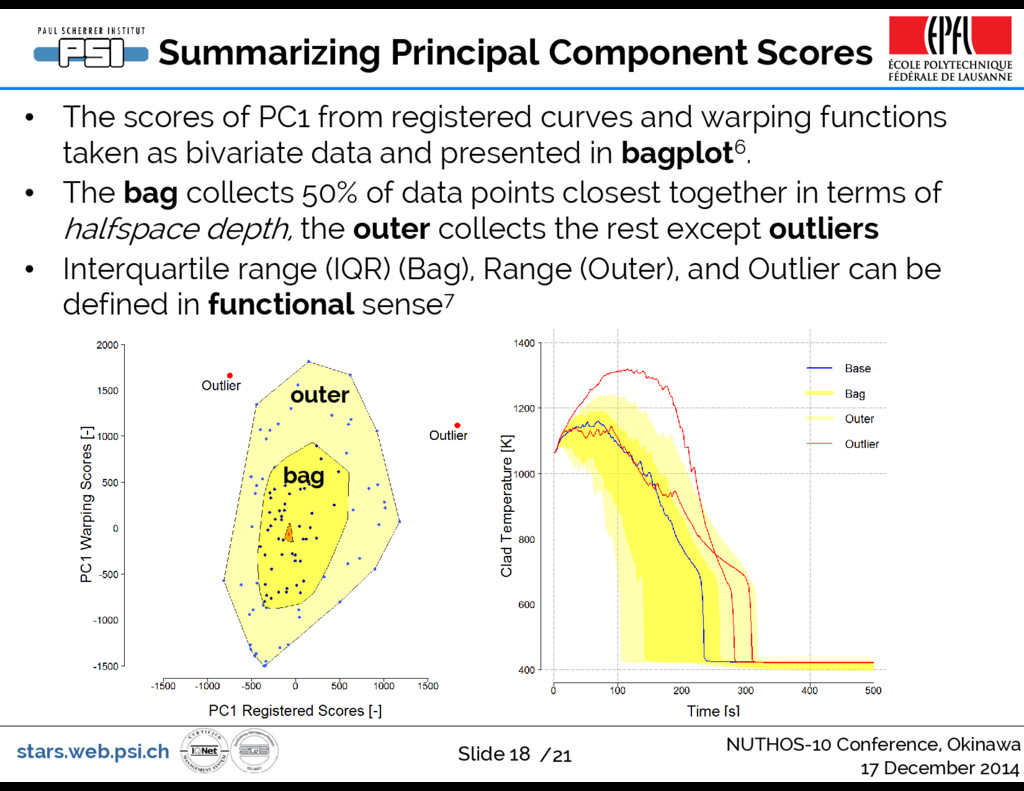
(Presented at the 10th International Topical Meeting on Nuclear Reactor Thermal Hydraulics, Operation and Safety NUTHOS-10, Okinawa, Japan, 2014)

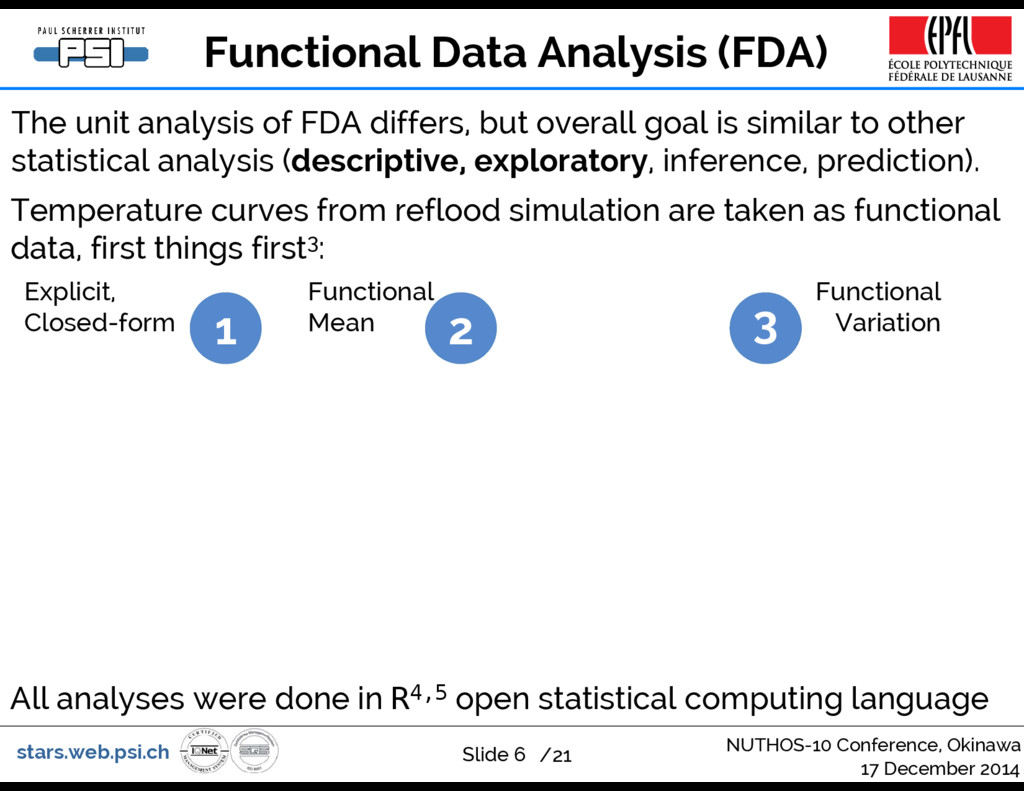
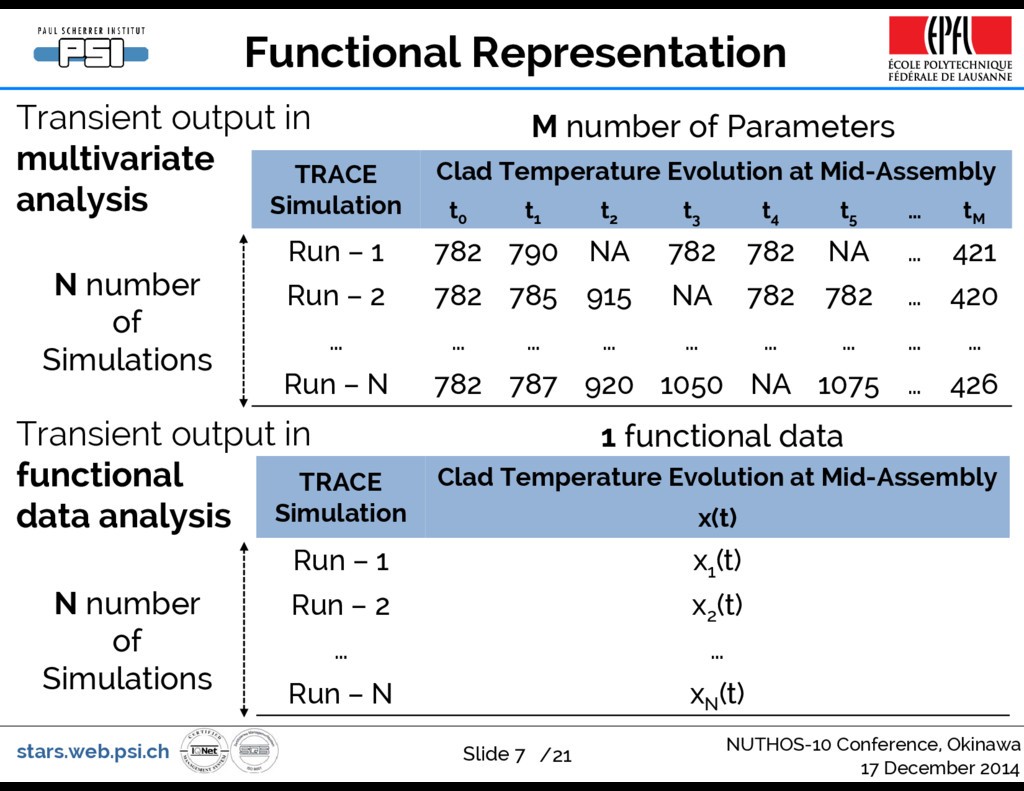
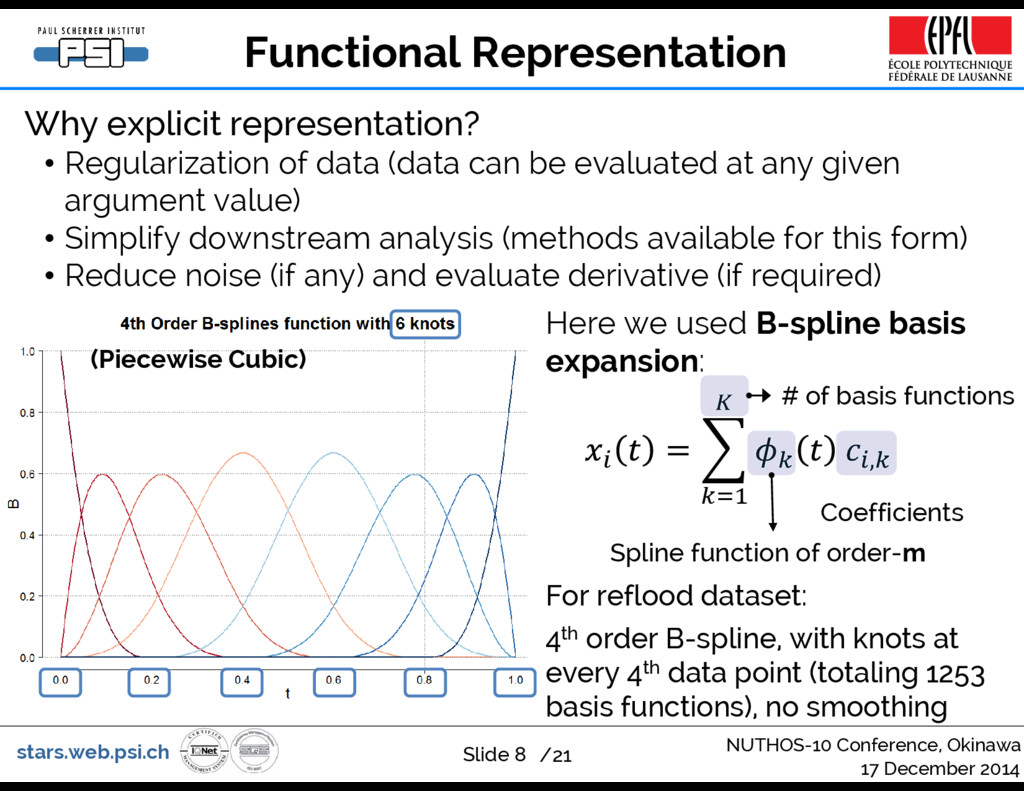
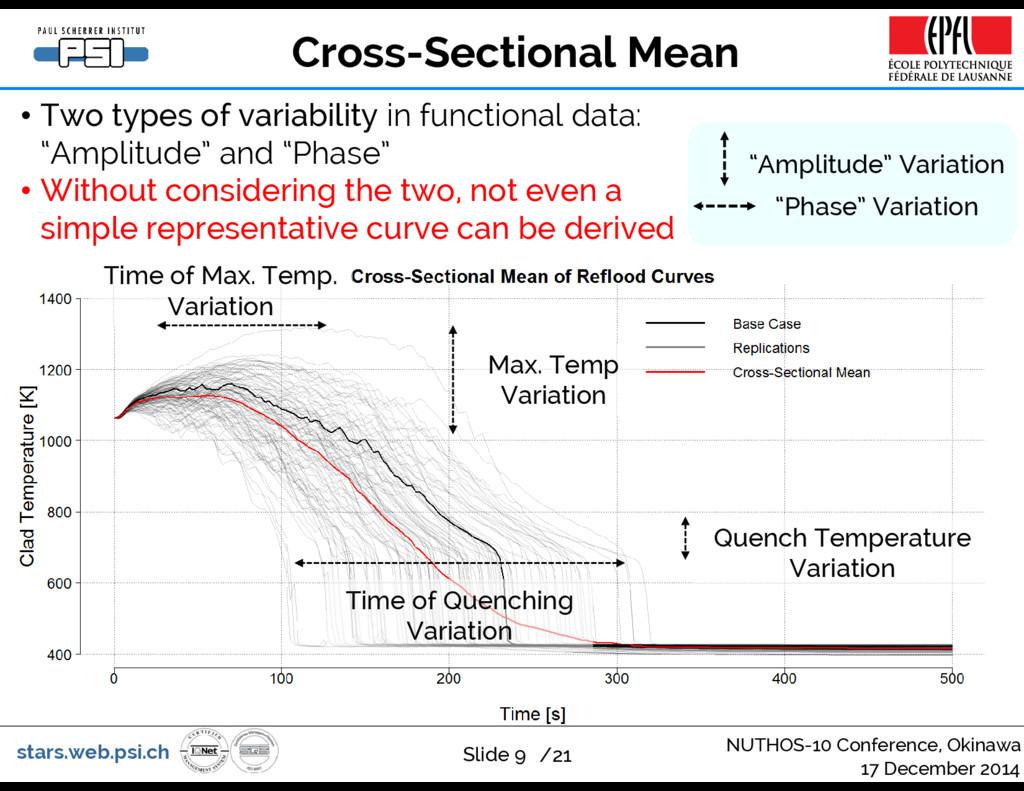
Simulation of reflood phase during loss-of-coolant accident in a nuclear reactor power plant is an important part in the plant safety analysis. During reflood, a steady stream of water is injected into a dry fuel channel to cool down the heated channel and to prevent fuel failure. Computer simulation of such phenomena relied on a set of phenomenological models that contains uncertain parameters. Such uncertainties will result in variation of the prediction made by simulation. The quantity of interest of the simulation comes in a form of time-dependent fuel temperature prediction. The presence of simultaneous amplitude and phase variations in the time-dependent dataset prevent straightforward statistical summary of such data. In this presentation, I'll describe the application of functional data analysis to the problem of characterizing the variation of the high-dimensional, highly correlated computer code output stemming from parameter uncertainty.

Damar Wicaksono

December 17, 2014
Tweet

More Decks by Damar Wicaksono

Other Decks in Science

Transcript

  1. Wir schaffen Wissen – heute für morgen Laboratory for Reactor

    Physics and Systems Behaviour (LRS) NUTHOS-10 Conference, Okinawa, Japan 17th December 2014 Exploring Variability in Reflood Simulation Results: an Application of Functional Data Analysis D. Wicaksono, O. Zerkak, and A. Pautz
  2. stars.web.psi.ch /21 Motivation Results from BEMUSE1 program How do we

    summarize a set of curves? 1. What is the average curve? 2. How the curves actually vary? In terms of what? 3. How to summarize this variations? What’s the notion of mean, median, range, etc. in functional sense? 4. Which of the curves are actually off ? PSI Contribution to PREMIUM program Slide 2 Possible applications: • Synthesize information from a blind benchmark (many participants, codes) • Summarizing variability from statistical sensitivity and uncertainty analyses of transient simulations 17 December 2014 NUTHOS-10 Conference, Okinawa
  3. stars.web.psi.ch /21 The Dataset: reflood curves A synthetic dataset of

    reflood curves TRACE Simulation of FEBA reflood SET Facility 100 TRACE code runs from Monte Carlo sample of 26 model input parameters2 Shown here, Mid- assembly clad temperature of the Experimental Run 216 500 [s] transient, 0.1 [s] time-step size, 5’000 data points per run • Typical in a reflood curve: Maximum temperature, Quenching, Maximum Curvature • Variations can be defined on that basis Max. Temperature Quenching Max. Curvature Max. Temp. Variation Quenching Variation Slide 3 17 December 2014 NUTHOS-10 Conference, Okinawa
  4. stars.web.psi.ch /21 The Dataset: reflood curves • Typical in a

    reflood curve: Maximum temperature, Quenching, Maximum Curvature • Variations can be defined on that basis • But the overall shape of a curve can be very different Slide 4 A synthetic dataset of reflood curves TRACE Simulation of FEBA reflood SET Facility 100 TRACE code runs from Monte Carlo sample of 26 model input parameters2 Shown here, Mid- assembly clad temperature of the Experimental Run 216 500 [s] transient, 0.1 [s] time-step size, 5’000 data points per run 17 December 2014 NUTHOS-10 Conference, Okinawa
  5. stars.web.psi.ch /21 Functional Data Analysis (FDA) “FDA refers to statistical

    analysis of data samples consisting of random functions or surfaces, where each function is viewed as one sample element.” H-G. Müller, 2006, StatProb: The Encyclopedia Sponsored by Statistics and Probability Societies • Following the works from Ramsay and Silverman3 • The unit of analysis is the whole curve (represented as continuous function) • Continuity is assumed (real observation seldom is) FDA is not (simply): • Multivariate analysis (smoothness assumption, no complicated correlation, data ordering is fixed, infinite dimension) • Time-series analysis (no stationarity assumption, multiple observations) Slide 5 17 December 2014 NUTHOS-10 Conference, Okinawa
  6. stars.web.psi.ch /21 Functional Data Analysis (FDA) Temperature curves from reflood

    simulation are taken as functional data, first things first3: Slide 6 All analyses were done in R4,5 open statistical computing language The unit analysis of FDA differs, but overall goal is similar to other statistical analysis (descriptive, exploratory, inference, prediction). 1 2 3 Explicit, Closed-form Functional Mean Functional Variation 17 December 2014 NUTHOS-10 Conference, Okinawa
  7. stars.web.psi.ch /21 Functional Representation Slide 7 TRACE Simulation Clad Temperature

    Evolution at Mid-Assembly t0 t1 t2 t3 t4 t5 … tM Run – 1 782 790 NA 782 782 NA … 421 Run – 2 782 785 915 NA 782 782 … 420 … … … … … … … … … Run – N 782 787 920 1050 NA 1075 … 426 M number of Parameters N number of Simulations Transient output in multivariate analysis TRACE Simulation Clad Temperature Evolution at Mid-Assembly x(t) Run – 1 x1 (t) Run – 2 x2 (t) … … Run – N xN (t) 1 functional data N number of Simulations Transient output in functional data analysis 17 December 2014 NUTHOS-10 Conference, Okinawa
  8. stars.web.psi.ch /21 Functional Representation Slide 8 Why explicit representation? •

    Regularization of data (data can be evaluated at any given argument value) • Simplify downstream analysis (methods available for this form) • Reduce noise (if any) and evaluate derivative (if required) Here we used B-spline basis expansion: Spline function of order-m , (Piecewise Cubic) For reflood dataset: 4th order B-spline, with knots at every 4th data point (totaling 1253 basis functions), no smoothing Coefficients # of basis functions 17 December 2014 NUTHOS-10 Conference, Okinawa
  9. stars.web.psi.ch /21 Cross-Sectional Mean Slide 9 Time of Quenching Variation

    Max. Temp Variation Time of Max. Temp. Variation Quench Temperature Variation “Amplitude” Variation “Phase” Variation • Two types of variability in functional data: “Amplitude” and “Phase” • Without considering the two, not even a simple representative curve can be derived 17 December 2014 NUTHOS-10 Conference, Okinawa
  10. stars.web.psi.ch /21 Mean Function and Registration (1) Slide 10 Curve

    Registration is a transformation of a function arguments such that the important features of the curves are aligned ∗ ∗ Such that the functions are well-aligned. Landmark registration: Constrained by important features Registration Problem: Time-warping function Registered function Series of important events Forced to happen at the same time Transformed time 17 December 2014 NUTHOS-10 Conference, Okinawa
  11. stars.web.psi.ch /21 Mean Function and Registration (2) Slide 11 Two

    landmarks for reflood curves chosen: the time of maximum temperature and the time of maximum curvature Shown here, 3 examples of runs with different timings. 17 December 2014 NUTHOS-10 Conference, Okinawa
  12. stars.web.psi.ch /21 Structural Mean Slide 12 • The landmark registration

    procedure applied to all the curves in the reflood dataset • So-called structural mean function can now be derived 17 December 2014 NUTHOS-10 Conference, Okinawa
  13. stars.web.psi.ch /21 Covariation in Functional Data • The covariance in

    functional sense defined as: , 1 ̅ ̅ • The covariance is a surface, hard to interpret, need low-dimension projection • Karhunen-Loève Decomposition of the covariance function , • : Eigenvalues • : Eigenfunctions Slide 13 17 December 2014 NUTHOS-10 Conference, Okinawa
  14. stars.web.psi.ch /21 ̅ functional Principal Component Analysis Functional Principal Component

    (fPC) Describe modes of variation • In the context of data analysis, KL decomposition refers to the functional Principal Component Analysis (fPCA) , Eigenvalues Describe the relative strength of the modes of variation • and are ensemble quantities (describe the whole data) • KL is an optimal orthogonal basis expansion. Each functions: ̅ Principal component scores Describe the strength of modes of variation j in the data i mean function Slide 14 17 December 2014 NUTHOS-10 Conference, Okinawa
  15. stars.web.psi.ch /21 fPCA of Reflood Curves (1) • The first

    3 fPCs takes into account 90% variability of the registered curves • Plotting the ⋅ can assist in its interpretation Slide 15 17 December 2014 NUTHOS-10 Conference, Okinawa
  16. stars.web.psi.ch /21 fPCA of Reflood Curves (2) • Plotting the

    ⋅ can assist in its interpretation Modes Explained Variability Interpretation 1st 50.05 % Vertical shift in the amplitude of transient temperature prior to quenching 2nd 34.38 % Convexity/Concavity of the temperature descent 3rd 4.68 % Vertical shift of the quenching temperature • Loose interpretation of the mode (from observations) Slide 16 17 December 2014 NUTHOS-10 Conference, Okinawa
  17. stars.web.psi.ch /21 fPCA of Reflood Curves (3) • Registration procedure

    yields additional functional dataset: the time warping functions. • The same procedure for fPCA applies as shown in the table Datasets Mode Explained Variability Interpretation Registered Reflood Curves 1st 50.05 % Vertical shift in the amplitude of temperature transient prior to quenching 2nd 34.38 % Convexity/Concavity of the temperature descent 3rd 4.68 % Vertical shift of the quenching temperature Time-warping Functions 1st 79.27 % Shift in the landmarks 2nd 20.35 % Variation in the separation of landmarks We have reduced the dimensionality of the dataset from infinite to 5 dimensions while capturing salient features of the variability in reflood curves ( next: multivariate analysis? ) Slide 17 17 December 2014 NUTHOS-10 Conference, Okinawa
  18. stars.web.psi.ch /21 Summarizing Principal Component Scores • The scores of

    PC1 from registered curves and warping functions taken as bivariate data and presented in bagplot6. • The bag collects 50% of data points closest together in terms of halfspace depth, the outer collects the rest except outliers • Interquartile range (IQR) (Bag), Range (Outer), and Outlier can be defined in functional sense7 bag outer Slide 18 17 December 2014 NUTHOS-10 Conference, Okinawa
  19. /20 Conclusion and Outlook Slide 19 We applied Functional Data

    Analysis methodology to 100 synthetic reflood curves from TRACE code output to give summary statistics from a set of curves considering their overall salient features. We showed several important first steps of FDA applied to the synthetic dataset to answer descriptive questions: 1. What is the average curve ? Registration procedure separates amplitude and phase variation, gives way to define a proper mean function 2. How the curves actually vary ? In terms of what ? Functional principal component analysis exposes the variability in terms of 5 modes of variations (fPCs) 3. How to summarize this variations ? PC scores associated with each curves can be summarized to give simple statistical description of the dataset 4. Which of the curves are actually off ? Functional outlier can be identified through looking at the PC scores simultaneously
  20. /20 Conclusion and Outlook Slide 20 Thanks a lot for

    your attention Acknowledgments: • Dr. Carl Adamsson, Vattenfall AB • Dr. Gregory Perret, LRS Paul Scherrer Institut • Swiss Federal Nuclear Safety Inspectorate (ENSI) • Swiss Federal Office of Energy (BFM) The study was (simply) an exercise in statistical description of a synthetic transient code output. Next: Global sensitivity analysis of TRACE reflood model using FDA-derived measures as alternative quantities of interest. Requires robust statistical design to derive proper conclusion about which input parameters are important to which output variation
  21. stars.web.psi.ch /21 References 1 Perez et al., “Uncertainty and sensitivity

    Analysis of a LBLOCA in a PWR NPP: Results of the Phase V of the BEMUSE programme,” Nucl. Eng. Des., vol. 241, pp. 4206-4222, 2011 2 Wicaksono et al., “Sensitivity Analysis of a Bottom Reflood Simulation using the Morris Screening Method,” NUTHOS-10 Conference, Dec. 14-18, Okinawa, Japan, 2011 3 J. Ramsay and B. W. Silverman, “Functional Data Analysis,” 2nd Edition, New York: Springer Science+Business Media, LLC, 2005. 4 R Core Team, “R: a Language and Environment for Statistical Computing,” R Foundation for Statistical Computing, Vienna, Austria, 2014, http://www.R-project.org 5 Ramsay et al., “fda: Functional Data Analysis,” R Package version 2.4.0, The Comprehensive R Archive Network (CRAN), 2013 6 P. Rousseeuw et al., “The bagplot: A Bivariate Boxplot,” The American Statistician, Vol. 53, No. 4, 1999 7 R. Hyndman and H. Shang, “Rainbow Plots, Bagplots, and Boxplots for Functional Data”, Journal of Computational and Graphical Statistics, Vol. 19, No. 1, pp 29-45, 2010 Slide 21 17 December 2014 NUTHOS-10 Conference, Okinawa