Upgrade to Pro — share decks privately, control downloads, hide ads and more …

Speed Index, explained

Speed Index, explained

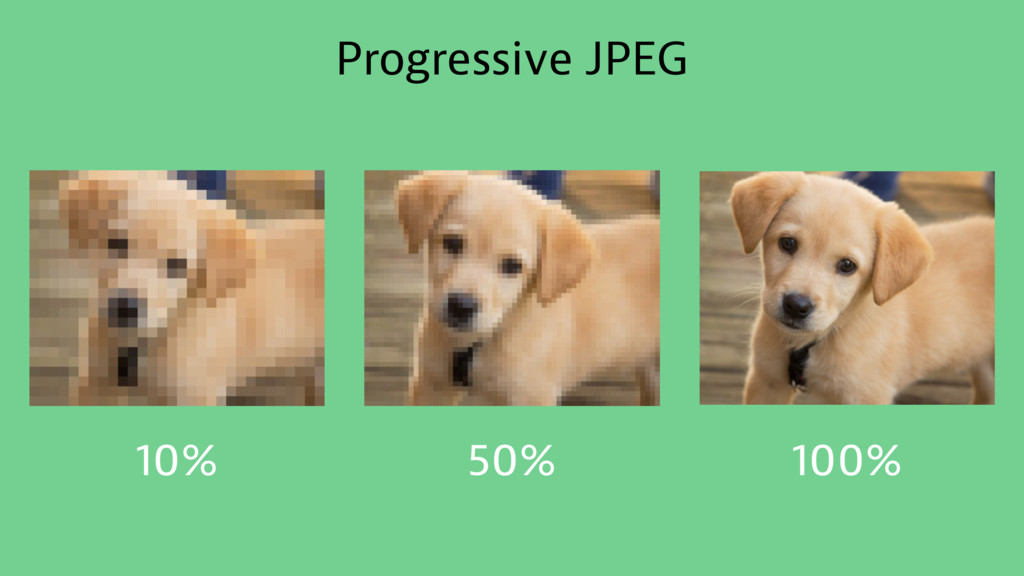
In the land of web performance metrics, Speed Index is one of the most promising and robust ones around. Taking the visual progress on the user's screen into account instead of merely relying on navigation timings, it promises to give real feedback on the user experience of your website.

But is it really the silver bullet? What's the catch? Can we even "cheat" on getting a better score? In this talk, we will get to the bottom of Speed Index:

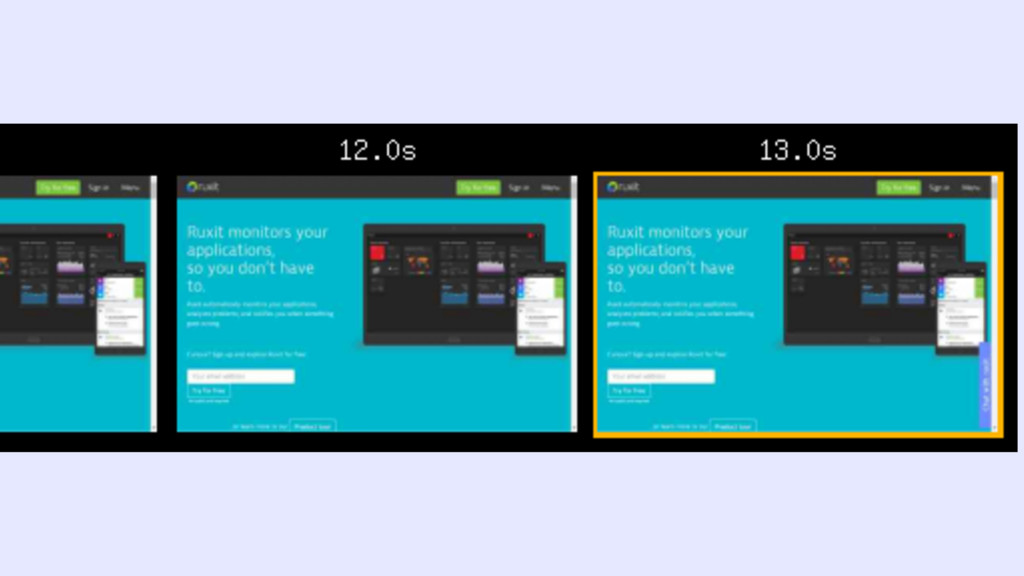
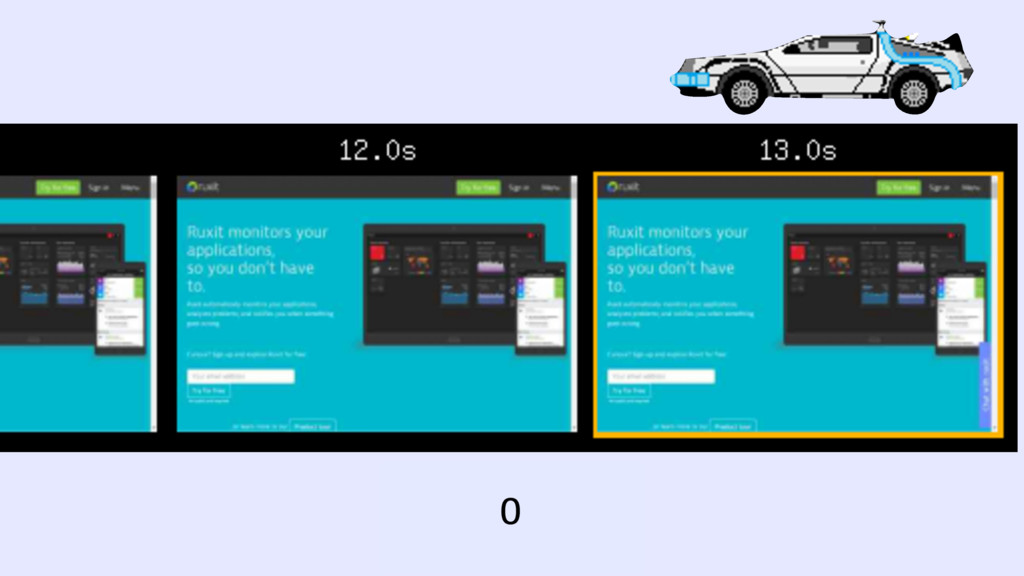
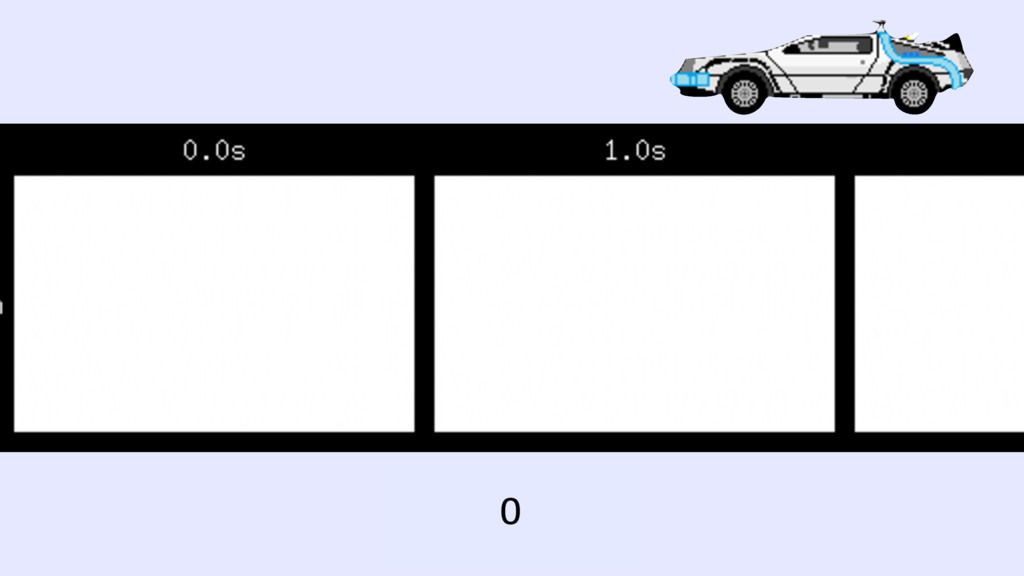
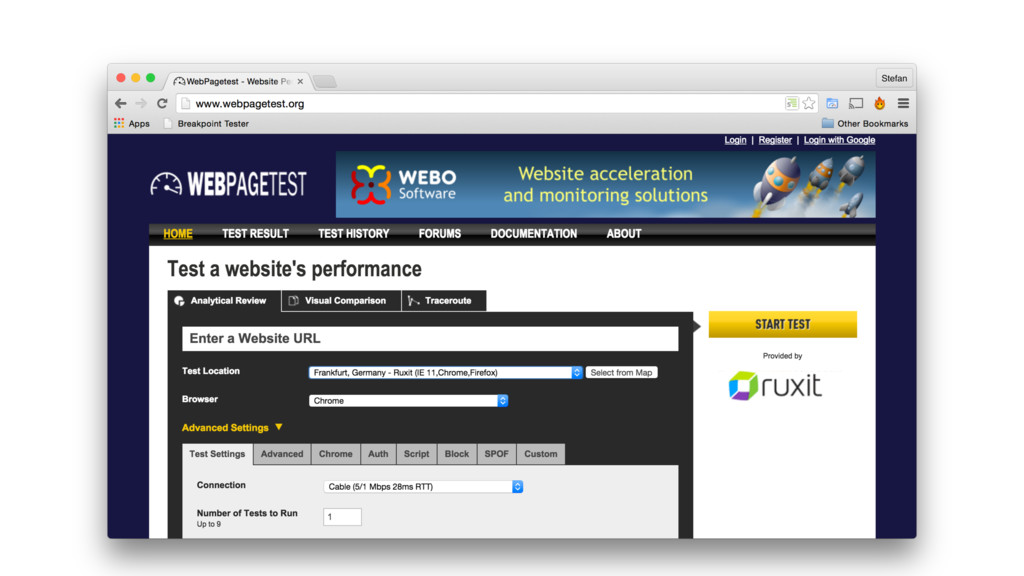
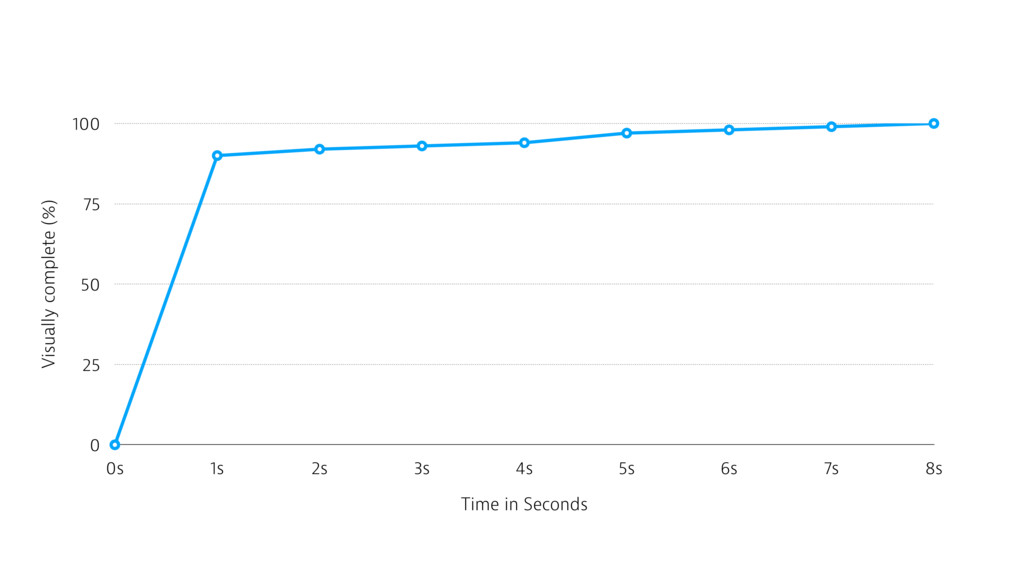
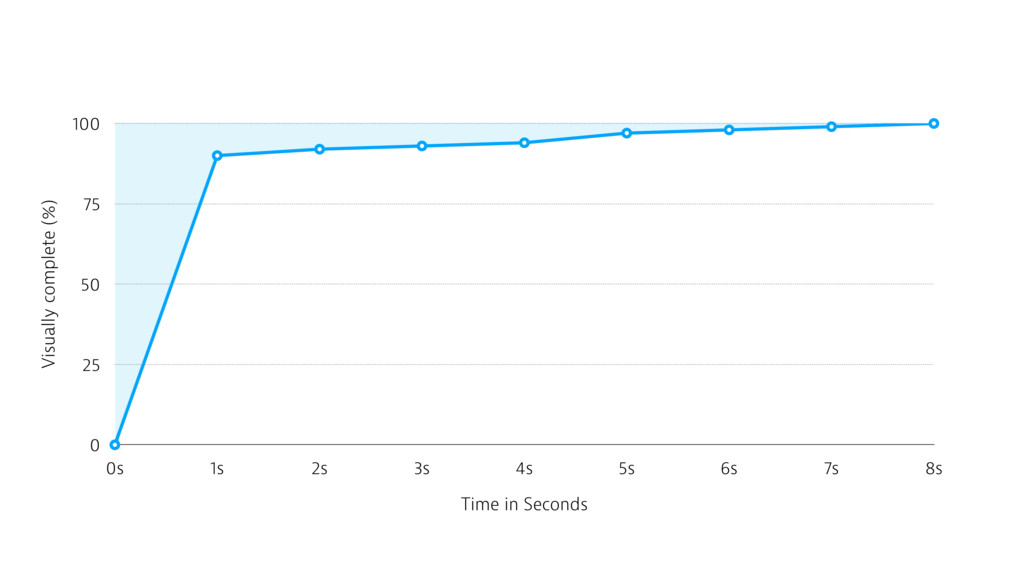
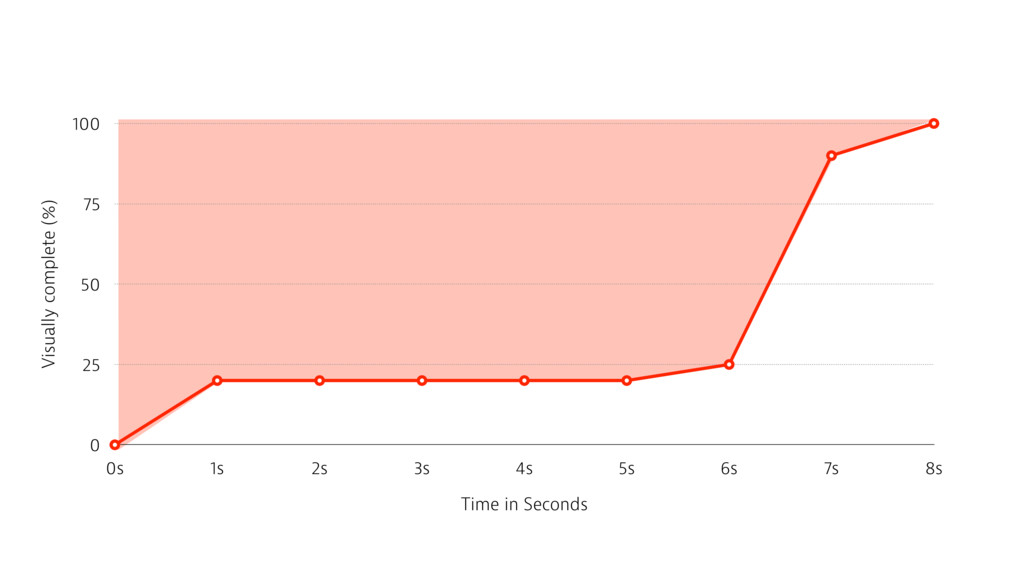
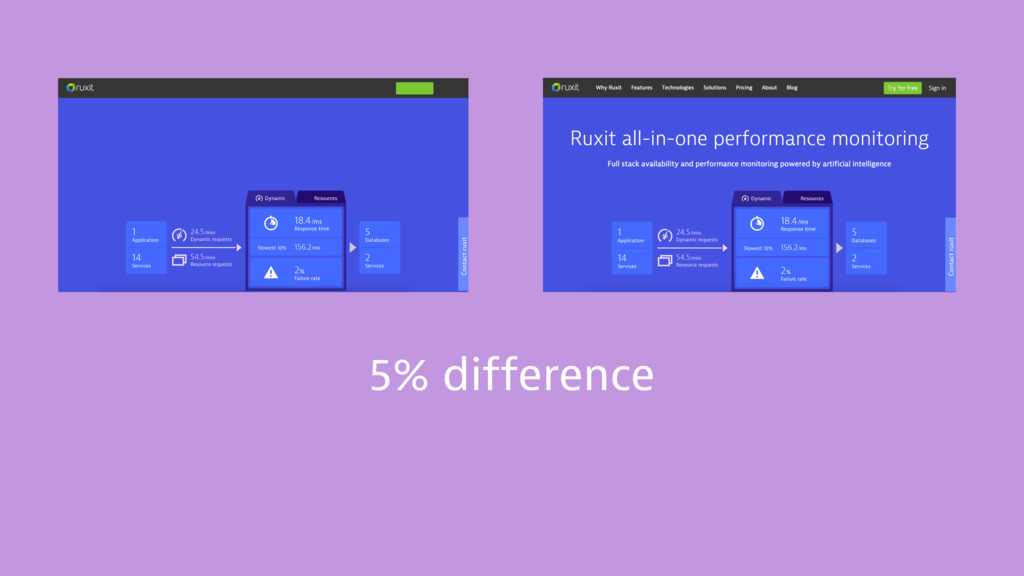
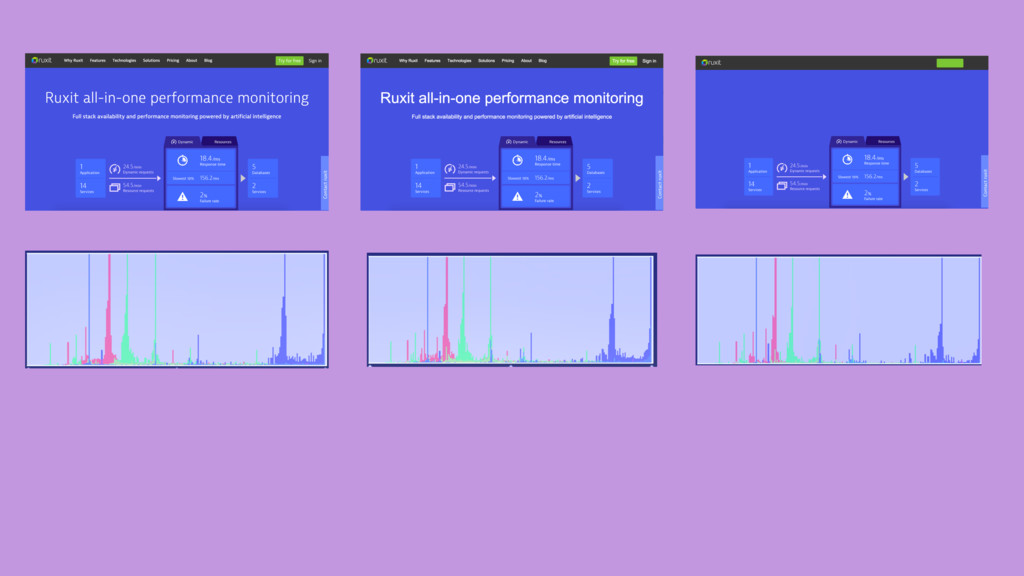
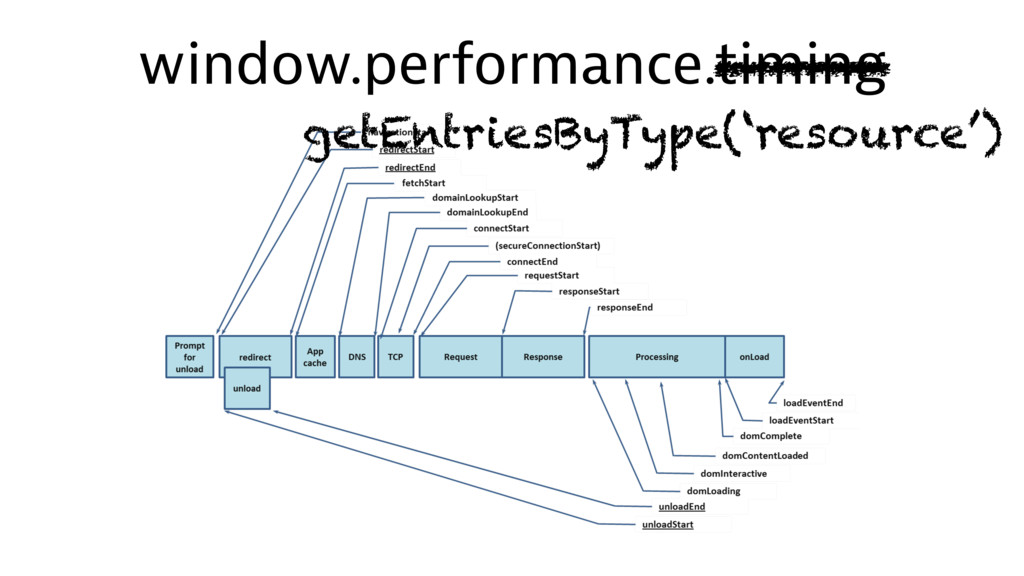
– We will learn how Speed Index is calculated and what you need to measure your own site's Speed Index
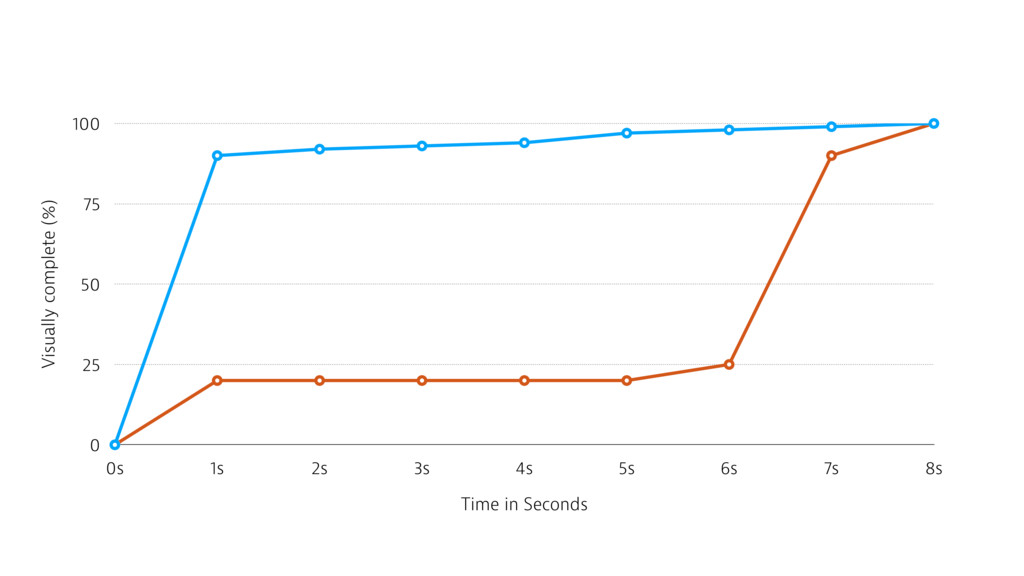
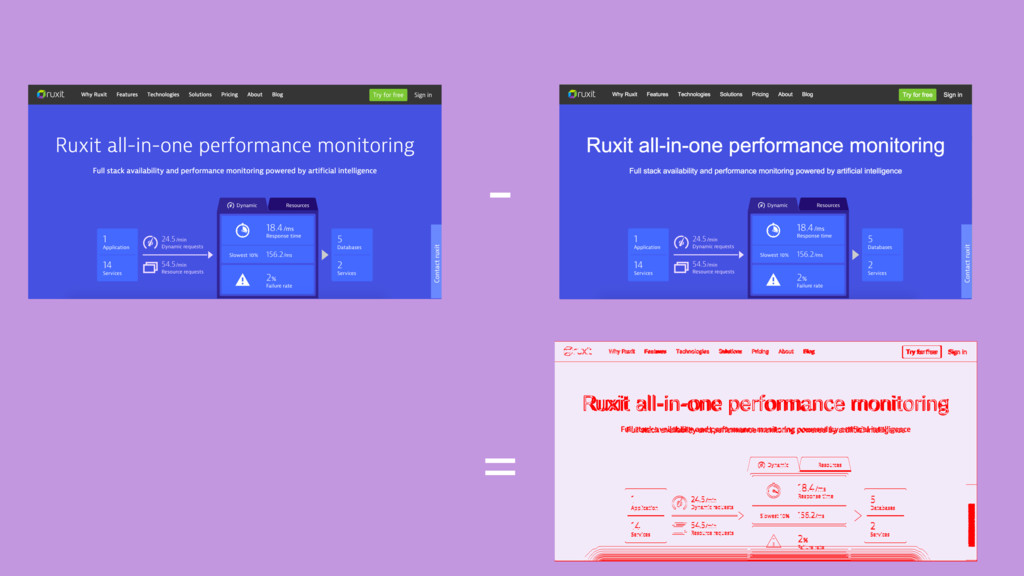
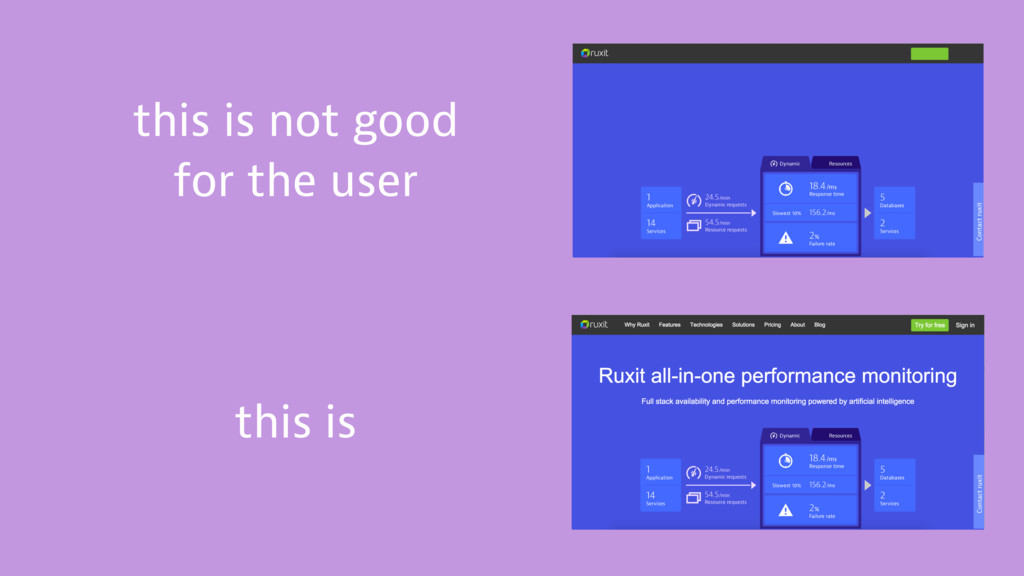
– We will see which pain points Speed Index tackles, and what you can do to optimize your site to get a better score
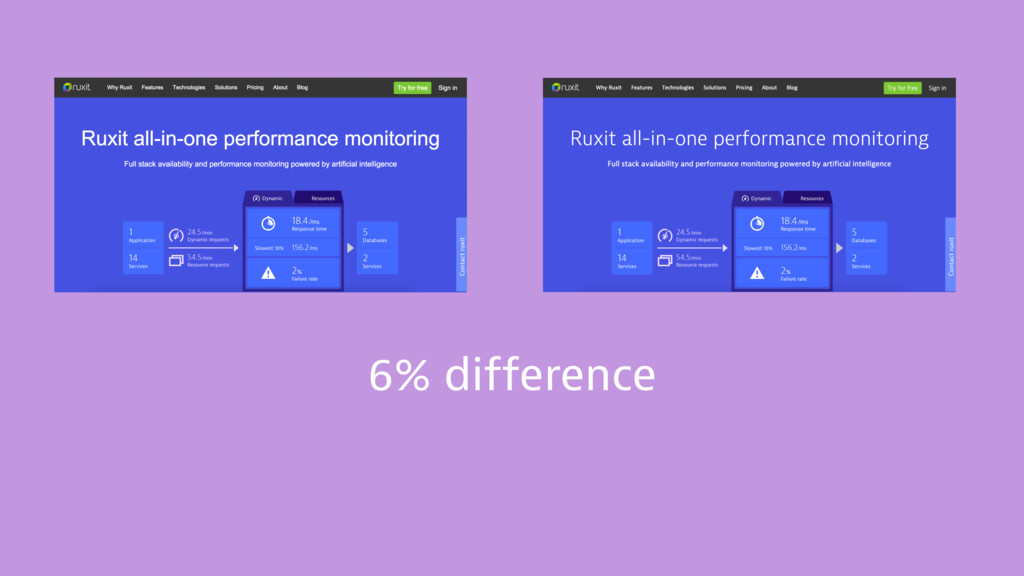
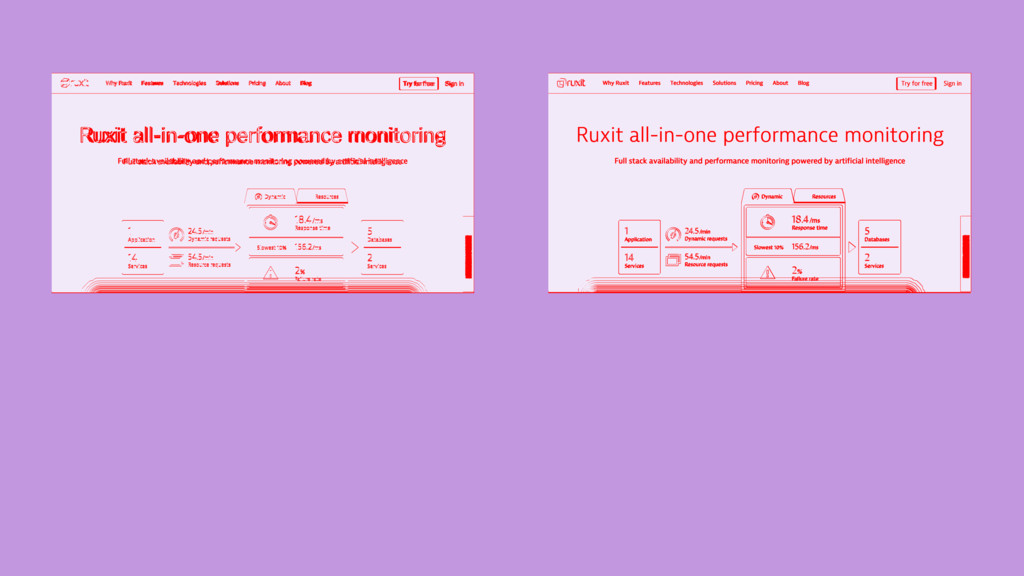
– We learn where the downsides of this metric are and if it should be of any concern to you
– Last, but not least, we will check how we can overcome those downsides with additional, non-disruptive monitoring to get an even better view of your site's performance.

Stefan Baumgartner

November 19, 2015
Tweet

More Decks by Stefan Baumgartner

Other Decks in Programming

Transcript

  1. Speed Index,
    Explained!
    Stefan Baumgartner | @ddprrt https://speakerdeck.com/ddprrt/speed-index-explained

    View Slide

  2. The page has to load in under
    3 seconds

    View Slide

  3. View Slide

  4. It works on my machine!

    View Slide

  5. View Slide

  6. The Dothraki have no word
    for “works on my machine”

    View Slide

  7. Use metrics!

    View Slide

  8. loading
    document.readyState
    loading
    DOMContentLoaded
    window.onload

    View Slide

  9. window.performance.timing

    View Slide

  10. View Slide

  11. Speed Index

    View Slide

  12. ∫ 1 - visuallycomplete/100
    0
    end

    View Slide

  13. What does this mean?

    View Slide

  14. View Slide

  15. View Slide

  16. View Slide

  17. View Slide

  18. View Slide

  19. Visually complete (%)
    0
    25
    50
    75
    100
    Time in Seconds
    0s 1s 2s 3s 4s 5s 6s 7s 8s

    View Slide

  20. Visually complete (%)
    0
    25
    50
    75
    100
    Time in Seconds
    0s 1s 2s 3s 4s 5s 6s 7s 8s

    View Slide

  21. Visually complete (%)
    0
    25
    50
    75
    100
    Time in Seconds
    0s 1s 2s 3s 4s 5s 6s 7s 8s

    View Slide

  22. Visually complete (%)
    0
    25
    50
    75
    100
    Time in Seconds
    0s 1s 2s 3s 4s 5s 6s 7s 8s

    View Slide

  23. Visually complete (%)
    0
    25
    50
    75
    100
    Time in Seconds
    0s 1s 2s 3s 4s 5s 6s 7s 8s

    View Slide

  24. Visually complete (%)
    0
    25
    50
    75
    100
    Time in Seconds
    0s 1s 2s 3s 4s 5s 6s 7s 8s

    View Slide

  25. So, how’s difference
    calculated?

    View Slide

  26. -
    =

    View Slide

  27. 6% difference

    View Slide

  28. 5% difference

    View Slide

  29. this is not good
    for the user
    this is

    View Slide

  30. View Slide

  31. View Slide

  32. Baseline JPEG
    10%

    View Slide

  33. Baseline JPEG
    10% 50%

    View Slide

  34. Baseline JPEG
    10% 50% 100%

    View Slide

  35. Gotcha!

    View Slide

  36. Baseline JPEG
    If the image loads gradually over 1 second,
    it has a SpeedIndex of 500

    View Slide

  37. Progressive JPEG
    10% 50% 100%

    View Slide

  38. Progressive JPEG
    The image is already ~77% complete at the
    beginning (it’s 23% different)

    View Slide

  39. Progressive JPEG
    So if it loads gradually over 1 second,
    it has a SpeedIndex of 113

    View Slide

  40. Some tricks …

    View Slide

  41. Webfonts

    View Slide

  42. Modern
    browser?
    Supports
    WOFF?
    Font in
    Storage
    Show
    Font
    Pre-Render

    View Slide

  43. Modern
    browser?
    Supports
    WOFF?
    Font in
    Storage
    Show
    Font
    No Font
    http://crocodillon.com/blog/non-blocking-web-fonts-using-localstorage
    Pre-Render

    View Slide

  44. localStorage
    available?
    Download
    Font
    Save in
    localStorage
    Show
    Font
    No Font
    http://crocodillon.com/blog/non-blocking-web-fonts-using-localstorage
    Post-Render

    View Slide

  45. Critical Path CSS

    View Slide

  46. View Slide


  47. blocking!

    View Slide


  48. blocking!
    <br/>blocking!<br/>

    View Slide


  49. blocking!
    <br/>blocking!<br/>start render<br/>

    View Slide


  50. blocking!
    <br/>blocking!<br/>start render?<br/>

    View Slide

  51. <br/>…<br/>

    <br/>loadCSS(‘main.css’)<br/>
    <br/>

    View Slide

  52. <br/>…<br/>

    <br/>loadCSS(‘main.css’)<br/>
    <br/>

    View Slide

  53. <br/>…<br/>

    <br/>loadCSS(‘main.css’)<br/>
    <br/>

    View Slide

  54. View Slide

  55. View Slide

  56. I’m not 100% happy with Critical Path CSS

    View Slide

  57. View Slide

  58. View Slide

  59. View Slide

  60. There is still one thing however…

    View Slide

  61. Speed Index should give you an
    idea how the user feels when
    using your website

    View Slide

  62. … so why is everything
    done by a machine

    View Slide

  63. … so why is everything
    done by a machine

    View Slide

  64. View Slide

  65. View Slide

  66. View Slide

  67. View Slide

  68. View Slide

  69. Let’s do it on the client!

    View Slide

  70. GetRects();
    GetRectTimings();
    GetFirstPaint();
    GetFontTime();
    CalculateVisualProgress();
    CalculateSpeedIndex();

    View Slide

  71. GetRects();
    GetRectTimings();
    Get the visible rectangle for the things
    we care about.
    Get the timings of the resources inside

    View Slide

  72. window.performance.timing

    View Slide

  73. window.performance.timing
    getEntriesByType(‘resource’)

    View Slide

  74. View Slide

  75. View Slide

  76. View Slide

  77. GetFirstPaint();
    Calculate the timing when the browser
    painted first.

    View Slide

  78. // IE and Edge
    window.performance.timing.msFirstPaint
    // Chropera
    var times = window.chrome.loadTimes();
    times.firstPaintTime

    View Slide

  79. // Every other browser
    var headURLs = {};
    var headElements =
    doc.getElementsByTagName('head')[0].children;
    for (var i = 0; i < headElements.length; i++) {
    //get stylesheets and non-async scripts
    ...
    }
    // compare with resource timing
    var requests =
    win.performance.getEntriesByType("resource");

    View Slide

  80. GetFontTime();
    Check all font resources and do
    resource timings …

    View Slide

  81. CalculateSpeedIndex();
    Given the visual progress information,
    calculate the speed index.

    View Slide

  82. resource1
    firstPaint
    resource3
    resource4
    endofPaint
    responseStart
    document
    font

    View Slide

  83. resource1
    firstPaint
    resource3
    resource4
    endofPaint
    responseStart
    blank, 1 point per ms! gradually
    document
    font

    View Slide

  84. var now = ruxitApi.now();
    var actionId =
    ruxitApi.enterAction(
    'Speed Index',
    'speedIndex',
    now - RUMSpeedIndex(),
    null);
    ruxitApi.leaveAction(actionId, now);
    Tell your monitor solution

    View Slide

  85. https://github.com/ddprrt/RUM-SpeedIndex

    View Slide

  86. @ddprrt
    @dynatrace
    @ruxit

    View Slide