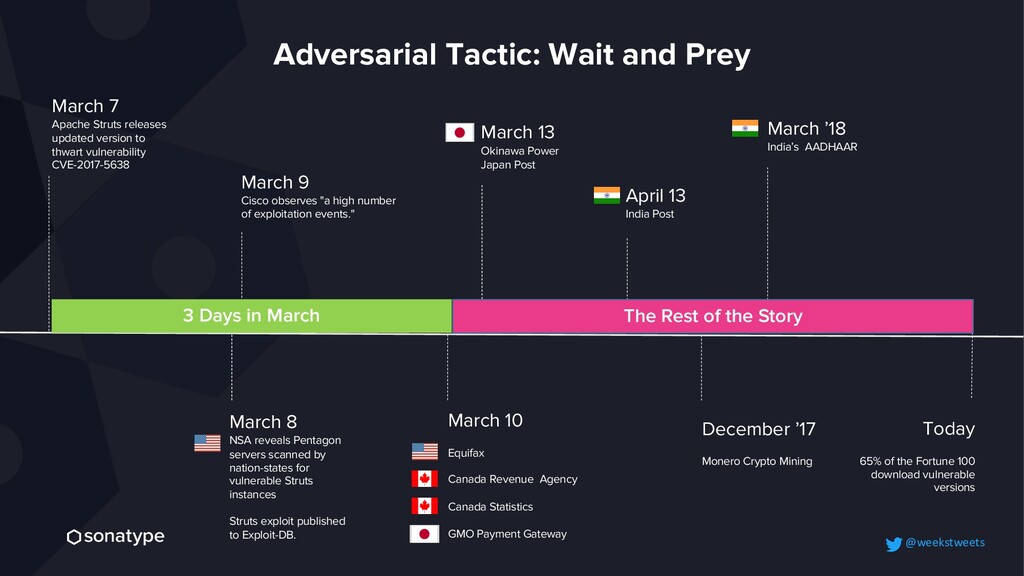
CVE-2017-5638 Today 65% of the Fortune 100 download vulnerable versions 3 Days in March March 8 NSA reveals Pentagon servers scanned by nation-states for vulnerable Struts instances Struts exploit published to Exploit-DB. March 10 Equifax Canada Revenue Agency Canada Statistics GMO Payment Gateway The Rest of the Story March 13 Okinawa Power Japan Post March 9 Cisco observes "a high number of exploitation events." March ’18 India’s AADHAAR April 13 India Post December ’17 Monero Crypto Mining Adversarial Tactic: Wait and Prey @weekstweets
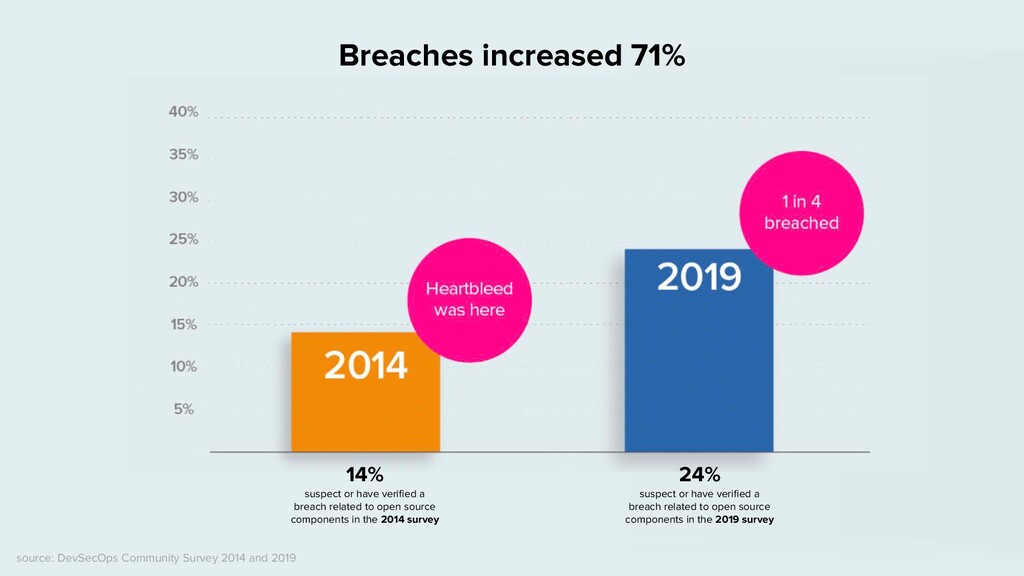
related to open source components in the 2019 survey 14% suspect or have verified a breach related to open source components in the 2014 survey source: DevSecOps Community Survey 2014 and 2019
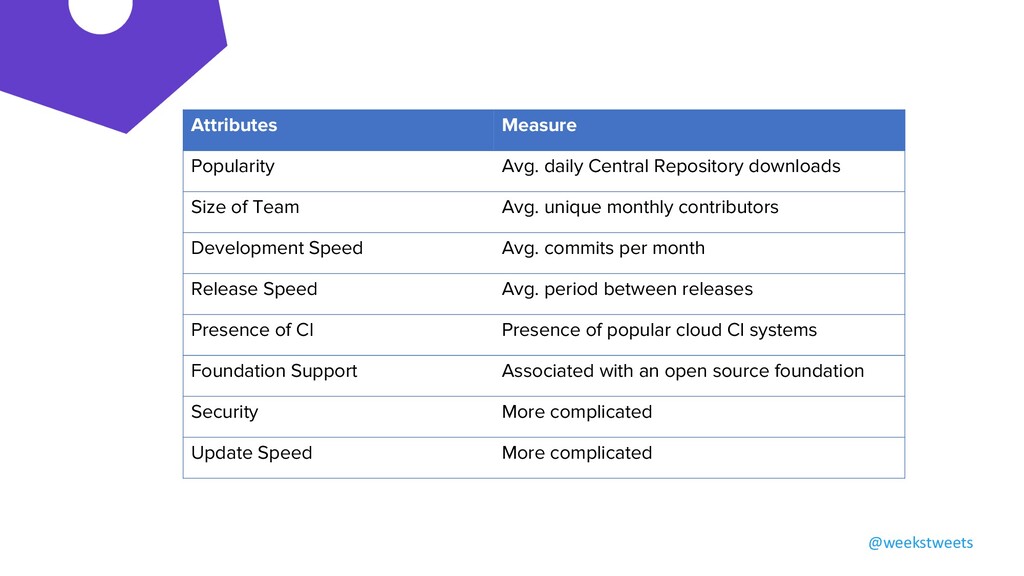
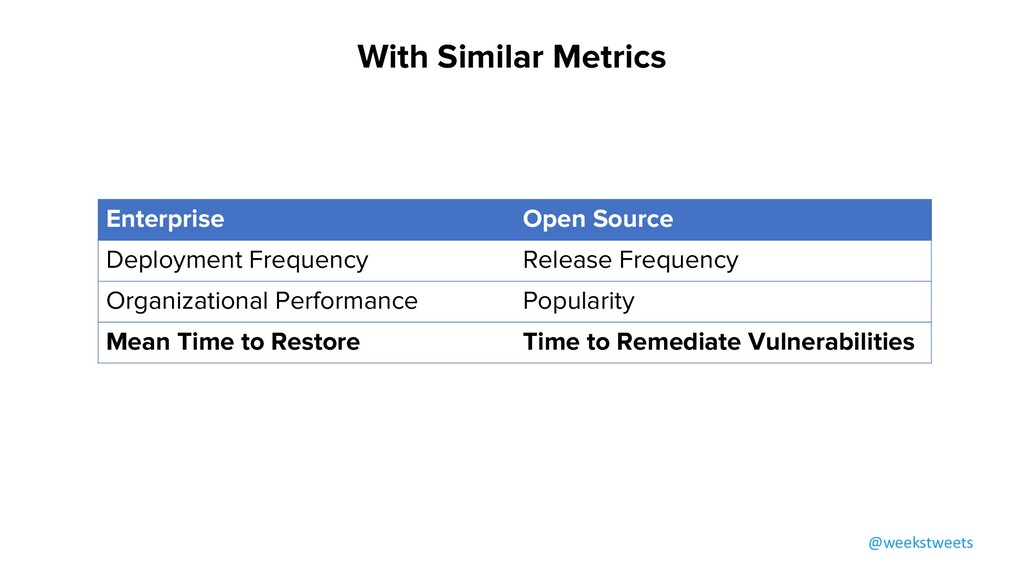
Team Avg. unique monthly contributors Development Speed Avg. commits per month Release Speed Avg. period between releases Presence of CI Presence of popular cloud CI systems Foundation Support Associated with an open source foundation Security More complicated Update Speed More complicated @weekstweets
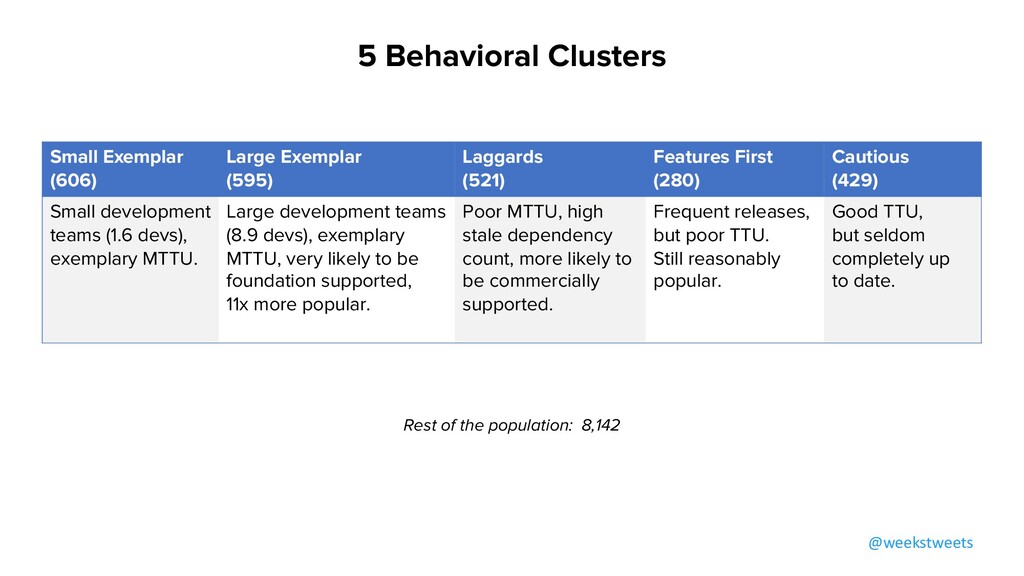
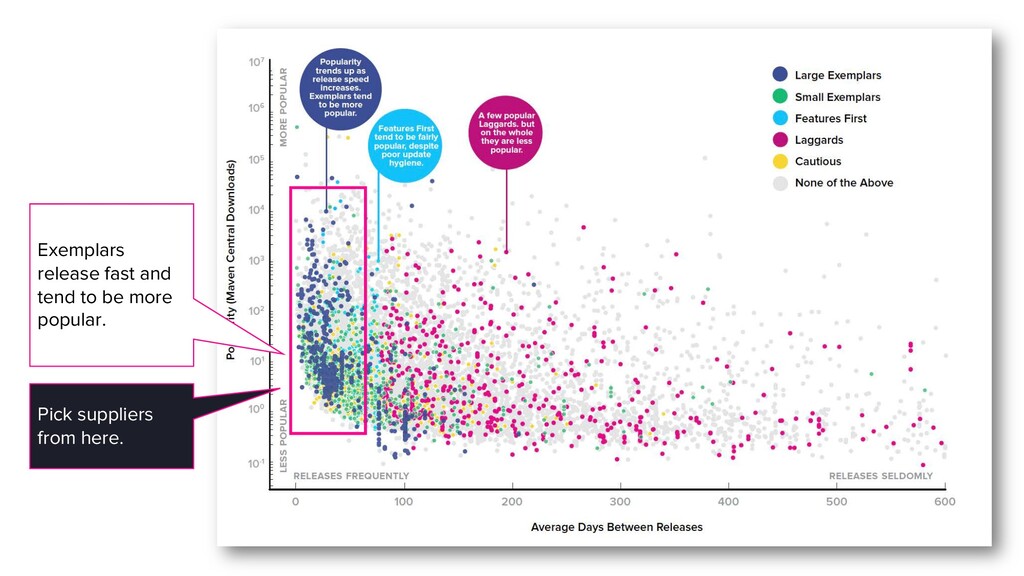
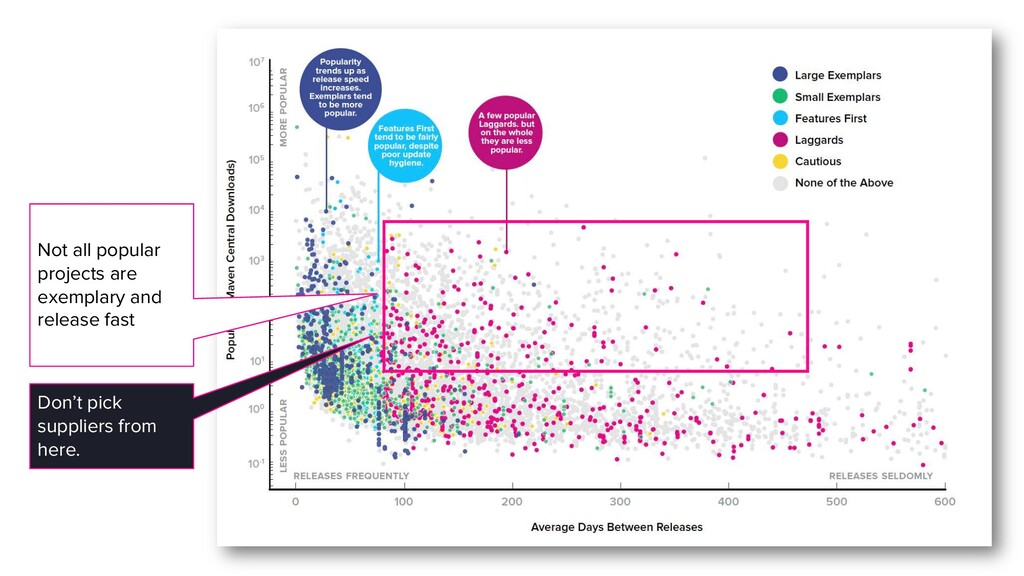
Laggards (521) Features First (280) Cautious (429) Small development teams (1.6 devs), exemplary MTTU. Large development teams (8.9 devs), exemplary MTTU, very likely to be foundation supported, 11x more popular. Poor MTTU, high stale dependency count, more likely to be commercially supported. Frequent releases, but poor TTU. Still reasonably popular. Good TTU, but seldom completely up to date. Rest of the population: 8,142
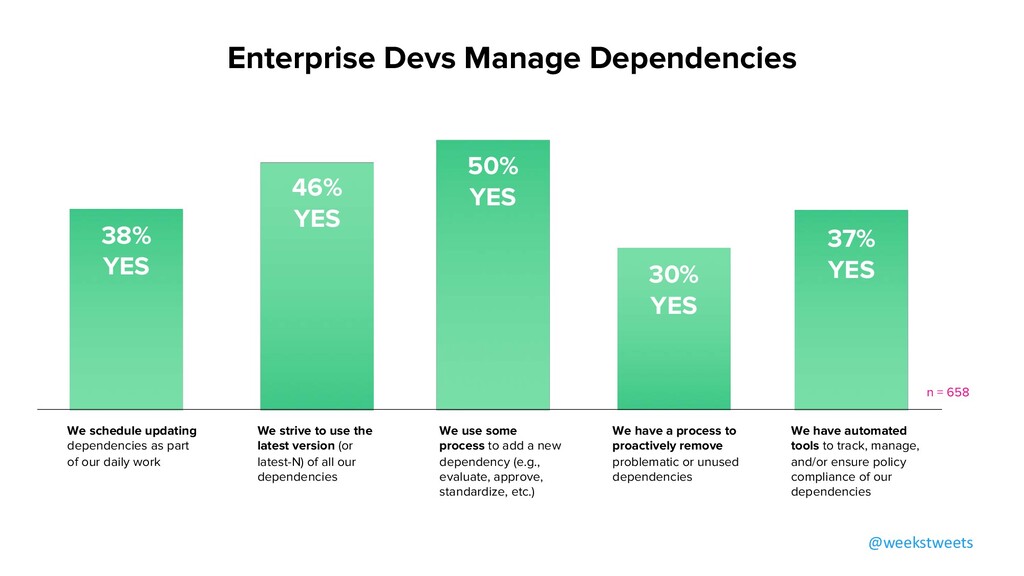
We strive to use the latest version (or latest-N) of all our dependencies We use some process to add a new dependency (e.g., evaluate, approve, standardize, etc.) We have a process to proactively remove problematic or unused dependencies We have automated tools to track, manage, and/or ensure policy compliance of our dependencies 46% YES 50% YES 30% YES 37% YES Enterprise Devs Manage Dependencies @weekstweets n = 658 38% YES
![[email protected]](https://files.speakerdeck.com/presentations/9f0be4f75d064061bbf69cce99e9fa08/slide_16.jpg)
![[email protected]](https://files.speakerdeck.com/presentations/9f0be4f75d064061bbf69cce99e9fa08/slide_72.jpg)