Upgrade to Pro — share decks privately, control downloads, hide ads and more …

Analyze your data with ELK

Analyze your data with ELK

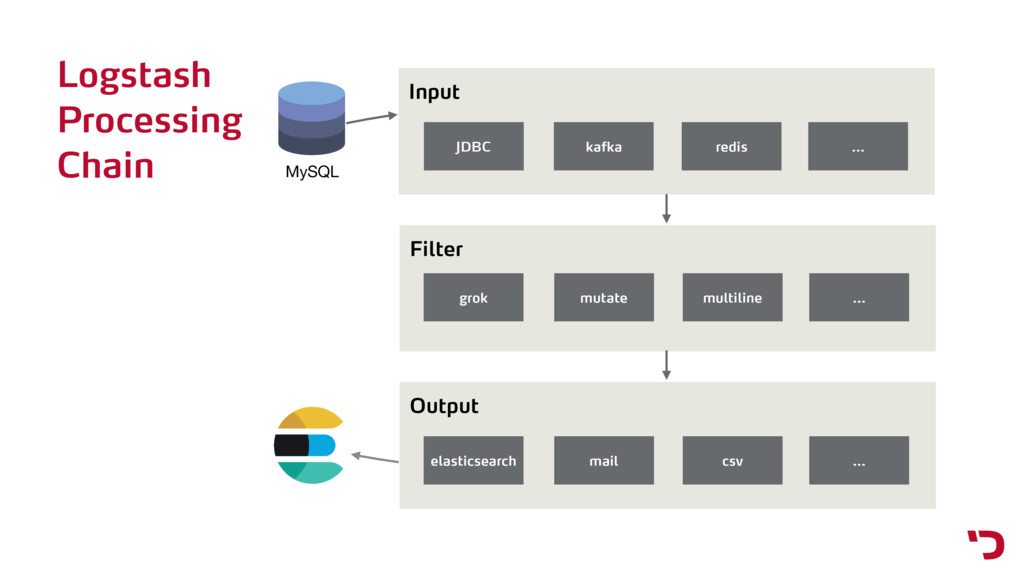
Analyze any kind of data with the Elasticsearch ELK stack. The talk describes how to import data from MySQL using Logstash, set up the mappings in Elasticsearch and visualize the data with Kibana.

Daniel Lienert

September 03, 2016
Tweet

More Decks by Daniel Lienert

Other Decks in Technology

Transcript

  1. Analyze your data with
    Daniel Lienert
    #t3dd16, 03.09.2016

    View Slide

  2. Daniel Lienert
    • Scrum Master / Software Architect
    • Neos Core Team Member
    • @dlienert

    View Slide

  3. How do you gain knowledge?
    • It’s not about solving a single question.
    • It’s about understanding the big picture and see the correlations.

    View Slide

  4. View Slide

  5. More and more data …
    Simple definition of big data:

    It doesn't fit in Excel
    Big Data?
    That is actually: 1,048,576 rows * 16,384
    columns * 32,767 Characters = ~4 Tb of data

    View Slide

  6. Agenda
    • Introduction to the Elasticsearch Stack
    • Configuration of the index pipeline by example
    • Analyze your data using Elasticsearch Kibana

    View Slide

  7. View Slide

  8. Elasticsearch
    Elasticsearch is an open source, distributed,
    scalable, document-oriented, RESTful, 
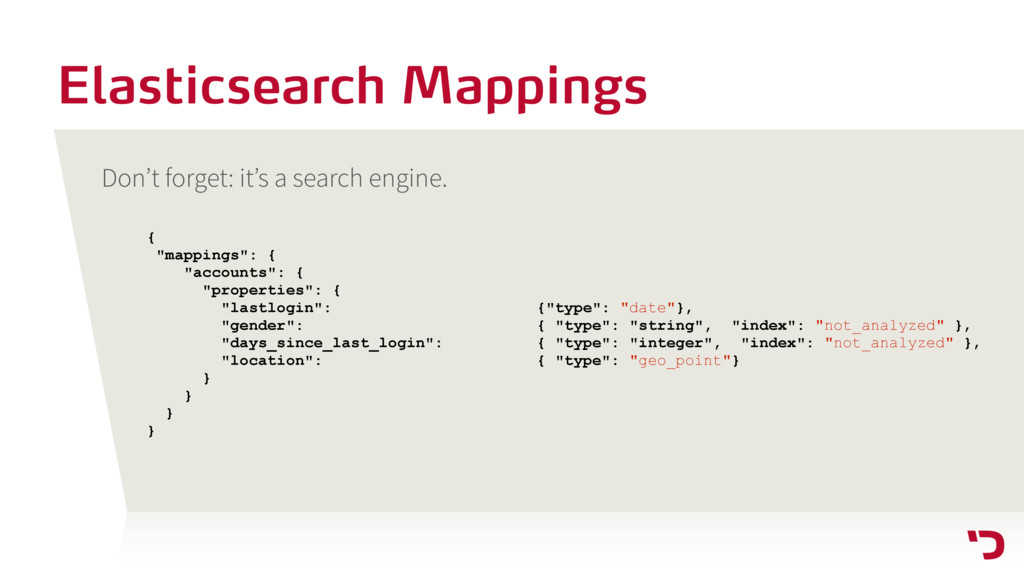
full text
    search engine with real-time search an analytics
    capabilities.
    Based on Apache Lucene. Combines search and
    powerful analytics.
    Provides a HTTP REST and a Java interface.

    View Slide

  9. Logstash
    Logstash is a flexible, open source data
    collection, enrichment and transportation
    pipeline.
    Every message is passed through a pipeline
    with input filter and output steps.

    View Slide

  10. Kibana
    Kibana is an open source data visualization
    platform that allows you to interact with your
    data through powerful graphics.
    Visualizations that also act as filters can be
    combined into custom dashboards that help
    you gain and insights from your data.

    View Slide

  11. Beats
    Beats are the future data shippers for
    Elasticsearch. A growing set of beats cover
    inputs from network packets to log files or
    infrastructure data.
    Beats is also a platform to building a variety of
    lightweight custom shippers to leverage any
    type of data you like.

    View Slide

  12. JDBC
    Logfiles
    Metrics
    Network
    redis
    Varnish

    View Slide

  13. Logstash
    Processing
    Chain MySQL
    Input
    JDBC kafka …
    redis
    Filter
    grok mutate …
    multiline
    Output
    elasticsearch mail …
    csv

    View Slide

  14. Logstash input
    input {
    jdbc {
    jdbc_connection_string => "jdbc:mysql://localhost:3306/typo3"
    jdbc_user => "typo3"
    jdbc_driver_library => "mysql-connector-java-5.1.39-bin.jar"
    jdbc_driver_class => "com.mysql.jdbc.Driver"
    statement => "SELECT * FROM fe_users"
    }
    }

    View Slide

  15. Transactional
    • Records are continuously
    added and stay static
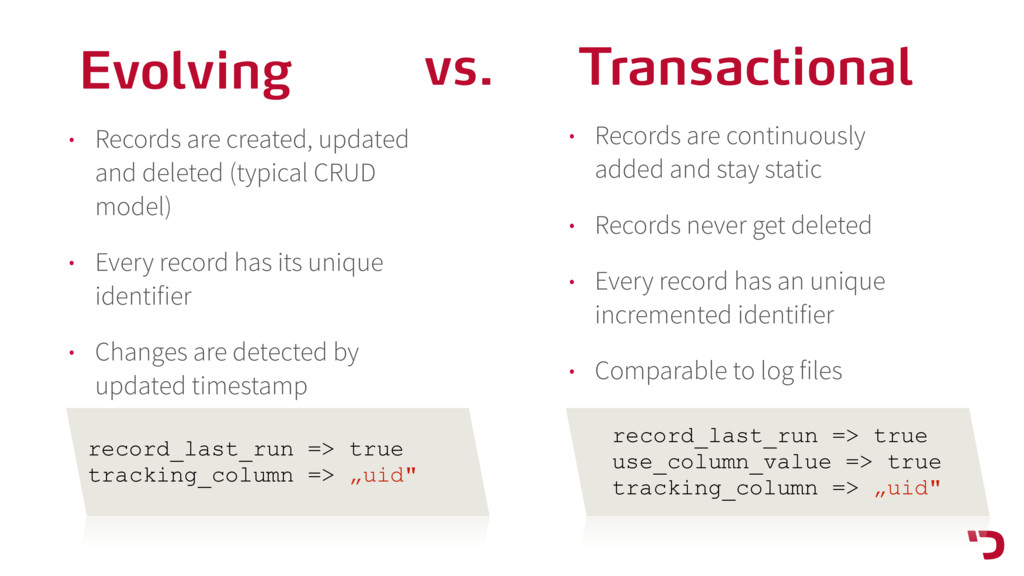
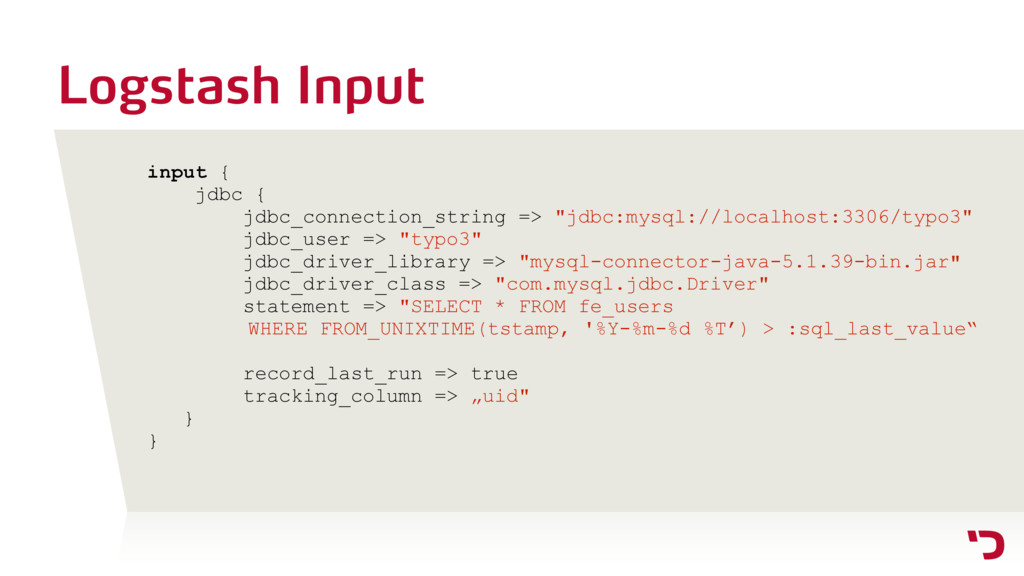
    • Records never get deleted
    • Every record has an unique
    incremented identifier
    • Comparable to log files
    Evolving
    • Records are created, updated
    and deleted (typical CRUD
    model)
    • Every record has its unique
    identifier
    • Changes are detected by
    updated timestamp
    vs.
    record_last_run => true
    use_column_value => true
    tracking_column => „uid"
    record_last_run => true
    tracking_column => „uid"

    View Slide

  16. Logstash Input
    input {
    jdbc {
    jdbc_connection_string => "jdbc:mysql://localhost:3306/typo3"
    jdbc_user => "typo3"
    jdbc_driver_library => "mysql-connector-java-5.1.39-bin.jar"
    jdbc_driver_class => "com.mysql.jdbc.Driver"
    statement => "SELECT * FROM fe_users
    WHERE FROM_UNIXTIME(tstamp, '%Y-%m-%d %T’) > :sql_last_value“
    record_last_run => true
    tracking_column => „uid"
    }
    }

    View Slide

  17. Logstash Filter
    filter {
    mutate {
    split => {"usergroup" => ","}
    }
    }

    View Slide

  18. Logstash Output
    output {
    elasticsearch {
    index => "feusers"
    document_type => "feusers"
    document_id => "uid"
    hosts => ["127.0.0.1:9200"]
    }
    }

    View Slide

  19. Logstash Pipeline Multiplexing
    Problem: Logstash has only one single pipeline. Configuration files are just
    concatenated.
    input {
    jdbc {
    ...
    add_field => {
    doctype => "account"
    }
    }
    jdbc {
    ...
    add_field => {
    doctype => "sales"
    }
    }
    }
    Input
    filter {
    if [document_type] == "account" {
    mutate {
    split => {"usergroup" => ","}
    }
    }
    if [doctype] == "sales" {
    json {
    source => "statistics"
    target => "statistics"
    }
    }
    }
    Filter
    output {
    elasticsearch {
    hosts => ["127.0.0.1:9200"]
    document_type => "{doctype}"
    }
    }
    Output

    View Slide

  20. Logstash Pipeline and Multiplexing
    Split configuration to multiple files for more clarity.
    • 001.input-mysql-feusers.conf
    • 002.input-mysql-transactions.conf
    • 100.filter-feusers.conf
    • 101.filter-transactions.conf
    • 200.output-elasticsearch.conf

    View Slide

  21. Elasticsearch Mappings
    {
    "mappings": {
    "accounts": {
    "properties": {
    "lastlogin": {"type": "date"},
    "gender": { "type": "string", "index": "not_analyzed" },
    "days_since_last_login": { "type": "integer", "index": "not_analyzed" },
    "location": { "type": "geo_point"}
    }
    }
    }
    }
    Don’t forget: it’s a search engine.

    View Slide

  22. Elasticsearch Mappings
    Problem: Mappings can not be changed.

    Solution: Versions, aliases and the reindex API.
    POST _aliases
    {
    "actions": [{
    "add": {
    "alias": "accounts",
    "index": "accounts_v1"
    }
    }]
    }
    Use Aliases
    POST _reindex
    {
    "source": {
    "index": „accounts_v1"
    },
    "dest": {
    "index": „accounts_v2"
    }
    }
    Reindex
    PUT accounts_v2 {
    "mappings": {
    "accounts": {
    "properties": {
    "lastlogin": {
    "type": "integer"}
    }
    }
    }
    }
    Add a new Index

    View Slide

  23. Let’s have fun
    with data!
    Kibana live demonstration

    View Slide

  24. Vielen Dank
    @dlienert

    View Slide