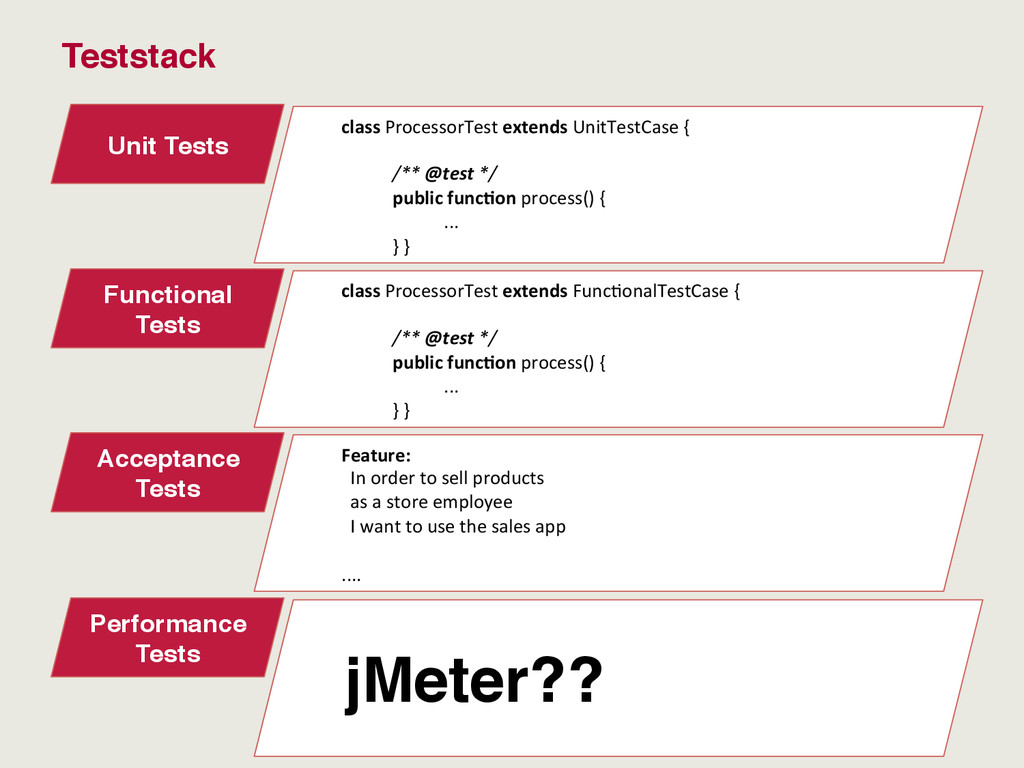
/** @test */ public func0on process() { ... } } Functional Tests class ProcessorTest extends Func<onalTestCase { /** @test */ public func0on process() { ... } } Acceptance Tests Feature: In order to sell products as a store employee I want to use the sales app .... Performance Tests jMeter??
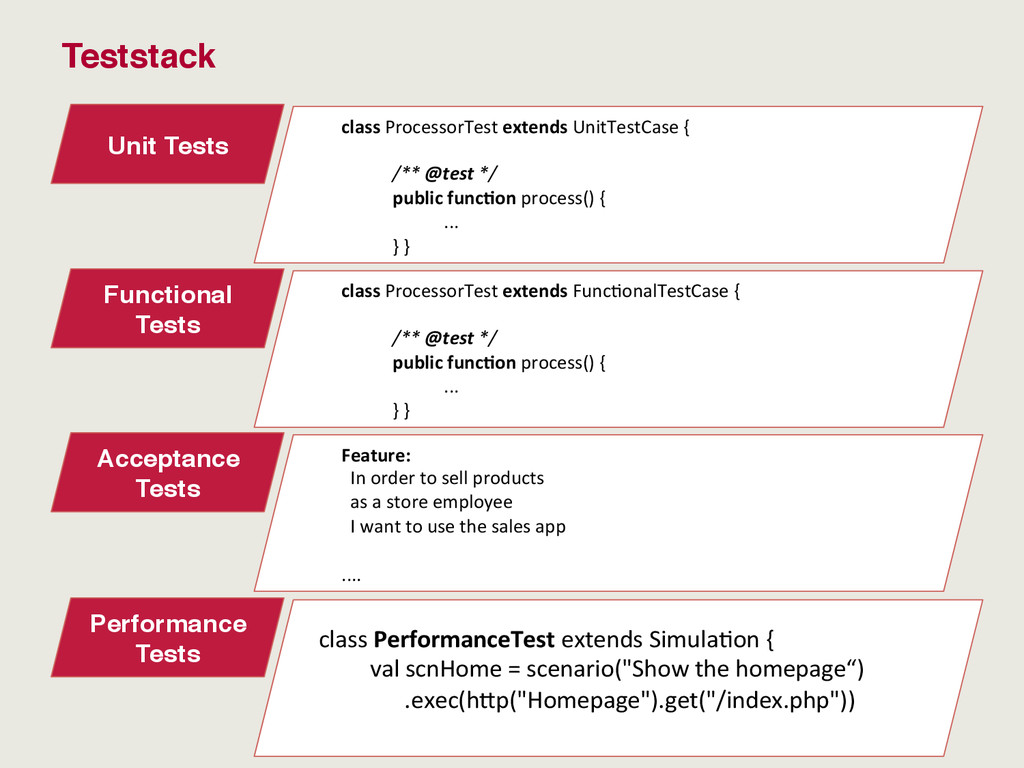
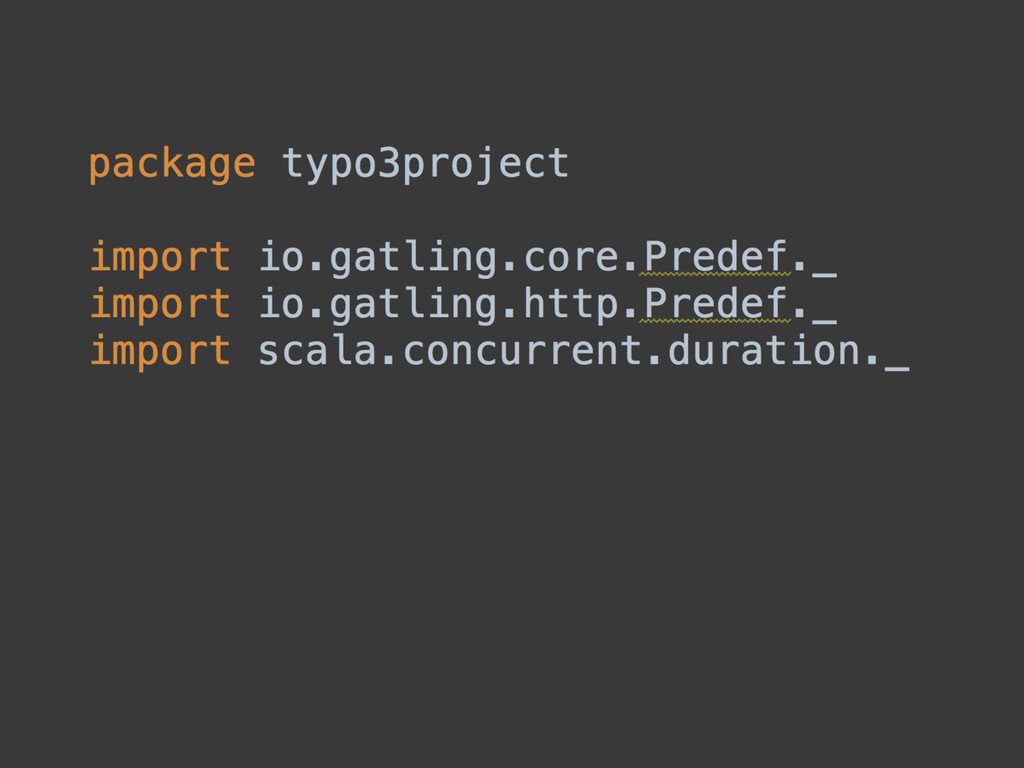
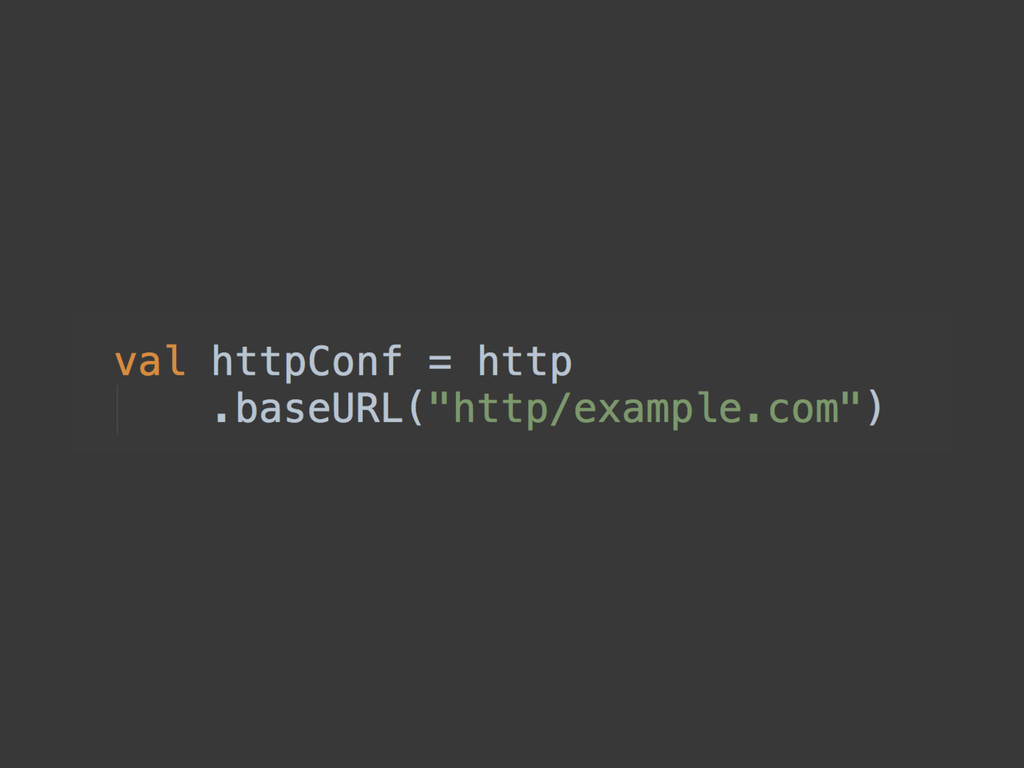
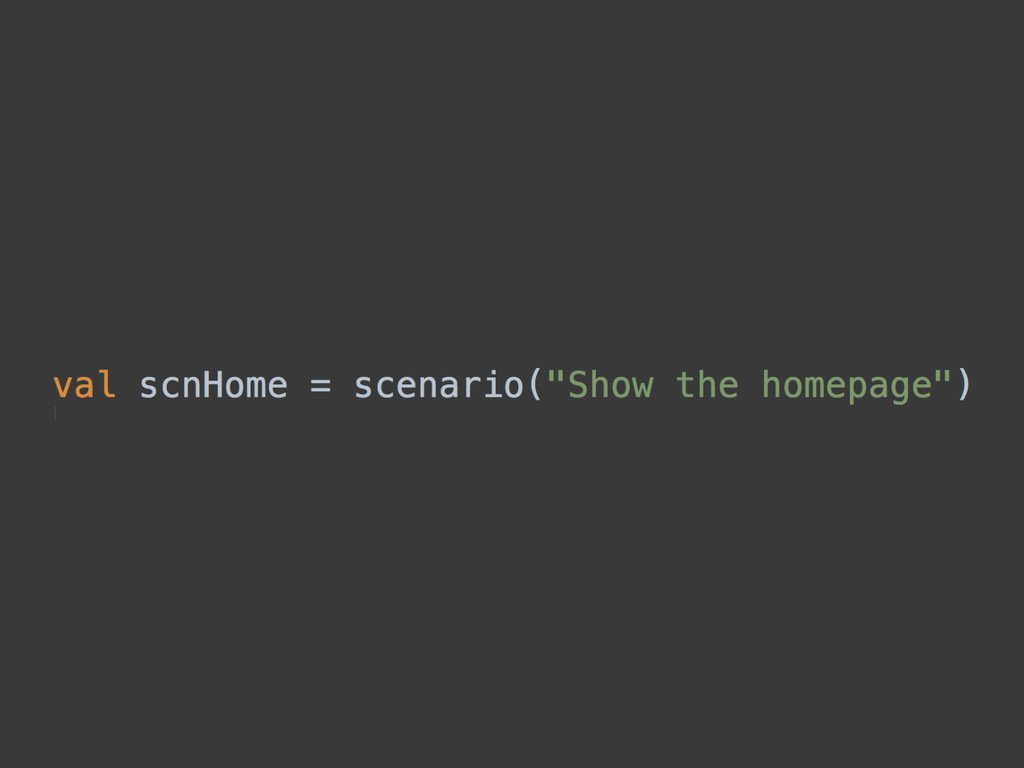
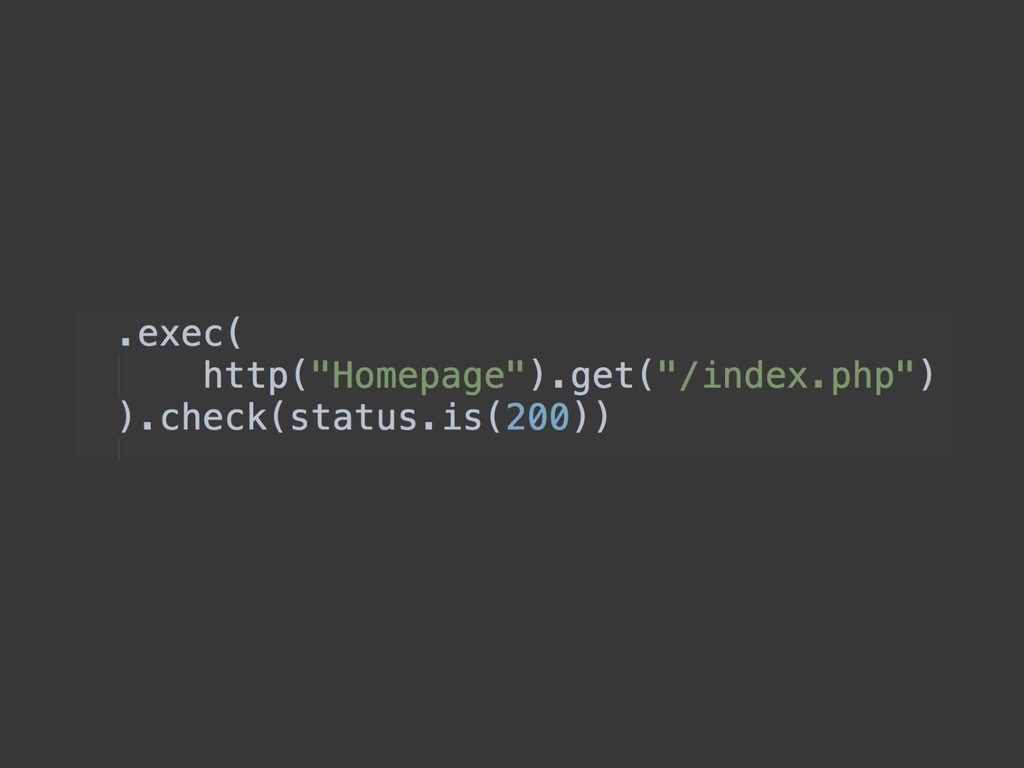
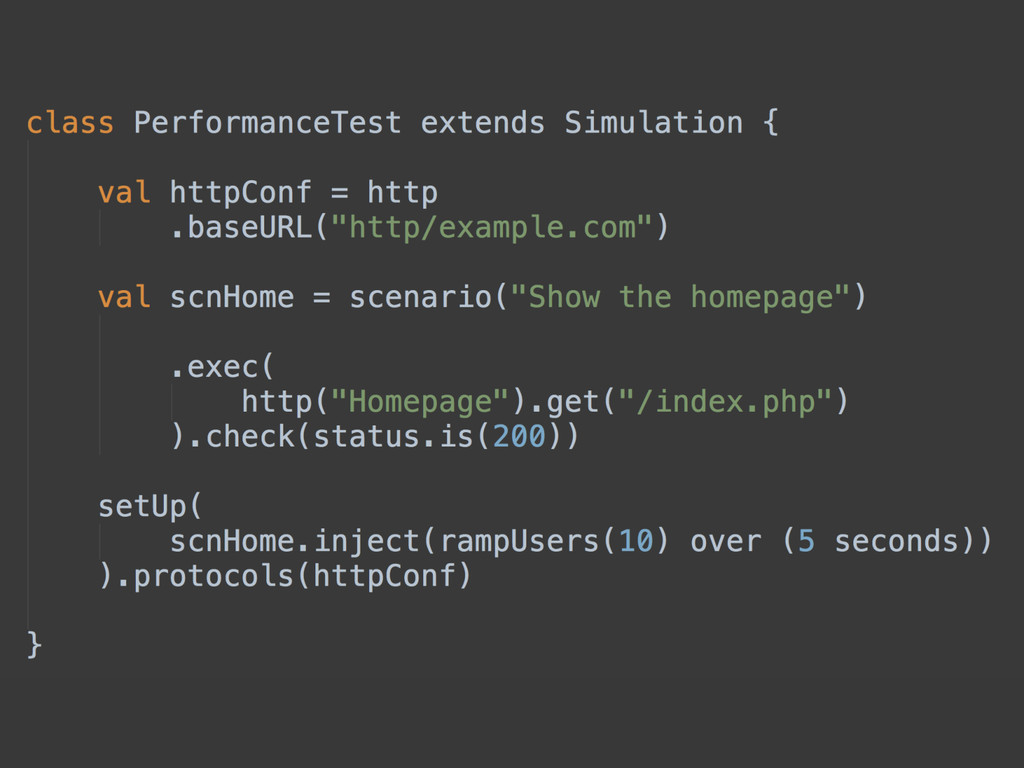
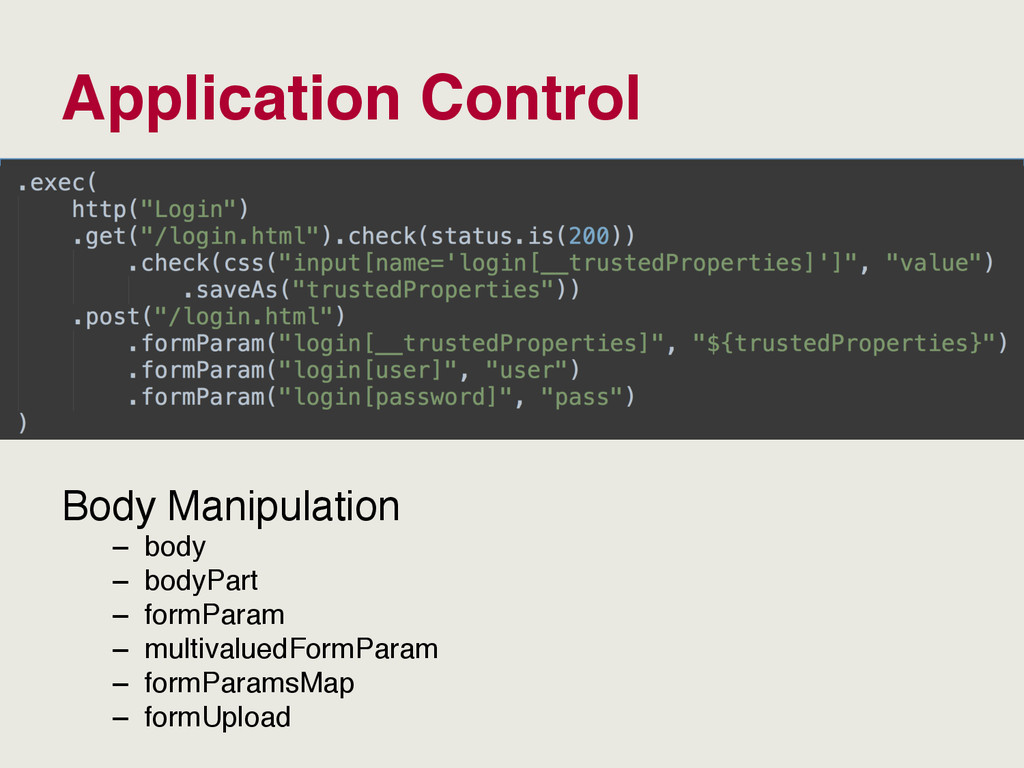
/** @test */ public func0on process() { ... } } Functional Tests class ProcessorTest extends Func<onalTestCase { /** @test */ public func0on process() { ... } } Acceptance Tests Feature: In order to sell products as a store employee I want to use the sales app .... Performance Tests class PerformanceTest extends Simula<on { val scnHome = scenario("Show the homepage“) .exec(hKp("Homepage").get("/index.php"))
![---- Show the homepage ---------------------------------------------------------! [##########################################################################]100%! waiting: 0 / active:](https://files.speakerdeck.com/presentations/572b77bcbf0e4d30874b34dd41f3d858/slide_24.jpg)