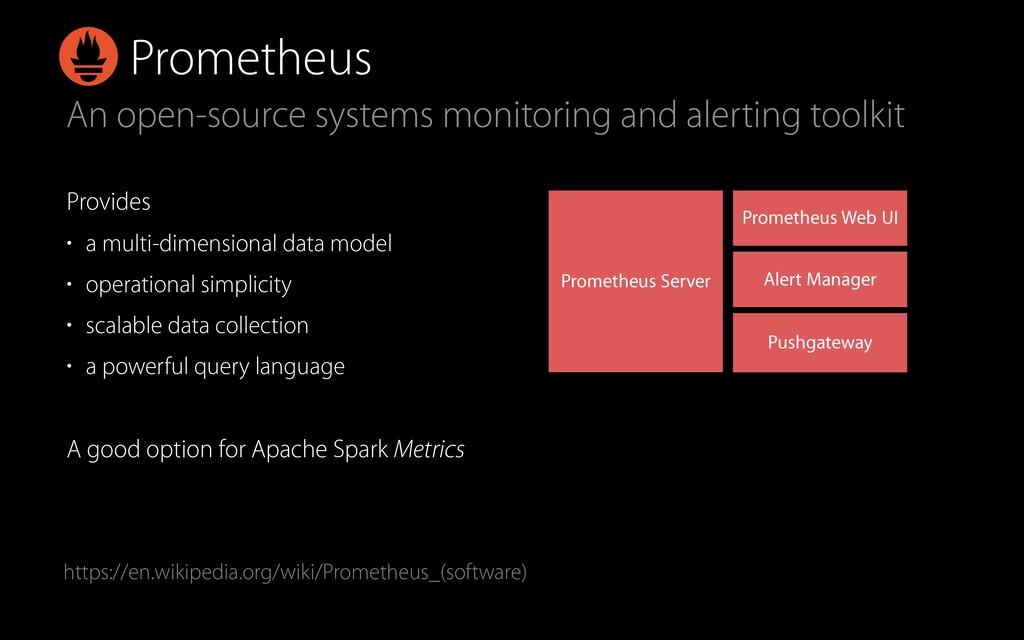
a multi-dimensional data model • operational simplicity • scalable data collection • a powerful query language A good option for Apache Spark Metrics Prometheus Server Prometheus Web UI Alert Manager Pushgateway https://en.wikipedia.org/wiki/Prometheus_(software)
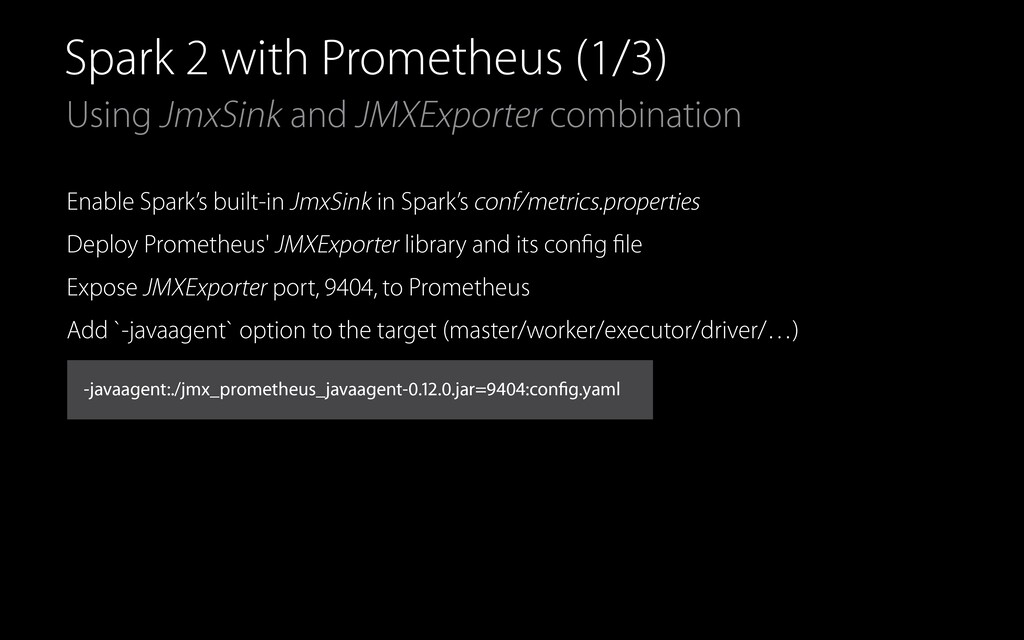
Enable Spark’s built-in JmxSink in Spark’s conf/metrics.properties Deploy Prometheus' JMXExporter library and its config file Expose JMXExporter port, 9404, to Prometheus Add `-javaagent` option to the target (master/worker/executor/driver/…) -javaagent:./jmx_prometheus_javaagent-0.12.0.jar=9404:config.yaml
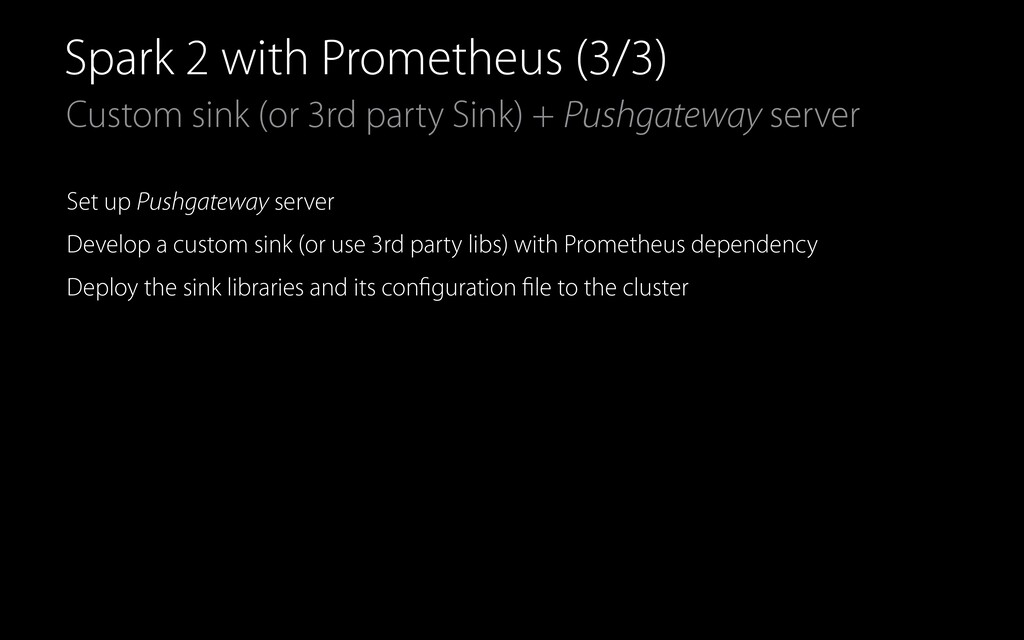
2 with Prometheus (3/3) Set up Pushgateway server Develop a custom sink (or use 3rd party libs) with Prometheus dependency Deploy the sink libraries and its configuration file to the cluster
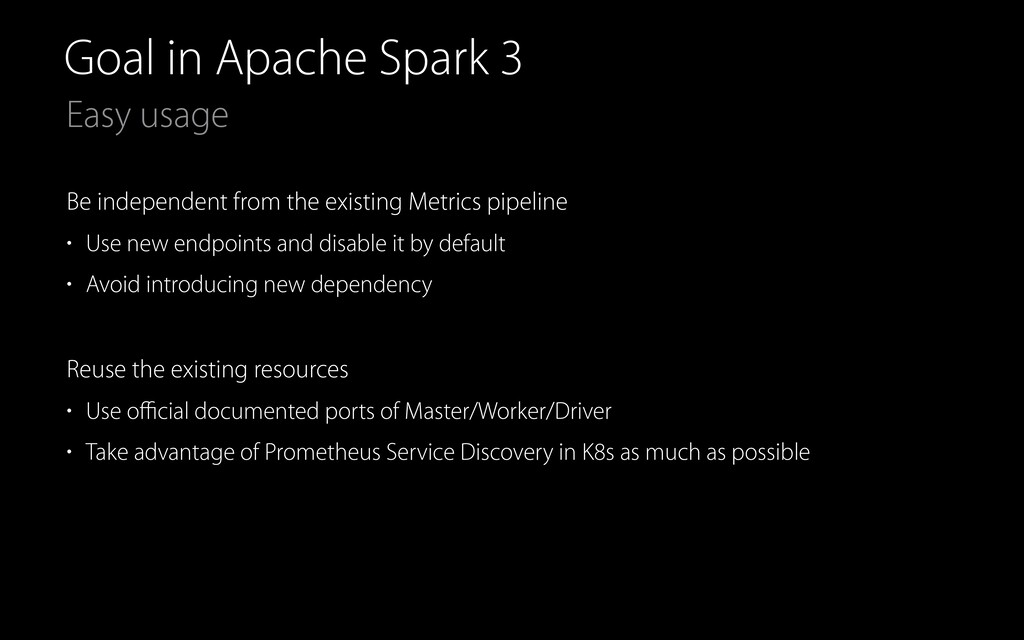
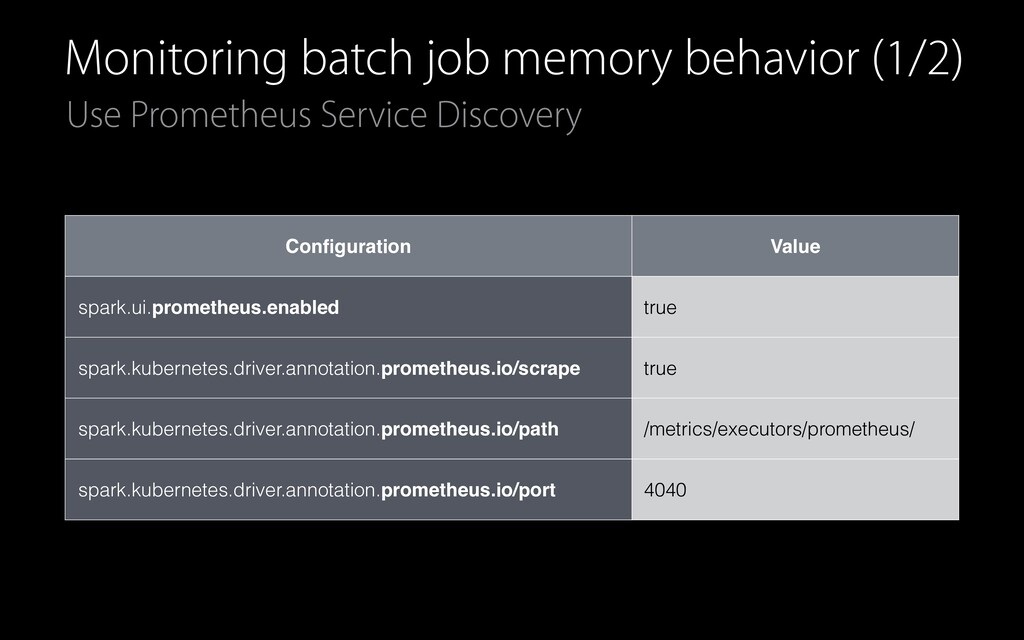
the existing Metrics pipeline • Use new endpoints and disable it by default • Avoid introducing new dependency Reuse the existing resources • Use official documented ports of Master/Worker/Driver • Take advantage of Prometheus Service Discovery in K8s as much as possible
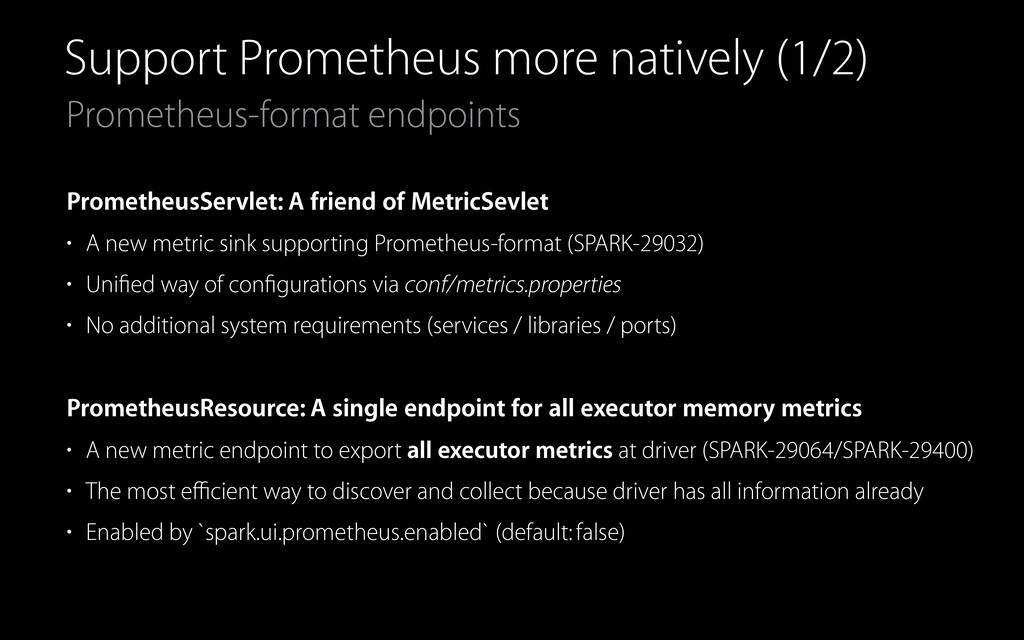
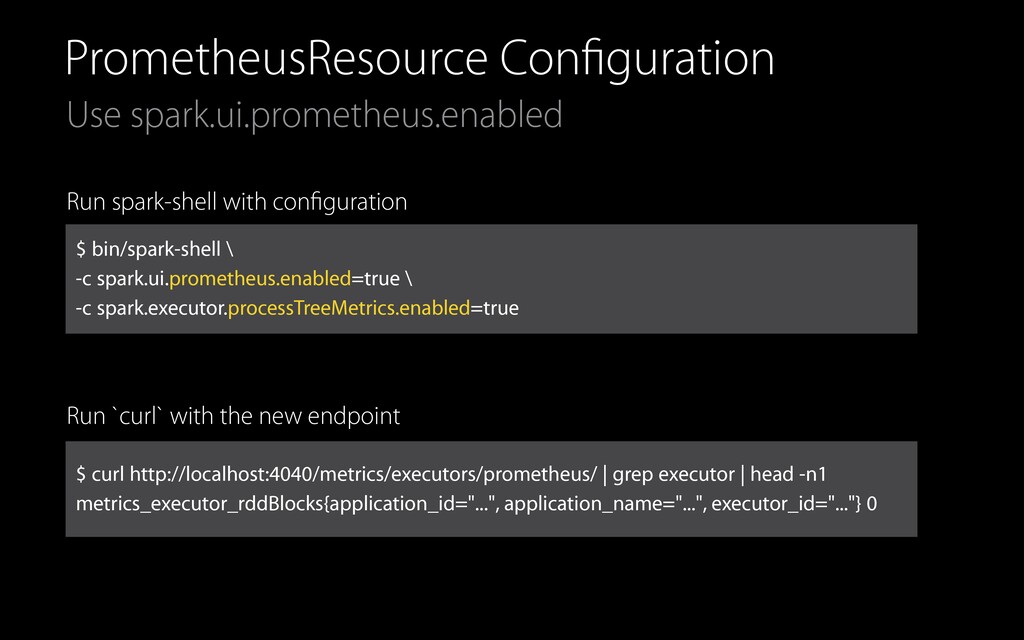
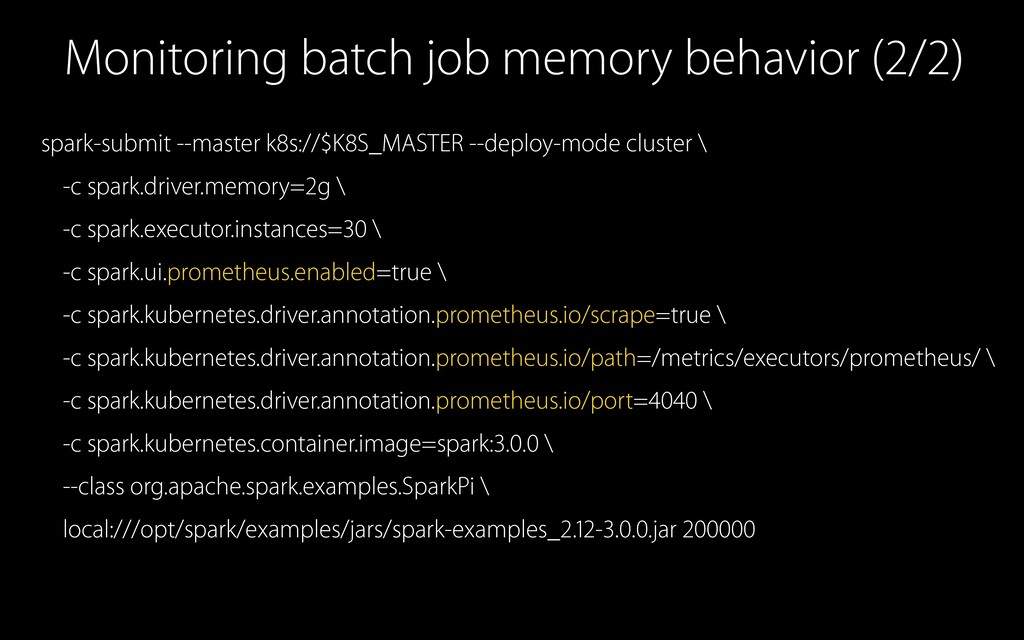
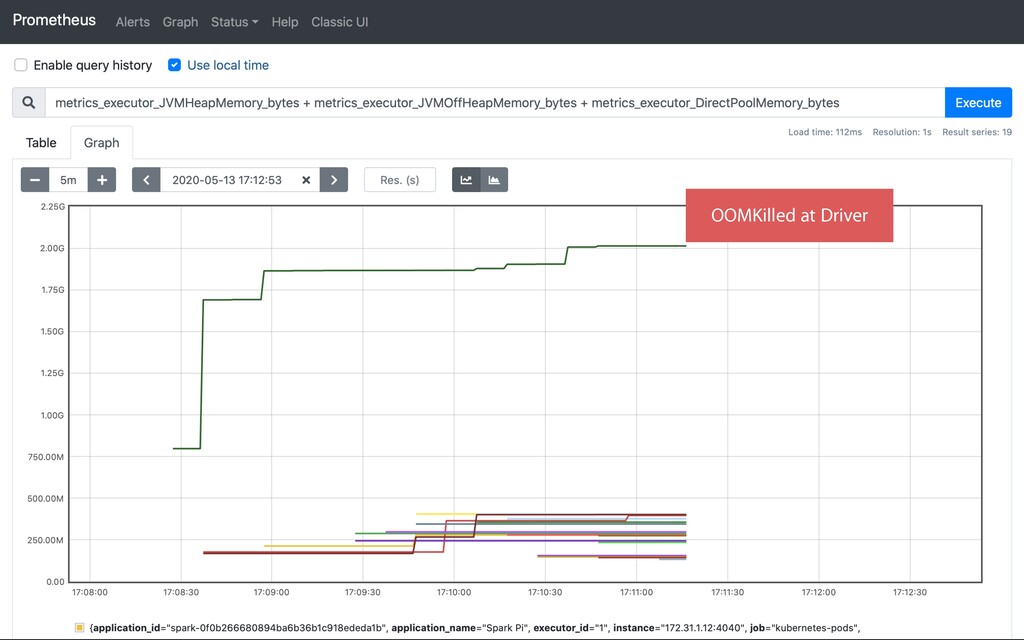
of MetricSevlet • A new metric sink supporting Prometheus-format (SPARK-29032) • Unified way of configurations via conf/metrics.properties • No additional system requirements (services / libraries / ports) PrometheusResource: A single endpoint for all executor memory metrics • A new metric endpoint to export all executor metrics at driver (SPARK-29064/SPARK-29400) • The most efficient way to discover and collect because driver has all information already • Enabled by `spark.ui.prometheus.enabled` (default: false)
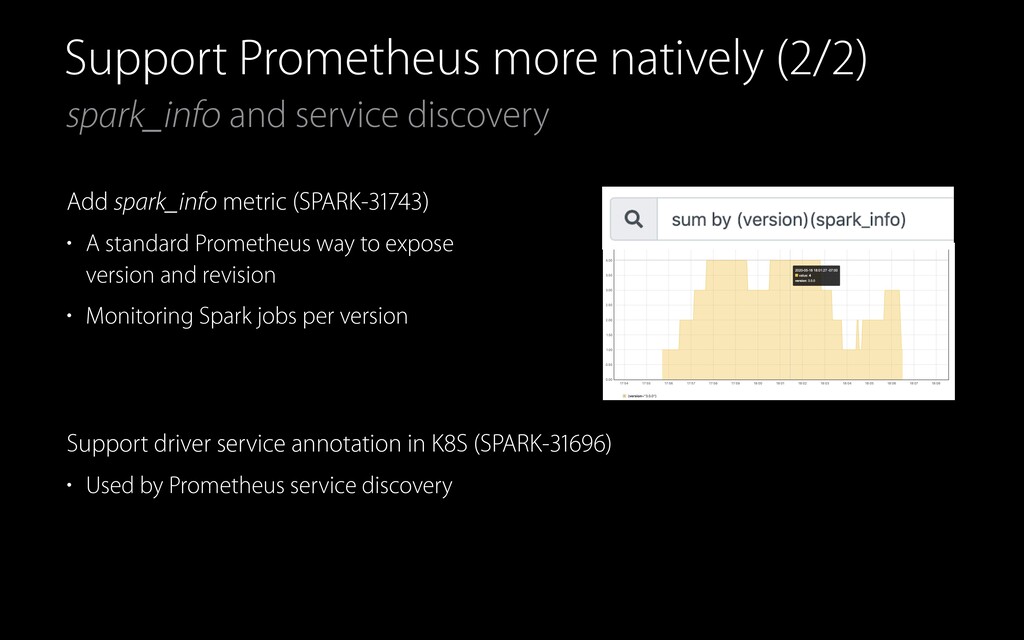
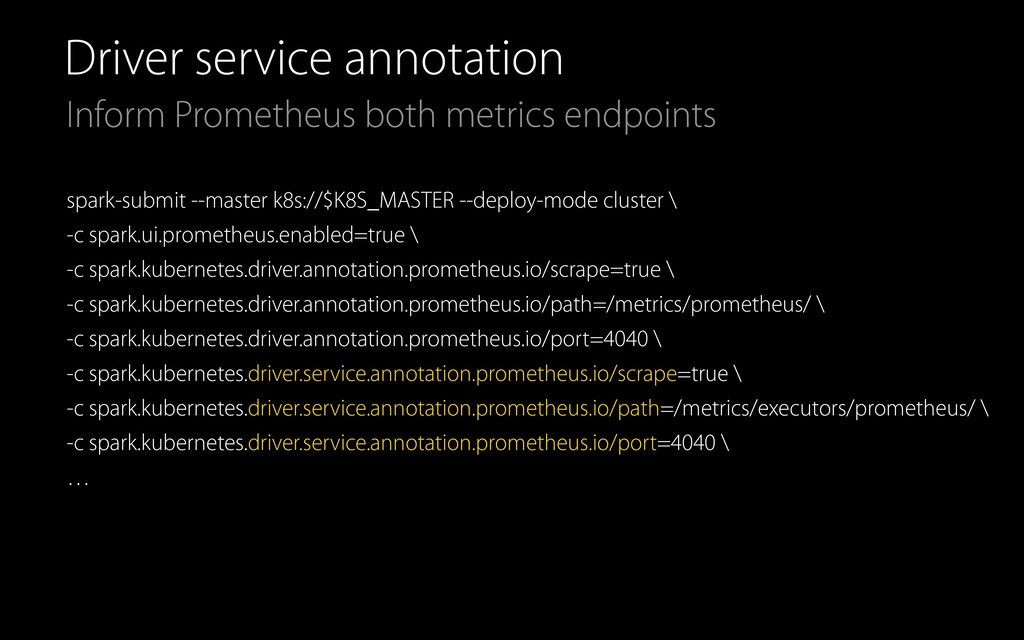
spark_info metric (SPARK-31743) • A standard Prometheus way to expose version and revision • Monitoring Spark jobs per version Support driver service annotation in K8S (SPARK-31696) • Used by Prometheus service discovery
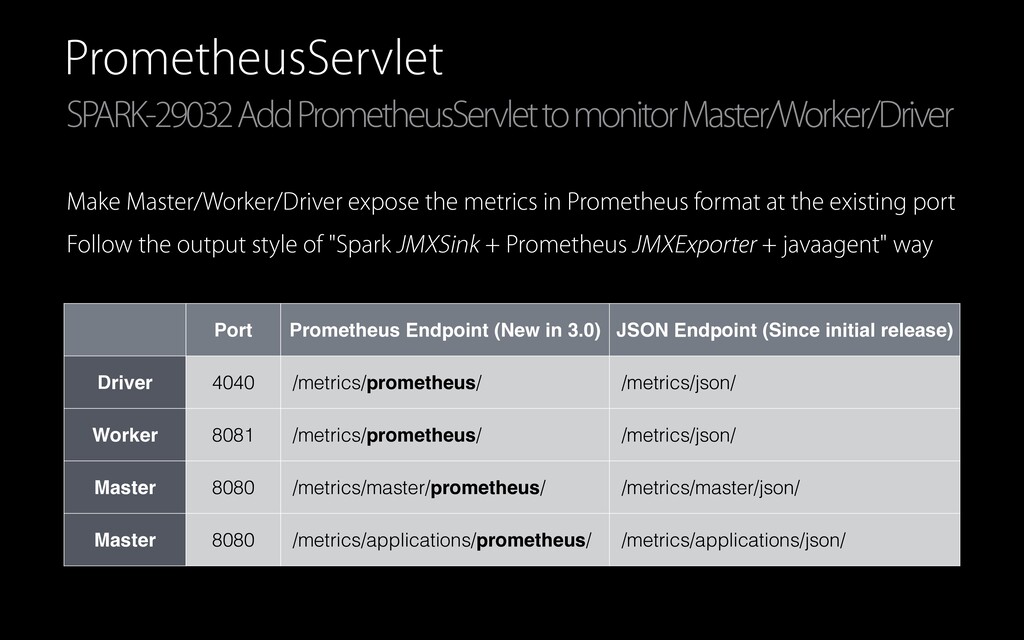
the metrics in Prometheus format at the existing port Follow the output style of "Spark JMXSink + Prometheus JMXExporter + javaagent" way Port Prometheus Endpoint (New in 3.0) JSON Endpoint (Since initial release) Driver 4040 /metrics/prometheus/ /metrics/json/ Worker 8081 /metrics/prometheus/ /metrics/json/ Master 8080 /metrics/master/prometheus/ /metrics/master/json/ Master 8080 /metrics/applications/prometheus/ /metrics/applications/json/
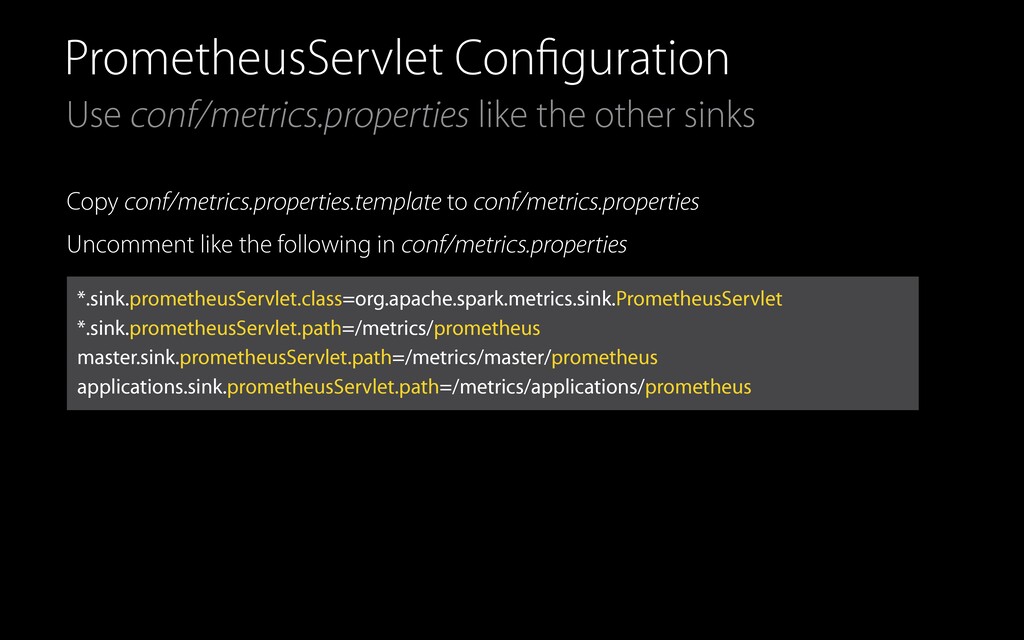
to conf/metrics.properties Uncomment like the following in conf/metrics.properties *.sink.prometheusServlet.class=org.apache.spark.metrics.sink.PrometheusServlet *.sink.prometheusServlet.path=/metrics/prometheus master.sink.prometheusServlet.path=/metrics/master/prometheus applications.sink.prometheusServlet.path=/metrics/applications/prometheus
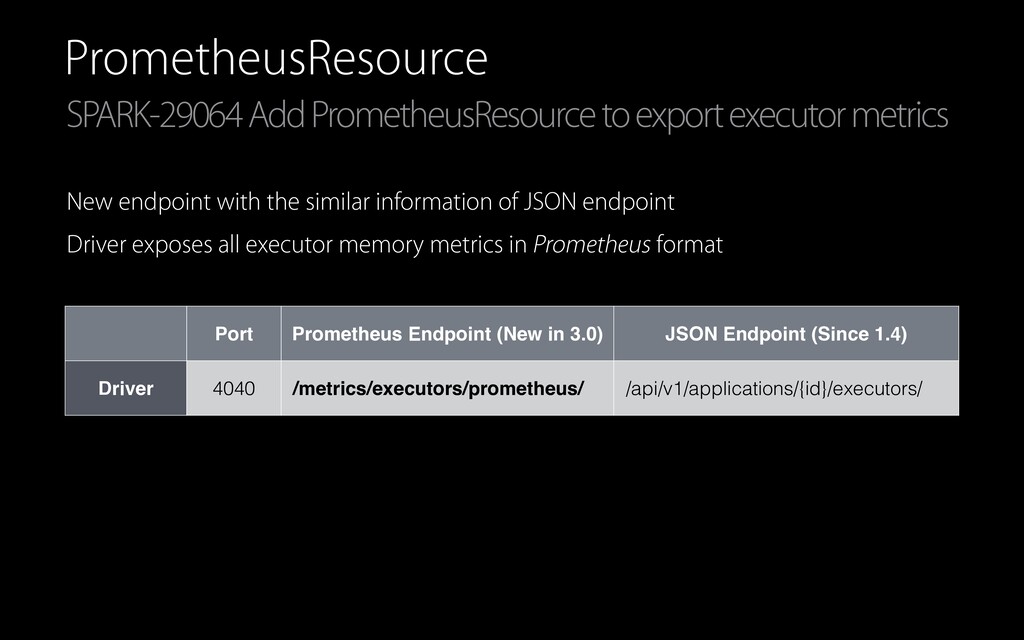
with the similar information of JSON endpoint Driver exposes all executor memory metrics in Prometheus format Port Prometheus Endpoint (New in 3.0) JSON Endpoint (Since 1.4) Driver 4040 /metrics/executors/prometheus/ /api/v1/applications/{id}/executors/
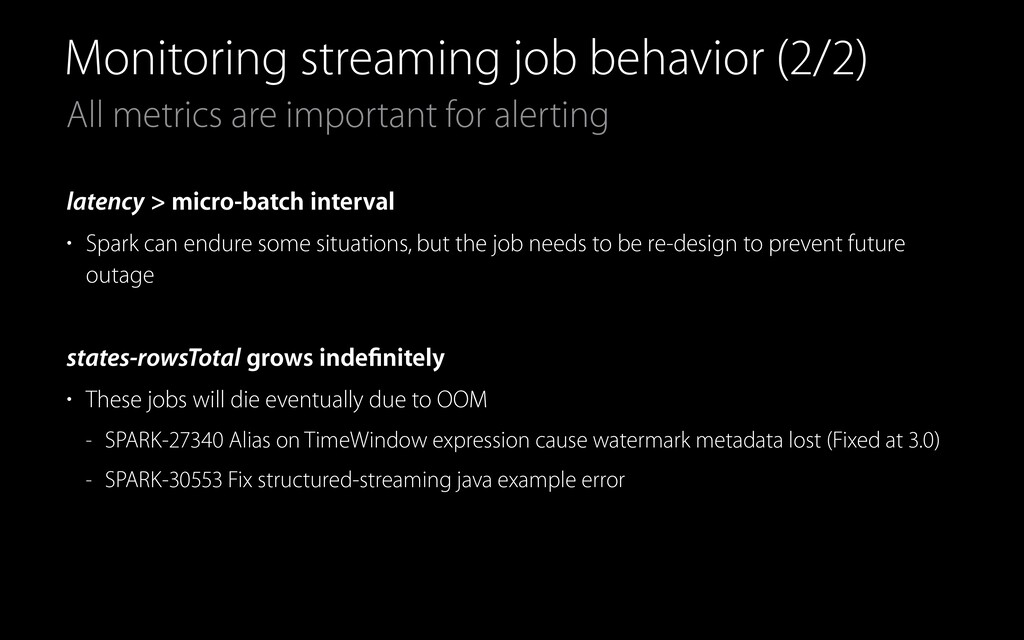
(2/2) latency > micro-batch interval • Spark can endure some situations, but the job needs to be re-design to prevent future outage states-rowsTotal grows indefinitely • These jobs will die eventually due to OOM - SPARK-27340 Alias on TimeWindow expression cause watermark metadata lost (Fixed at 3.0) - SPARK-30553 Fix structured-streaming java example error
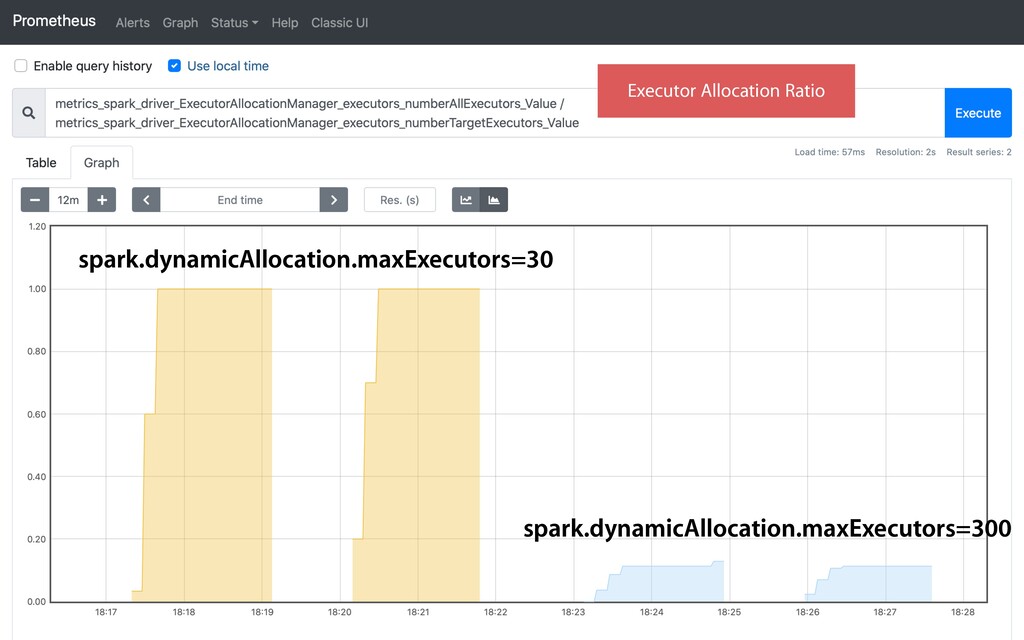
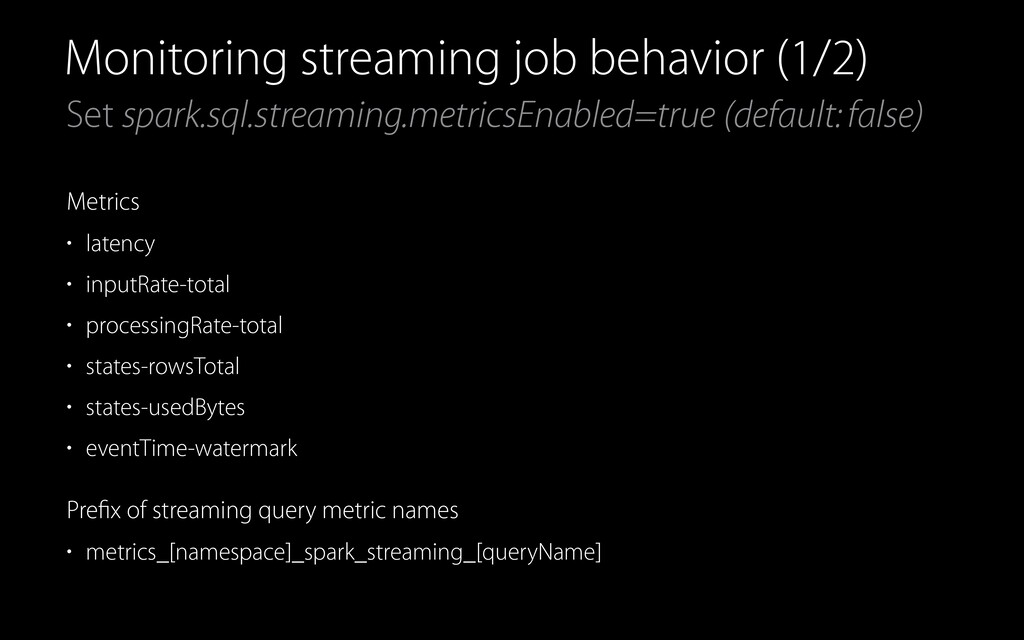
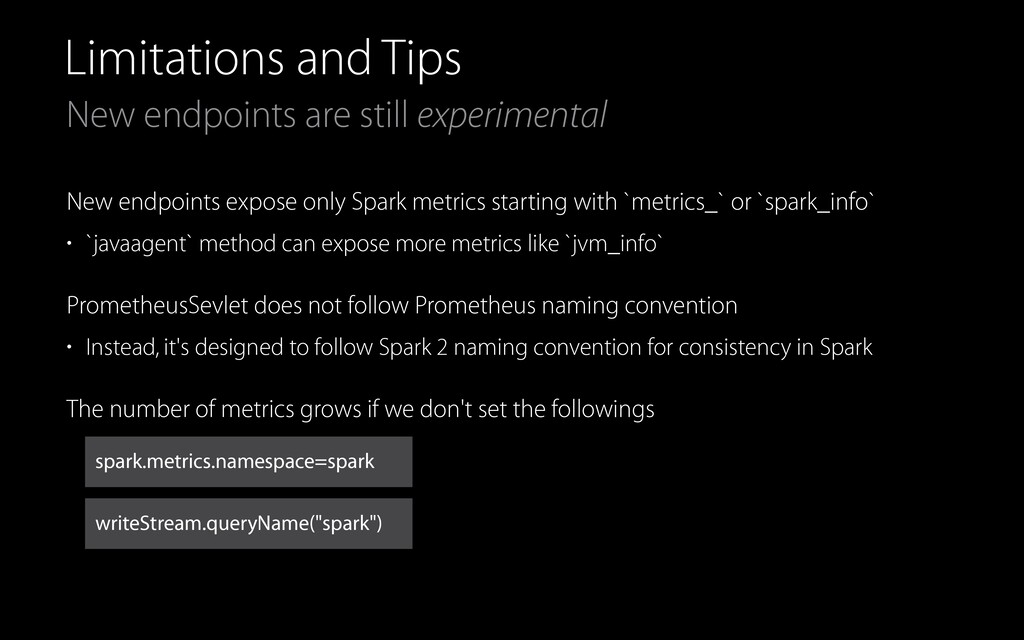
expose only Spark metrics starting with `metrics_` or `spark_info` • `javaagent` method can expose more metrics like `jvm_info` PrometheusSevlet does not follow Prometheus naming convention • Instead, it's designed to follow Spark 2 naming convention for consistency in Spark The number of metrics grows if we don't set the followings writeStream.queryName("spark") spark.metrics.namespace=spark
• Especially, in K8s environment, the metric collections become much easier than Spark 2 New Prometheus style endpoints are independent and additional options • Users can migrate into new endpoints or use them with the existing methods in a mixed way
![Select a single Spark app rate(metrics_executor_totalTasks_total{...}[1m])](https://files.speakerdeck.com/presentations/45137e33e5384b7fbc24866f8c900015/slide_28.jpg)