Upgrade to Pro — share decks privately, control downloads, hide ads and more …

Profiling tips and tools for your LAMP stack

dracony
December 02, 2014

Profiling tips and tools for your LAMP stack

Some hints for profiling your Linux, Apache (Nginx), PHP and MySQL stack.

dracony

December 02, 2014
Tweet

More Decks by dracony

Other Decks in Programming

Transcript

  1. The usual start • Turn on slow query log: slow_query_log

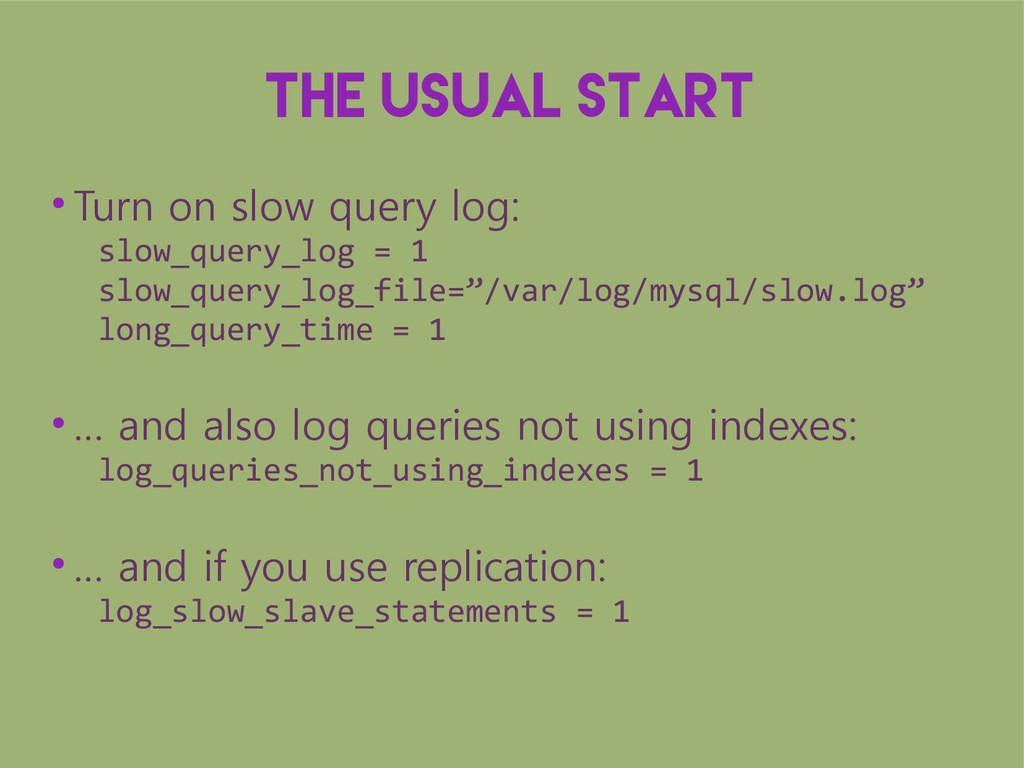
    = 1 slow_query_log_file=”/var/log/mysql/slow.log” long_query_time = 1 • … and also log queries not using indexes: log_queries_not_using_indexes = 1 • … and if you use replication: log_slow_slave_statements = 1
  2. The slow log • Logging to a table is also

    possible: log_output = TABLE
  3. Narrowing down Obviously try EXPLAIN first: If the query had

    a usable index the result would be: But what if we have too many indexes?
  4. Persona toolkit • 32 tools for various things • pt-index-usage:

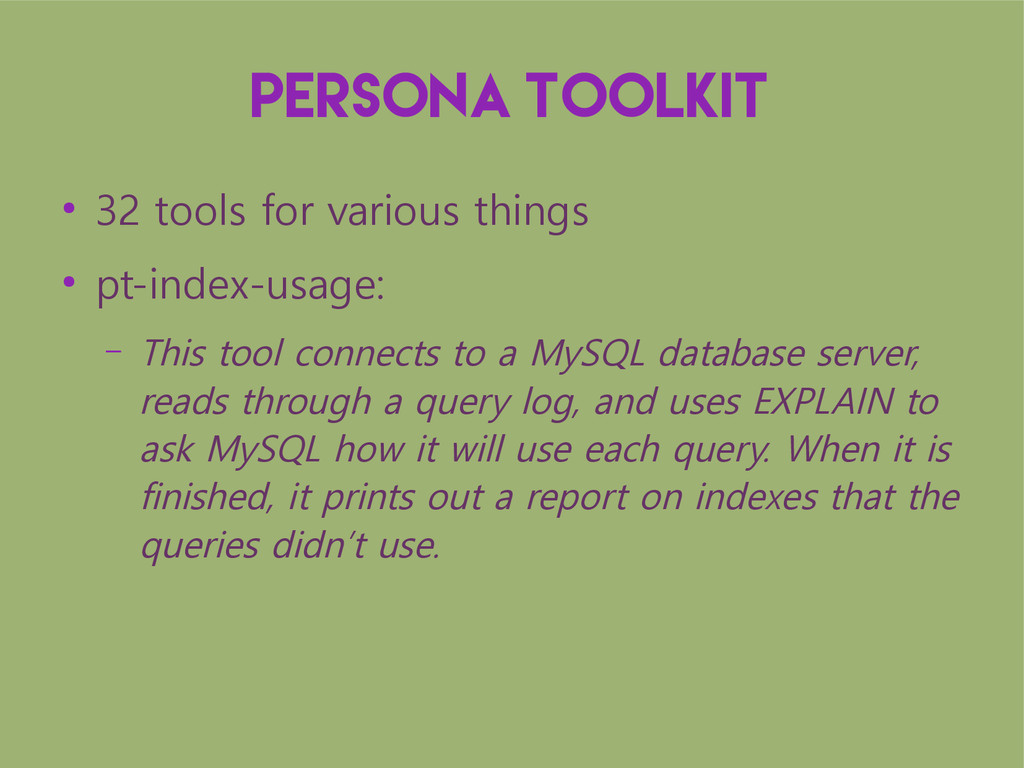
    – This tool connects to a MySQL database server, reads through a query log, and uses EXPLAIN to ask MySQL how it will use each query. When it is finished, it prints out a report on indexes that the queries didn’t use.
  5. Monitoring • Sadly, only a bunch of free tools =(

    • Profile SQL ( http://www.profilesql.com/features/ )
  6. PHP

  7. Use a ruler Adding a simple usleep() call when profiling

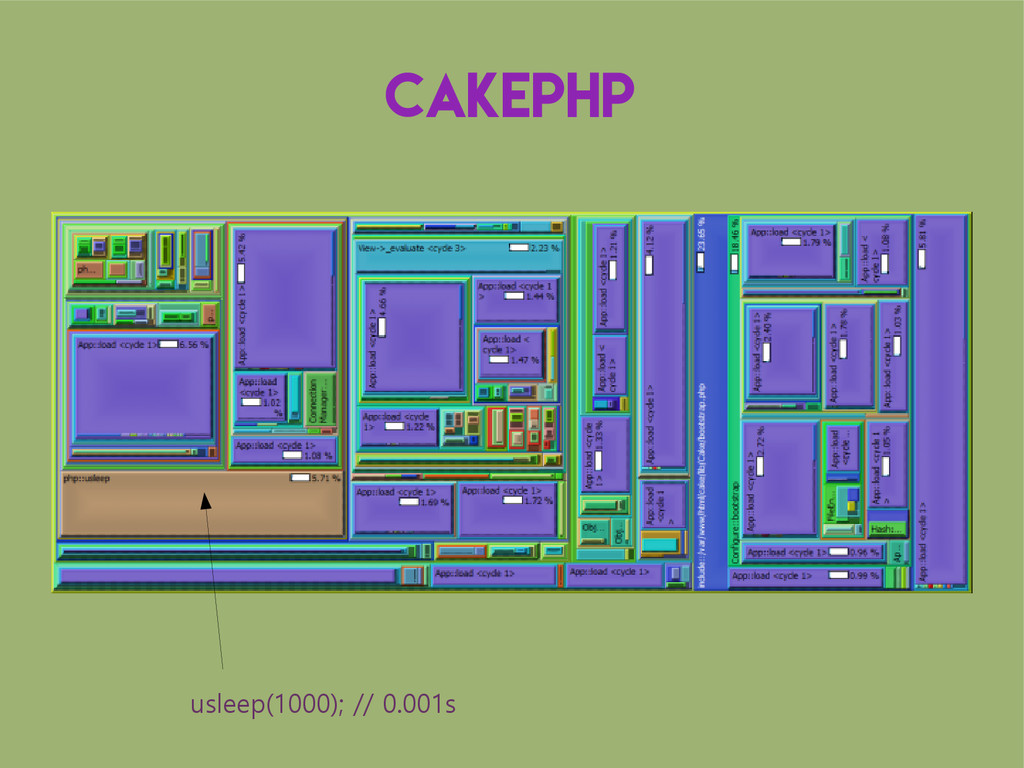
    will provide you with a reference point for easier visual comparison of generated graphs. The bigger the usleep() block appears the faster the application performs.
  8. Try XHProf • Doesn't slow down execution time as much

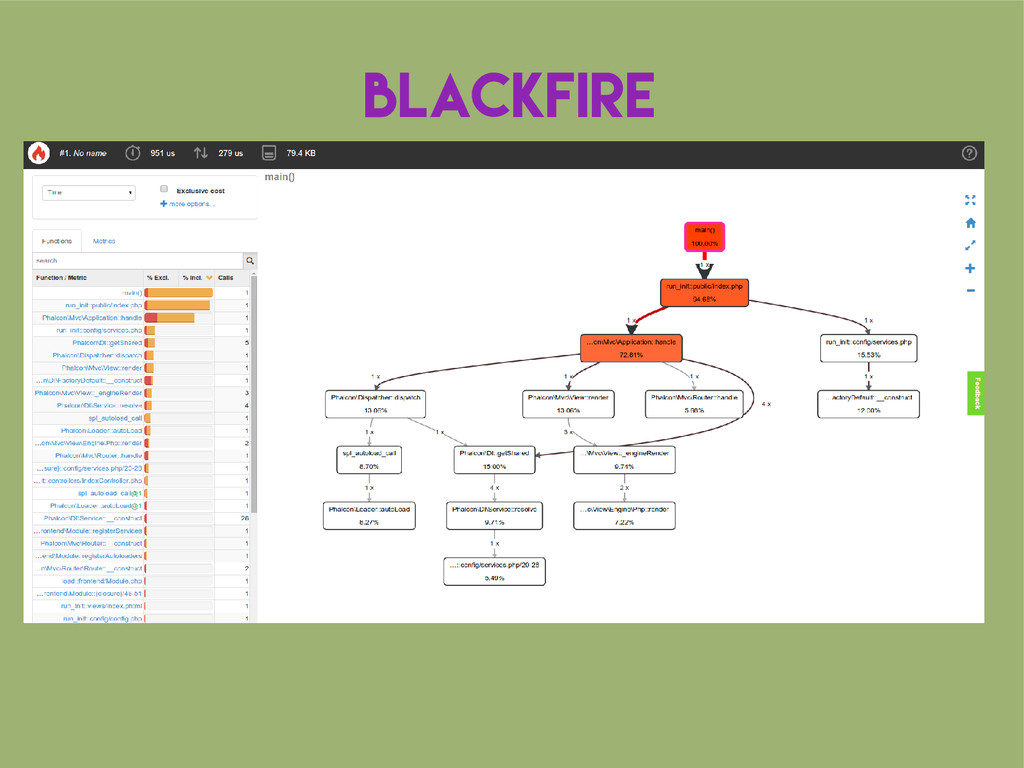
    as XDebug • Profiling log file ~10 times smaller • Memory profiling. With XDebug you have to generate a trace to get a memory profile. • Allows you to compare results from multiple runs • Sadly no KCacheGrind and the profiler output is not very pretty
  9. Blackfire • More or less same thing as XDebug and

    XHProf, but... • Works in your browser • Nicer UI • May be also usable on production
  10. Perf Record system resource usage overtime perf record -a -g

    sleep 10 # record system for 10s perf report # display report
  11. Munin • Spot problems before they become critical • Plugins

    to monitor virtuallly anything: – Drupal – Apache – PHP – Joomla – Reddit Karma ( seriously ) • Distributed. Generate logs for all your servers. • Demo: http://demo.munin-monitoring.org/