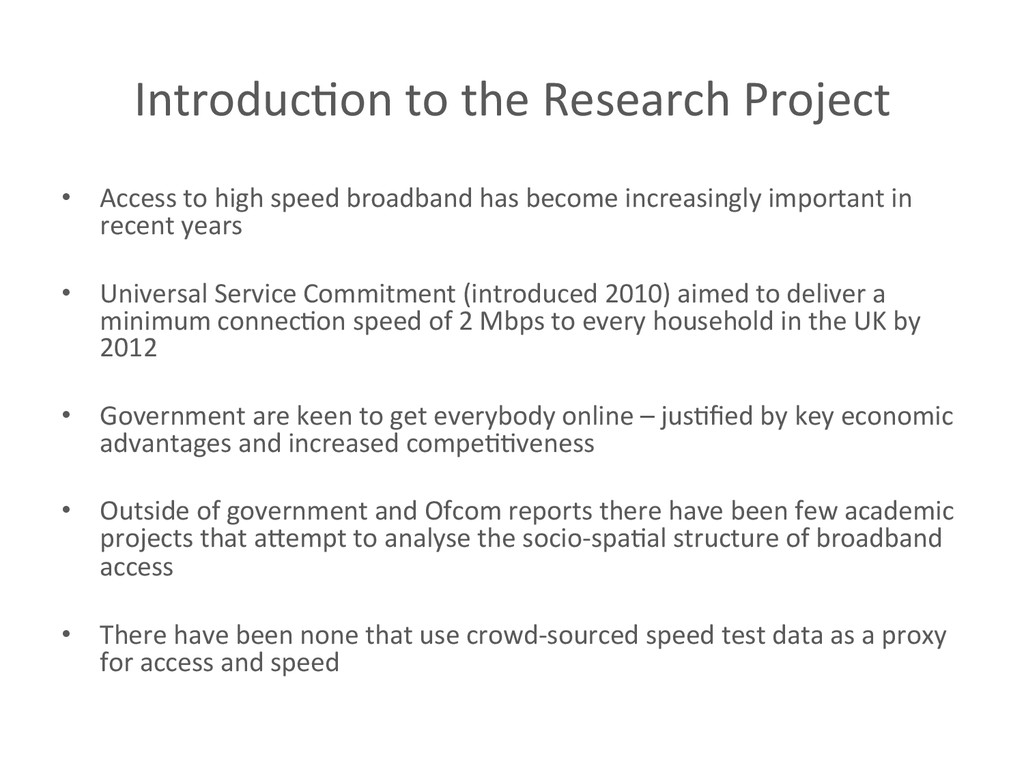
high speed broadband has become increasingly important in recent years • Universal Service Commitment (introduced 2010) aimed to deliver a minimum connec<on speed of 2 Mbps to every household in the UK by 2012 • Government are keen to get everybody online – jus<fied by key economic advantages and increased compe<<veness • Outside of government and Ofcom reports there have been few academic projects that aNempt to analyse the socio-‐spa<al structure of broadband access • There have been none that use crowd-‐sourced speed test data as a proxy for access and speed
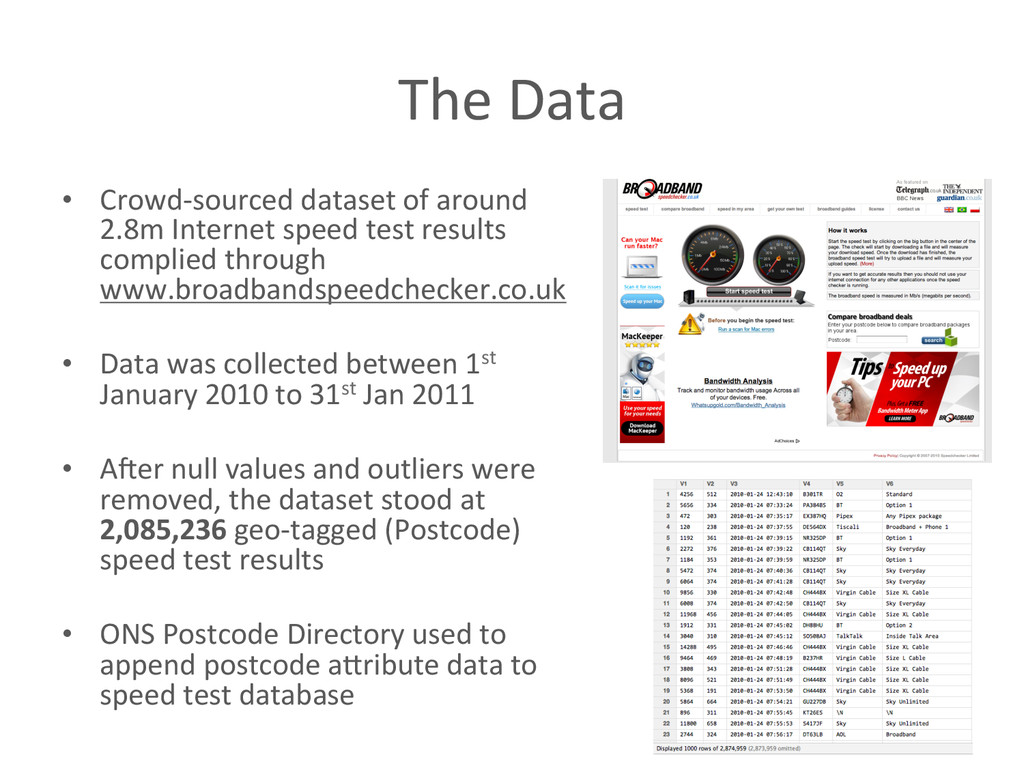
Internet speed test results complied through www.broadbandspeedchecker.co.uk • Data was collected between 1st January 2010 to 31st Jan 2011 • AVer null values and outliers were removed, the dataset stood at 2,085,236 geo-‐tagged (Postcode) speed test results • ONS Postcode Directory used to append postcode aNribute data to speed test database
used to calculate distances between speed test loca<ons and the nearest telephone exchange (Performed in R using Euclidian distance measurement) • Observa<ons for Wales, Scotland and Northern Ireland removed • Observa<ons where download speed was below 512Kbps (0.5Mbps) or over 100,000Kbps (97.7Mbps) were removed • Observa<ons with exchange distances over 9KM were removed • END RESULT – A comprehensive dataset of over 2m speed test results geo-‐tagged by postcode • Each has corresponding aNribute informa<on for that postcode, as well as the distance to the closest exchange Valida<on
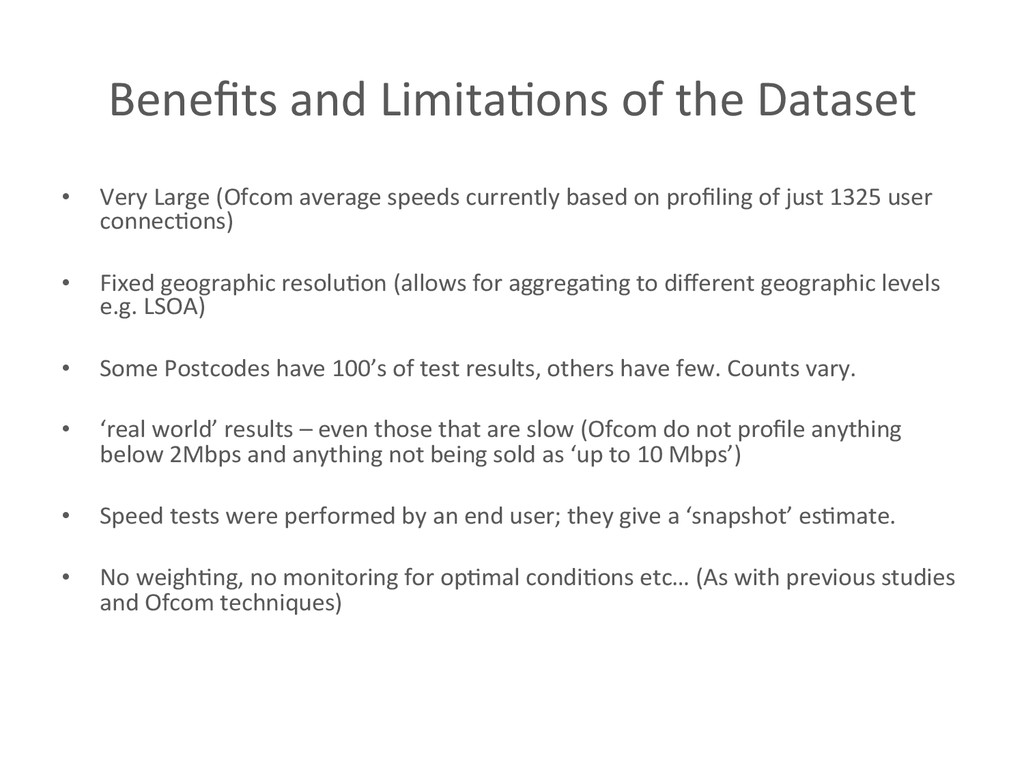
(Ofcom average speeds currently based on profiling of just 1325 user connec<ons) • Fixed geographic resolu<on (allows for aggrega<ng to different geographic levels e.g. LSOA) • Some Postcodes have 100’s of test results, others have few. Counts vary. • ‘real world’ results – even those that are slow (Ofcom do not profile anything below 2Mbps and anything not being sold as ‘up to 10 Mbps’) • Speed tests were performed by an end user; they give a ‘snapshot’ es<mate. • No weigh<ng, no monitoring for op<mal condi<ons etc… (As with previous studies and Ofcom techniques)
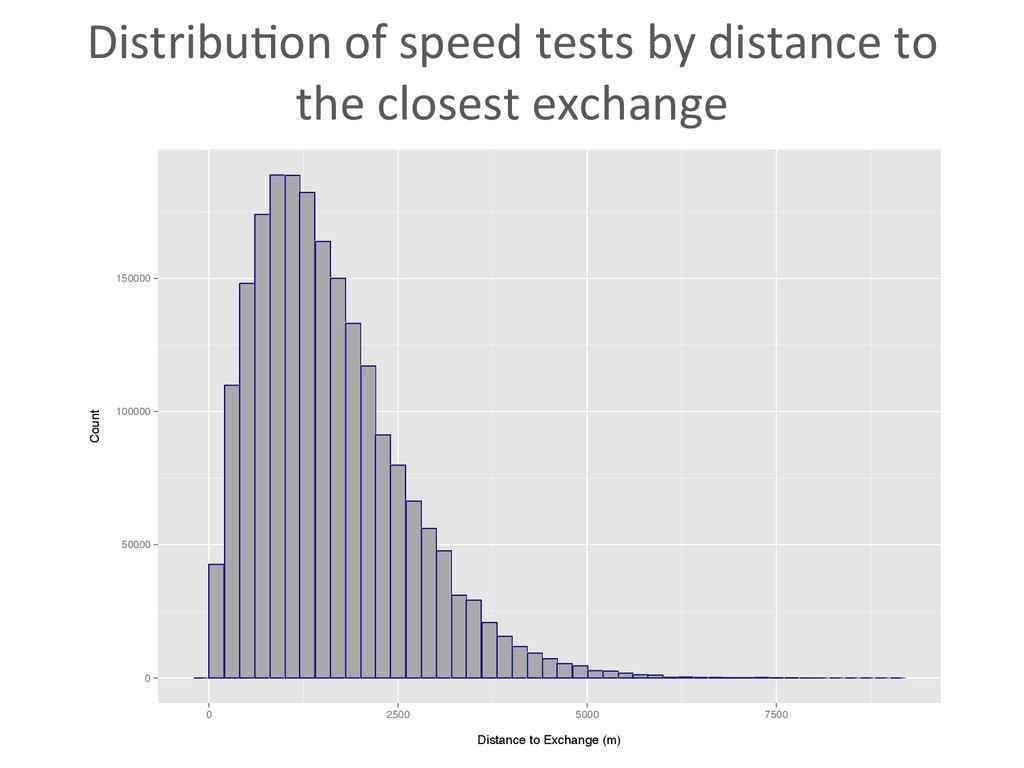
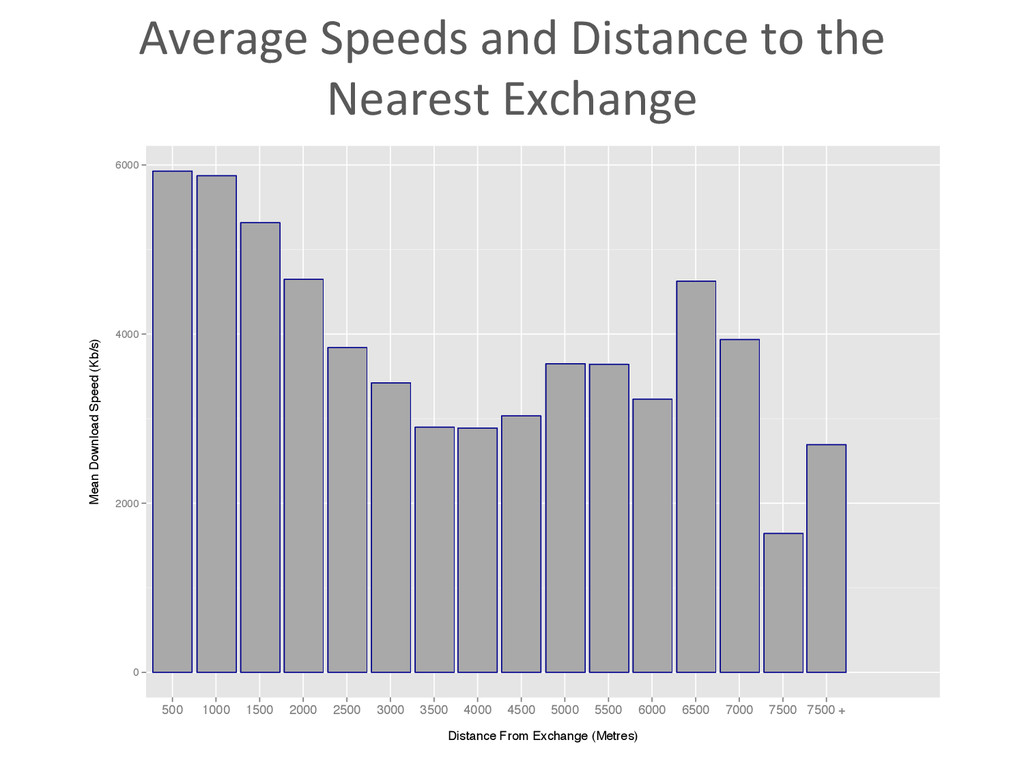
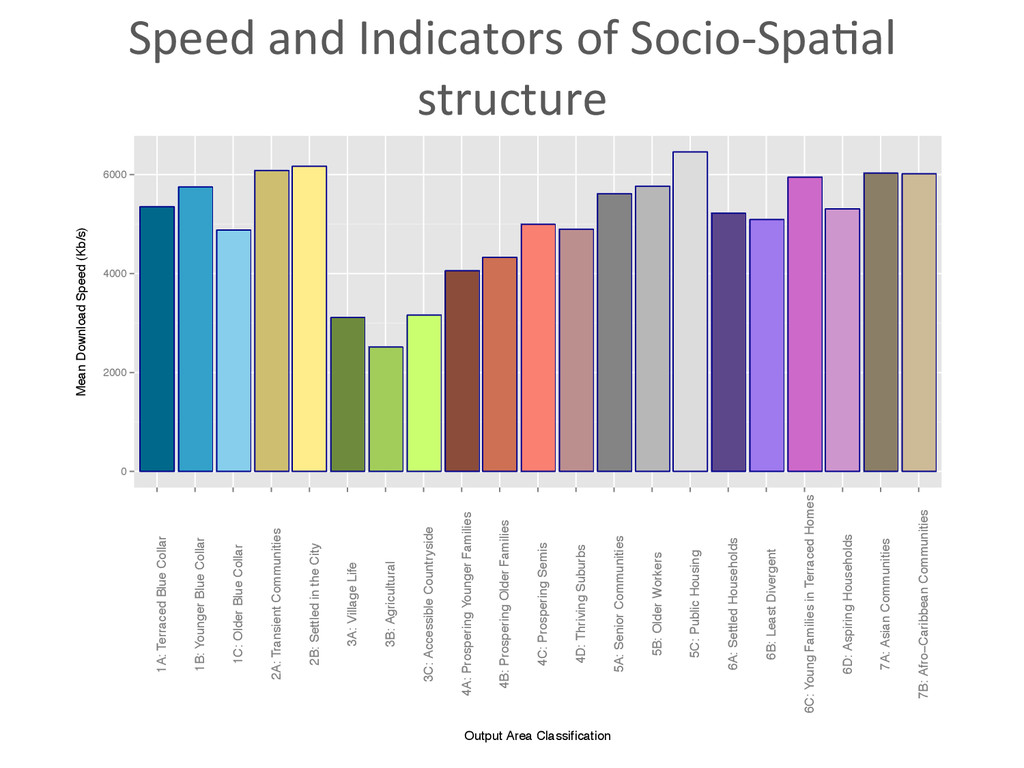
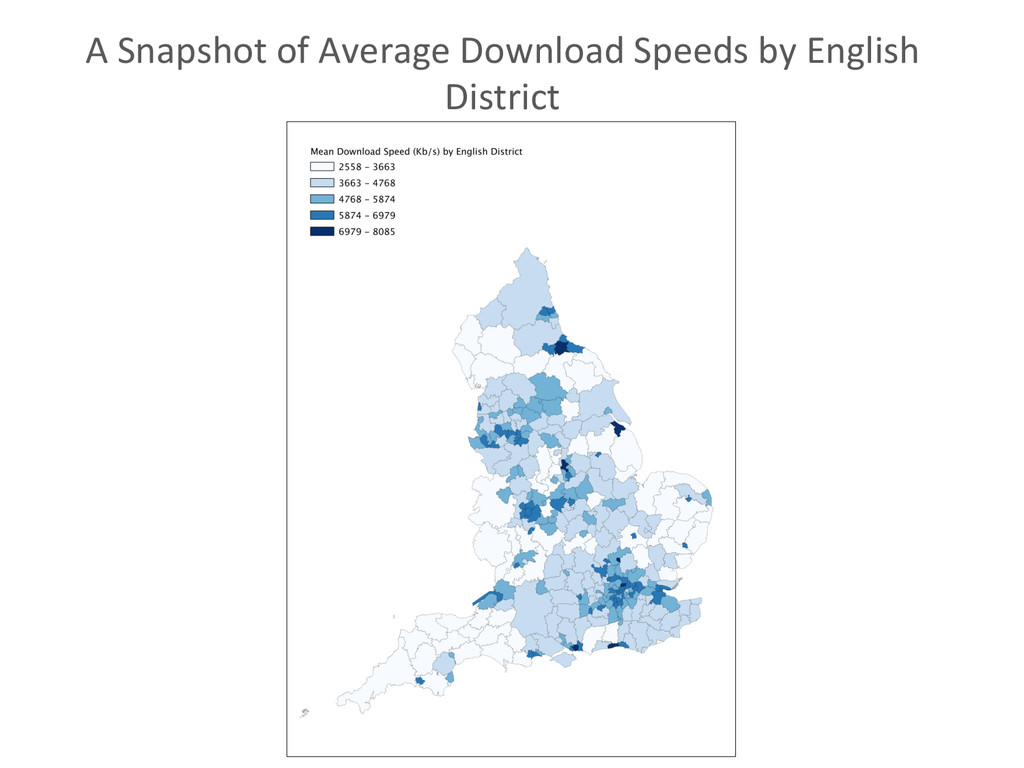
• Distribu<on of speed tests by distance to the closest exchange • Average Speeds and Distance to the Nearest Exchange • Speed and Indicators of Socio-‐Spa<al structure • Speed and Indicators of Rurality • Speed and Indicators of Depriva<on • A Snapshot of Average Download Speeds by English District
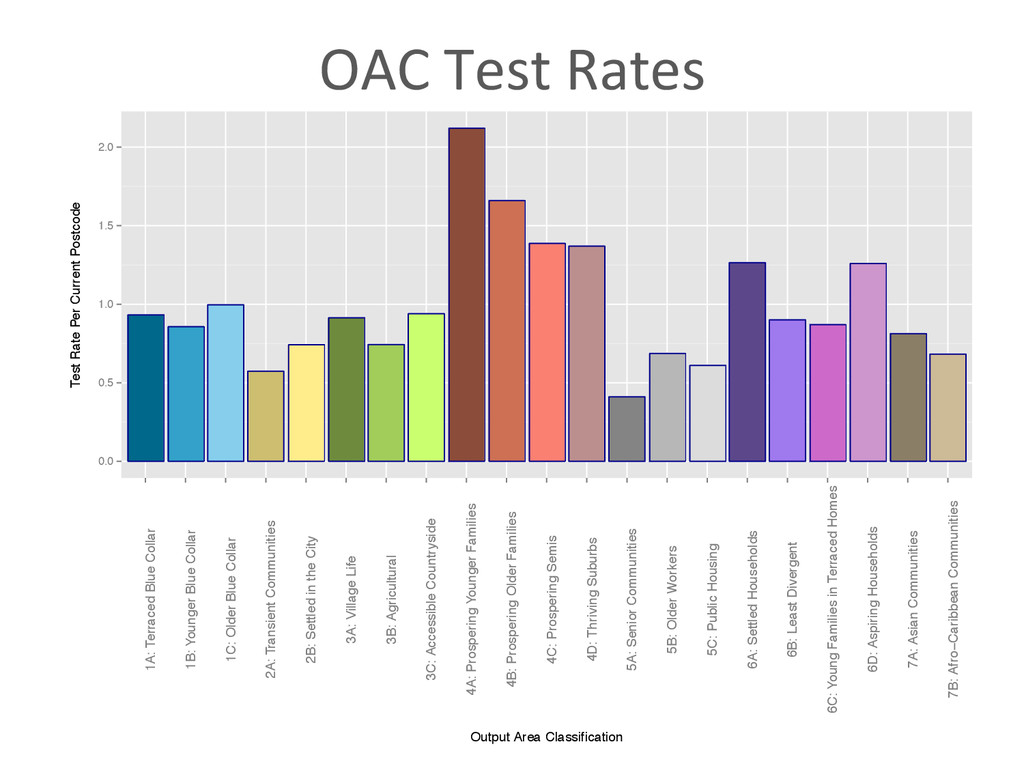
Terraced Blue Collar 1B: Younger Blue Collar 1C: Older Blue Collar 2A: Transient Communities 2B: Settled in the City 3A: Village Life 3B: Agricultural 3C: Accessible Countryside 4A: Prospering Younger Families 4B: Prospering Older Families 4C: Prospering Semis 4D: Thriving Suburbs 5A: Senior Communities 5B: Older Workers 5C: Public Housing 6A: Settled Households 6B: Least Divergent 6C: Young Families in Terraced Homes 6D: Aspiring Households 7A: Asian Communities 7B: Afro−Caribbean Communities Output Area Classification Test Rate Per Current Postcode
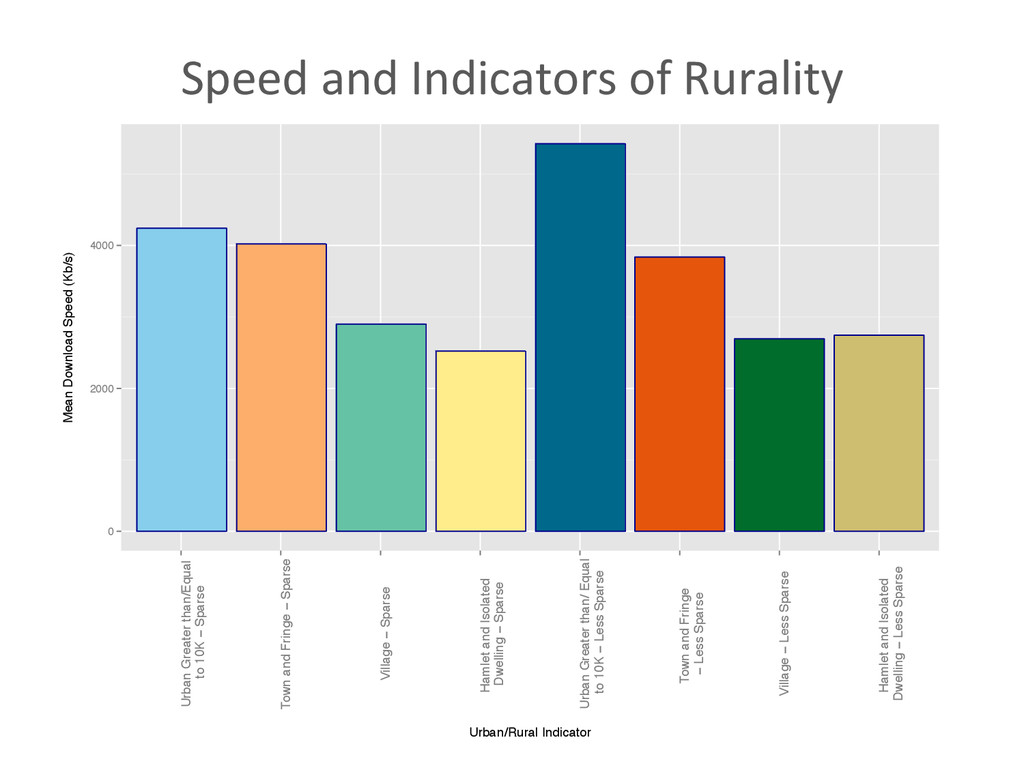
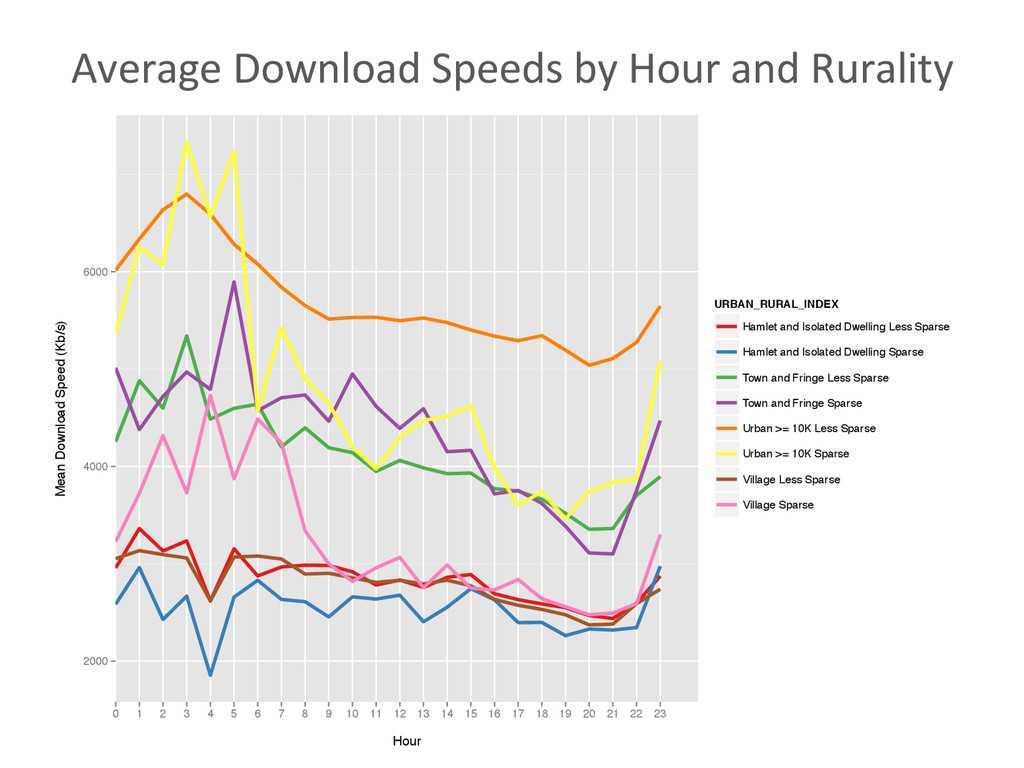
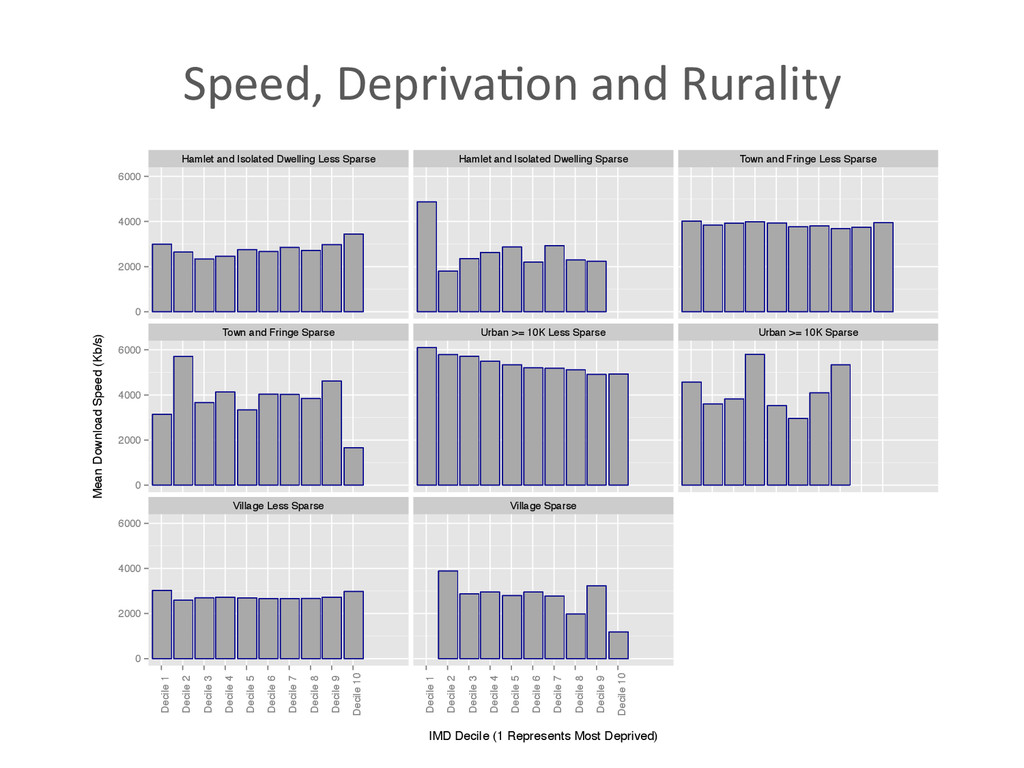
Greater than/Equal to 10K − Sparse Town and Fringe − Sparse Village − Sparse Hamlet and Isolated Dwelling − Sparse Urban Greater than/ Equal to 10K − Less Sparse Town and Fringe − Less Sparse Village − Less Sparse Hamlet and Isolated Dwelling − Less Sparse Urban/Rural Indicator Mean Download Speed (Kb/s)
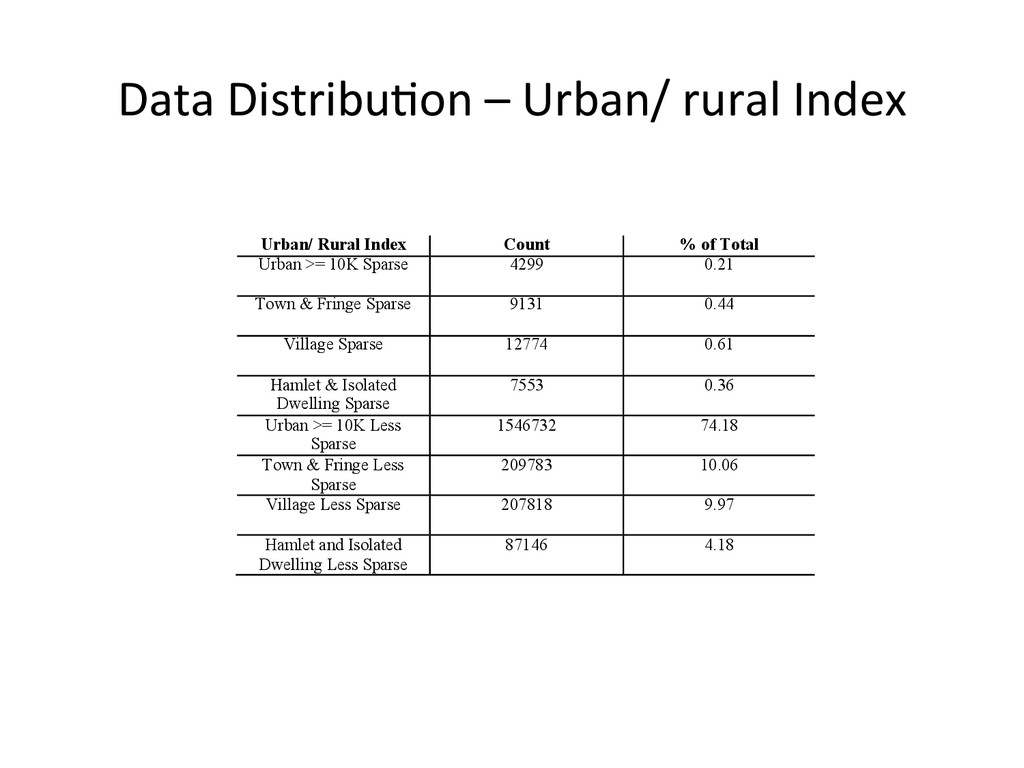
Count % of Total Urban >= 10K Sparse 4299 0.21 Town & Fringe Sparse 9131 0.44 Village Sparse 12774 0.61 Hamlet & Isolated Dwelling Sparse 7553 0.36 Urban >= 10K Less Sparse 1546732 74.18 Town & Fringe Less Sparse 209783 10.06 Village Less Sparse 207818 9.97 Hamlet and Isolated Dwelling Less Sparse 87146 4.18 !
4000 6000 22 23 17 18 5 15 14 7 12 16 19 13 11 20 9 21 0 10 8 1 6 4 3 2 Hour Mean Download Speed (Kb/s) URBAN_RURAL_INDEX Hamlet and Isolated Dwelling Less Sparse Hamlet and Isolated Dwelling Sparse Town and Fringe Less Sparse Town and Fringe Sparse Urban >= 10K Less Sparse Urban >= 10K Sparse Village Less Sparse Village Sparse
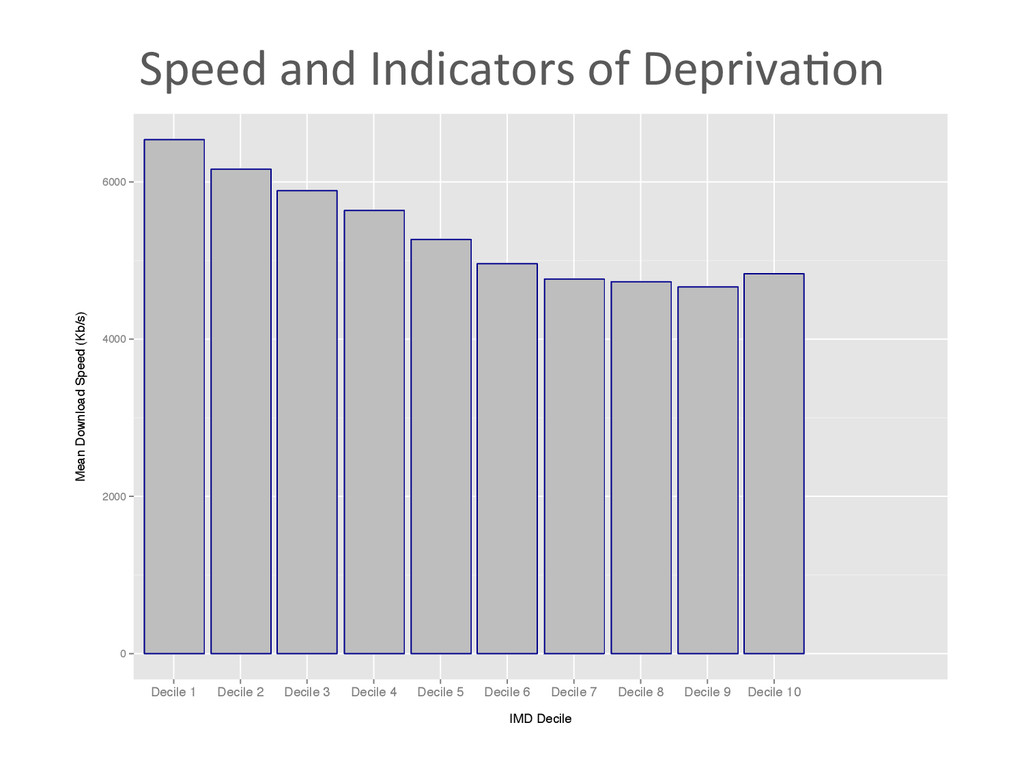
geography of access is in real terms, near universal • Profiling the data by indicators of rurality confirms that some less densely populated and isolated areas may not be benefiing from adequate performance • Access may be near universal but adequate speed is not. • Prevailing socio-‐economic condi<ons of small geographic areas do not have a direct impact on access to fixed line broadband services (IMD)
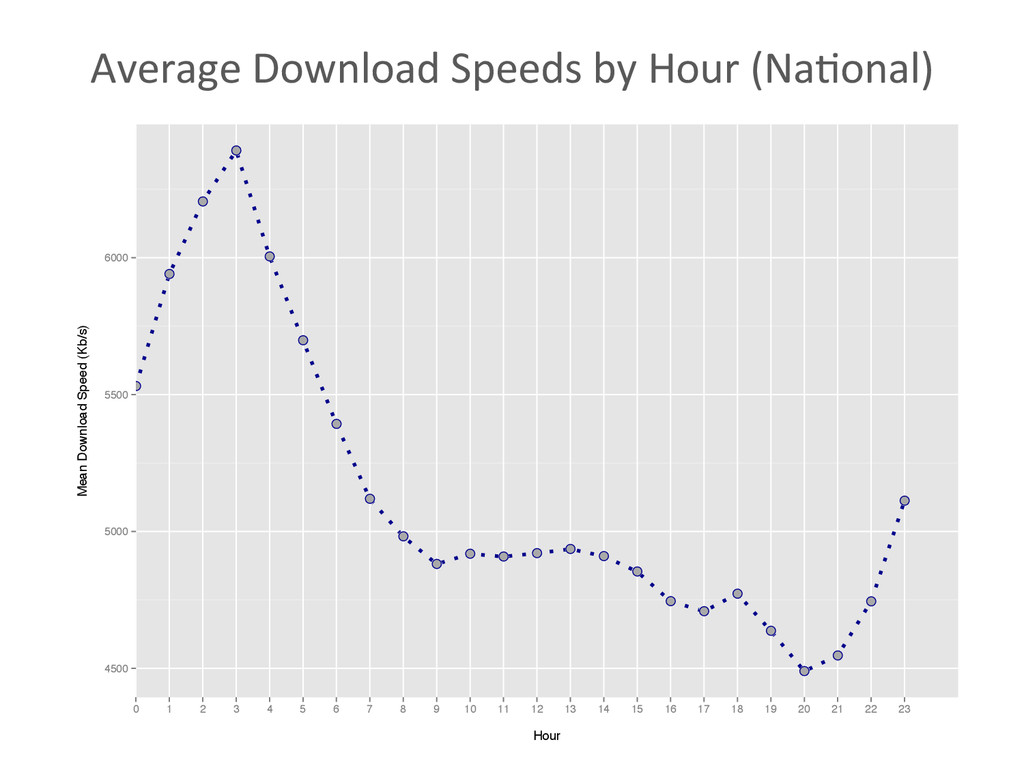
higher speeds (Many deprived areas are of high popula<on density – hence beNer infrastructure) • Poten<al for reaching out to these communi<es • There are rela<vely large fluctua<ons in speed throughout the day when profiled at a na<onal level. • ‘Peak Hours’ have a clear impact on download speeds regardless of where users live.