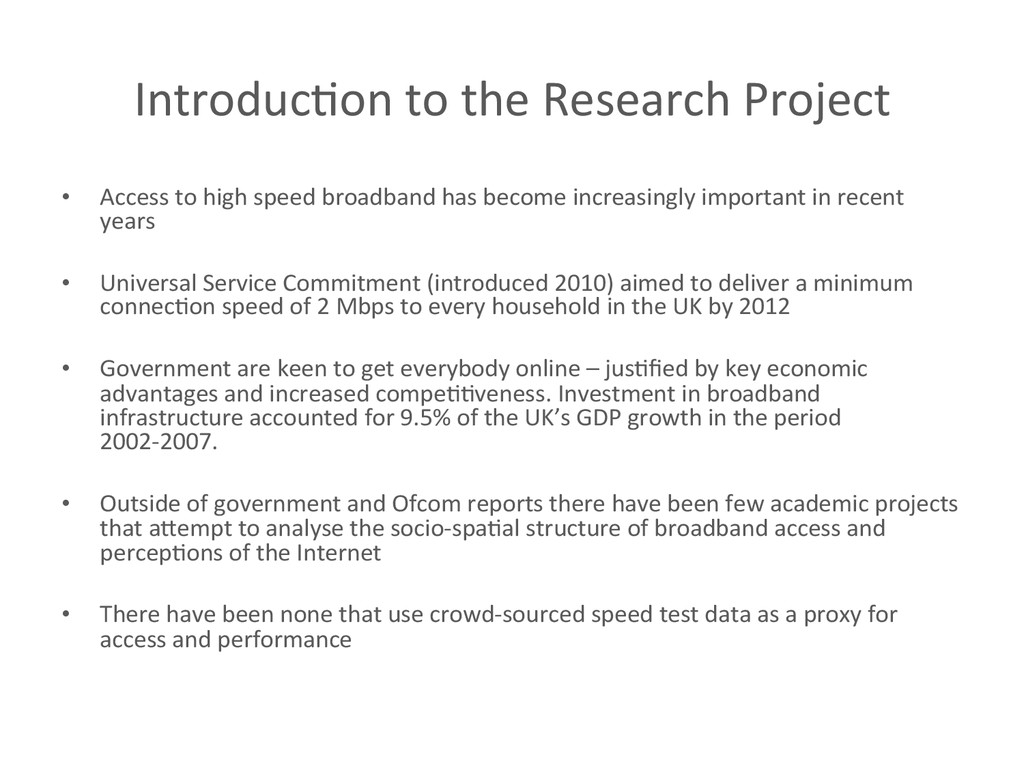
high speed broadband has become increasingly important in recent years • Universal Service Commitment (introduced 2010) aimed to deliver a minimum connec<on speed of 2 Mbps to every household in the UK by 2012 • Government are keen to get everybody online – jus<fied by key economic advantages and increased compe<<veness. Investment in broadband infrastructure accounted for 9.5% of the UK’s GDP growth in the period 2002-‐2007. • Outside of government and Ofcom reports there have been few academic projects that aUempt to analyse the socio-‐spa<al structure of broadband access and percep<ons of the Internet • There have been none that use crowd-‐sourced speed test data as a proxy for access and performance
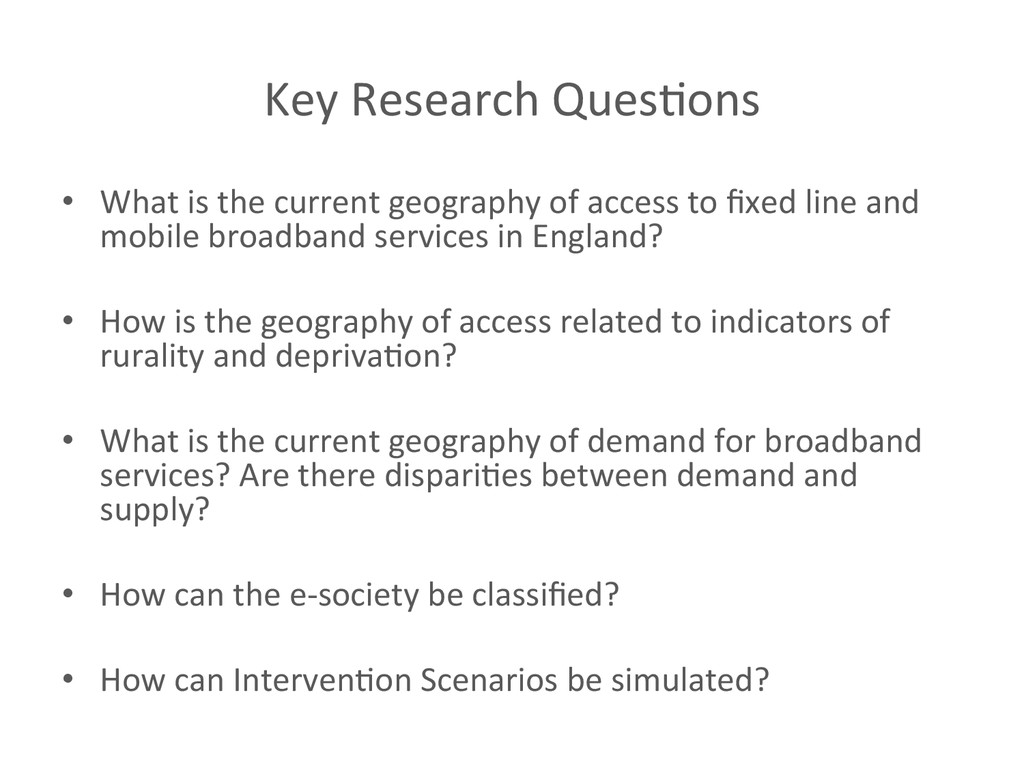
of access to fixed line and mobile broadband services in England? • How is the geography of access related to indicators of rurality and depriva<on? • What is the current geography of demand for broadband services? Are there dispari<es between demand and supply? • How can the e-‐society be classified? • How can Interven<on Scenarios be simulated?
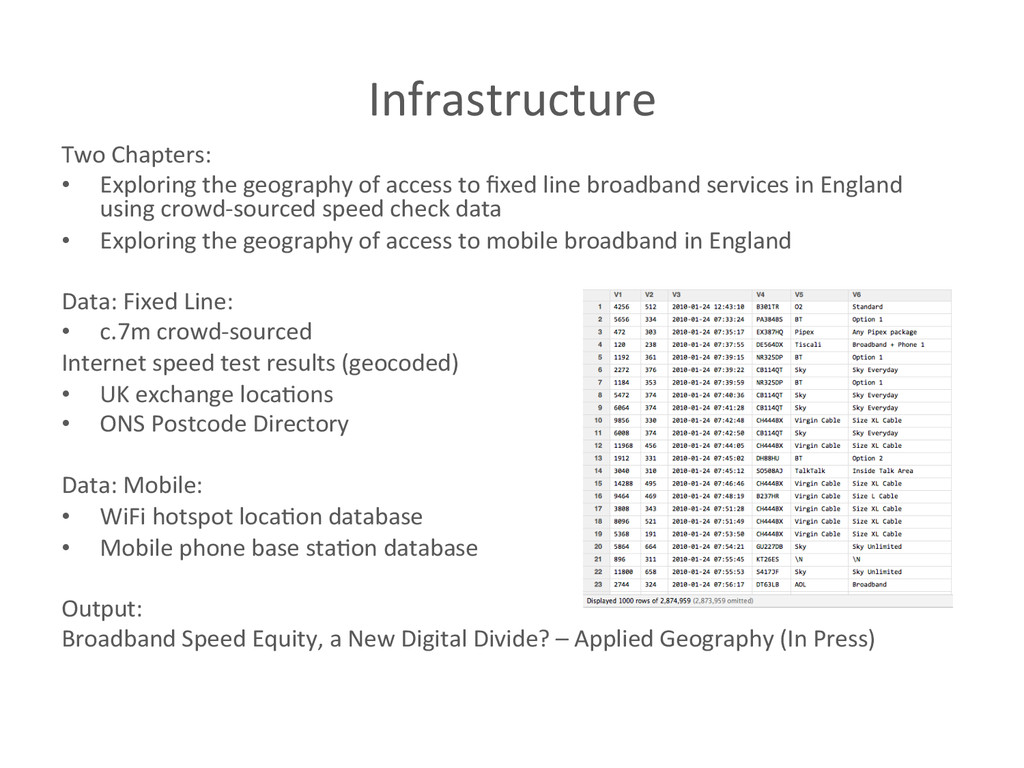
access to fixed line broadband services in England using crowd-‐sourced speed check data • Exploring the geography of access to mobile broadband in England Data: Fixed Line: • c.7m crowd-‐sourced Internet speed test results (geocoded) • UK exchange loca<ons • ONS Postcode Directory Data: Mobile: • WiFi hotspot loca<on database • Mobile phone base sta<on database Output: Broadband Speed Equity, a New Digital Divide? – Applied Geography (In Press)
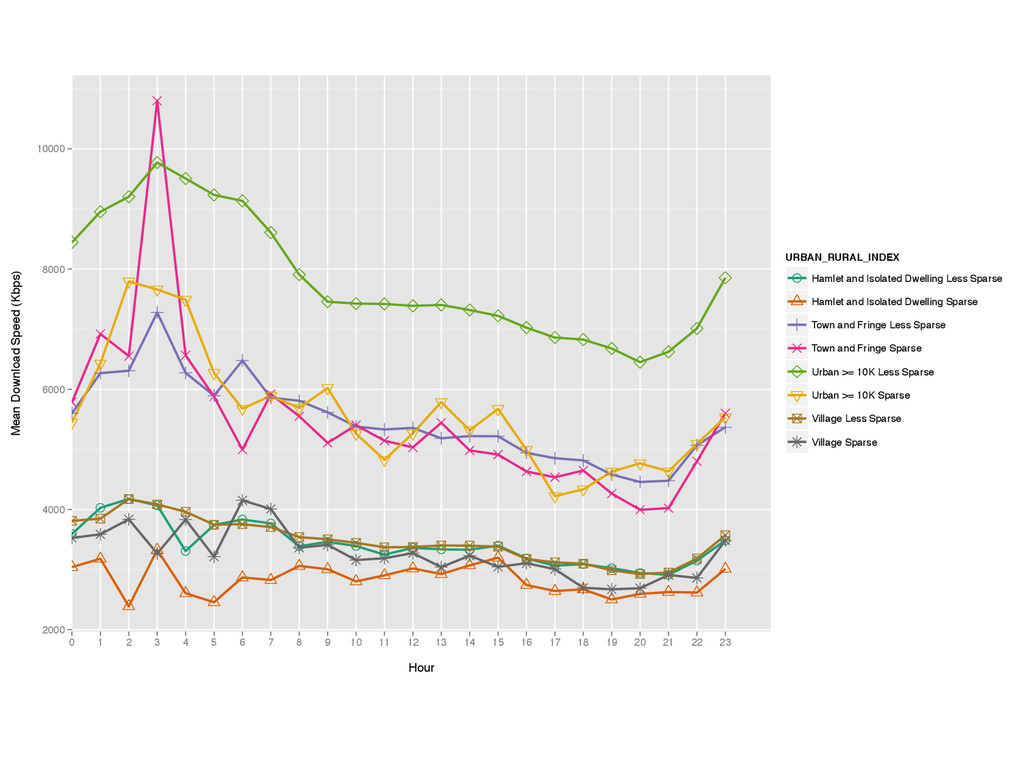
9 22 8 15 10 12 13 6 0 20 18 23 7 2 19 14 4 3 5 Hour Mean Download Speed (Kbps) URBAN_RURAL_INDEX Hamlet and Isolated Dwelling Less Sparse Hamlet and Isolated Dwelling Sparse Town and Fringe Less Sparse Town and Fringe Sparse Urban >= 10K Less Sparse Urban >= 10K Sparse Village Less Sparse Village Sparse
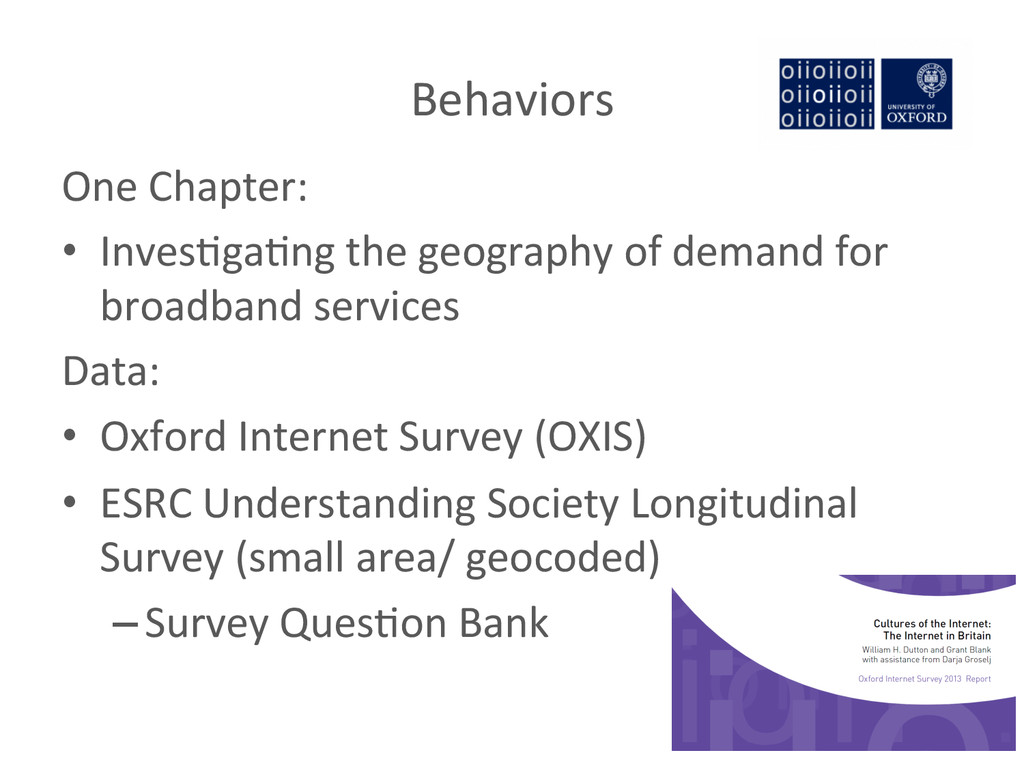
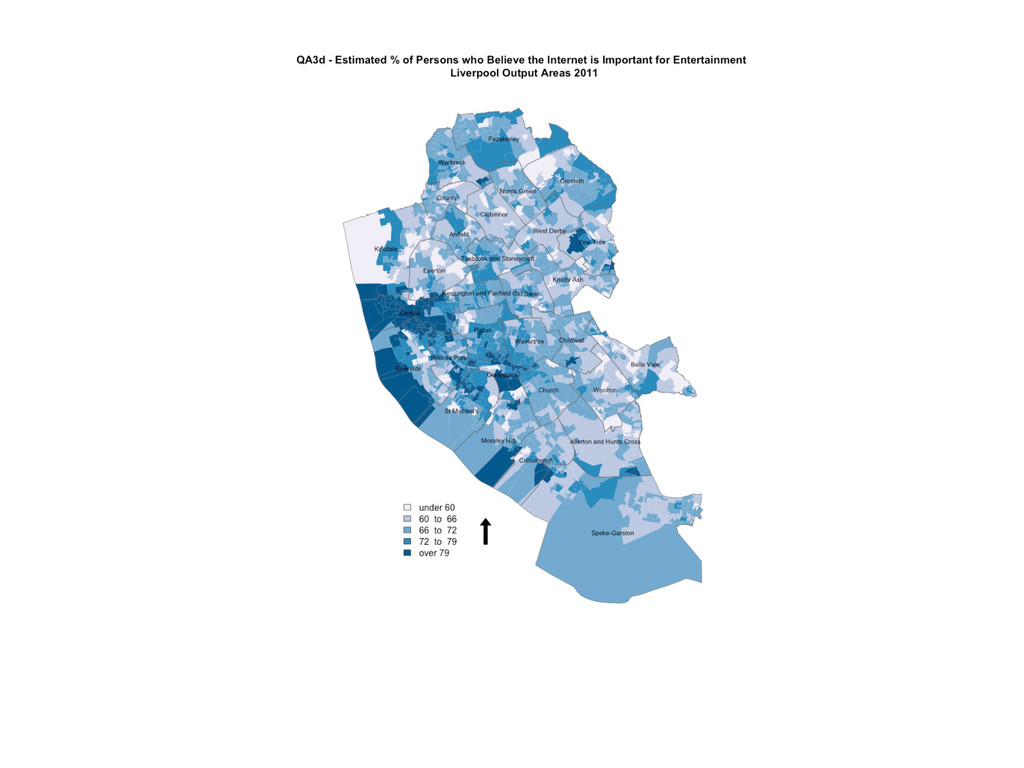
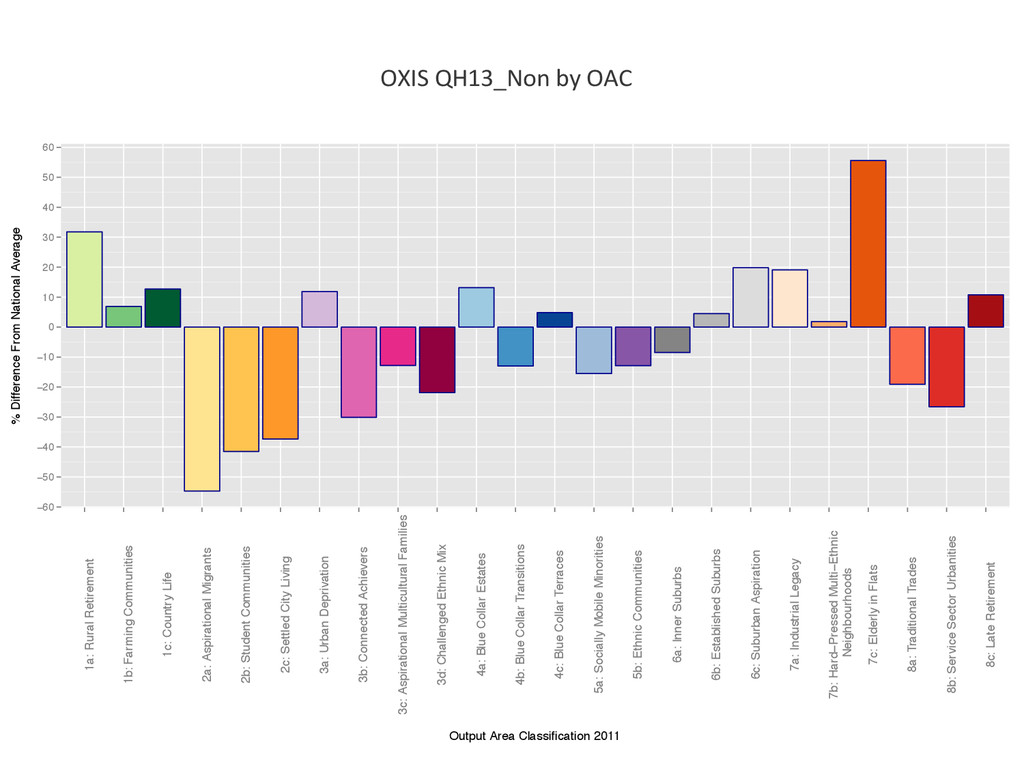
of demand for broadband services Data: • Oxford Internet Survey (OXIS) • ESRC Understanding Society Longitudinal Survey (small area/ geocoded) – Survey Ques<on Bank
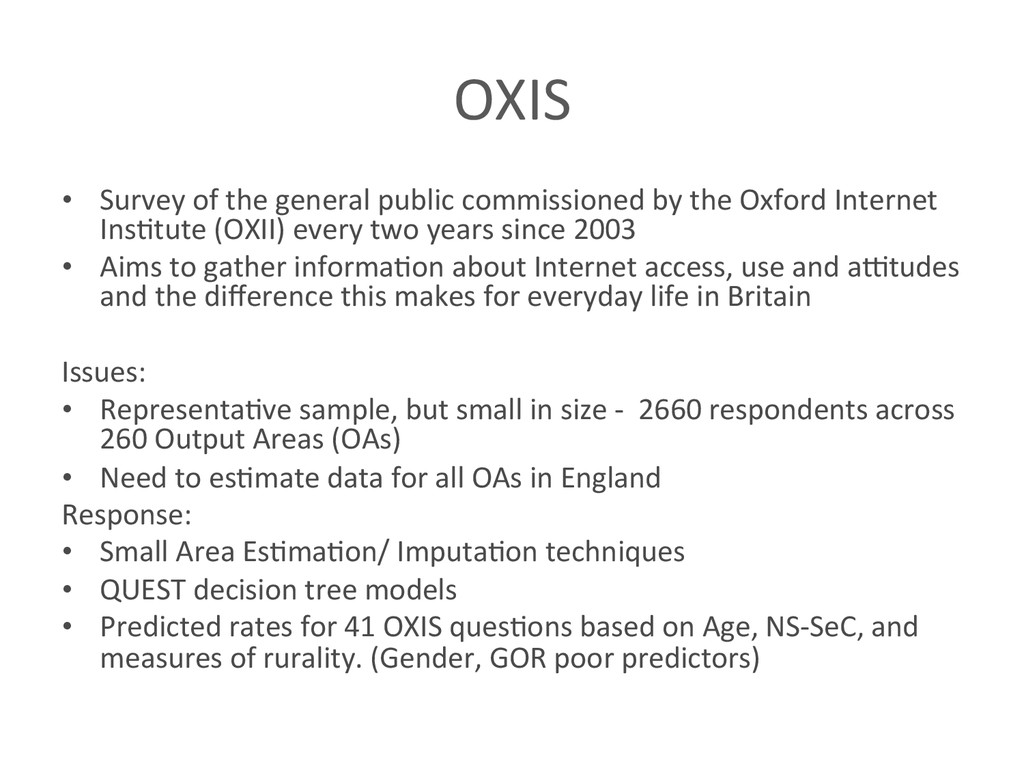
the Oxford Internet Ins<tute (OXII) every two years since 2003 • Aims to gather informa<on about Internet access, use and aftudes and the difference this makes for everyday life in Britain Issues: • Representa<ve sample, but small in size -‐ 2660 respondents across 260 Output Areas (OAs) • Need to es<mate data for all OAs in England Response: • Small Area Es<ma<on/ Imputa<on techniques • QUEST decision tree models • Predicted rates for 41 OXIS ques<ons based on Age, NS-‐SeC, and measures of rurality. (Gender, GOR poor predictors)
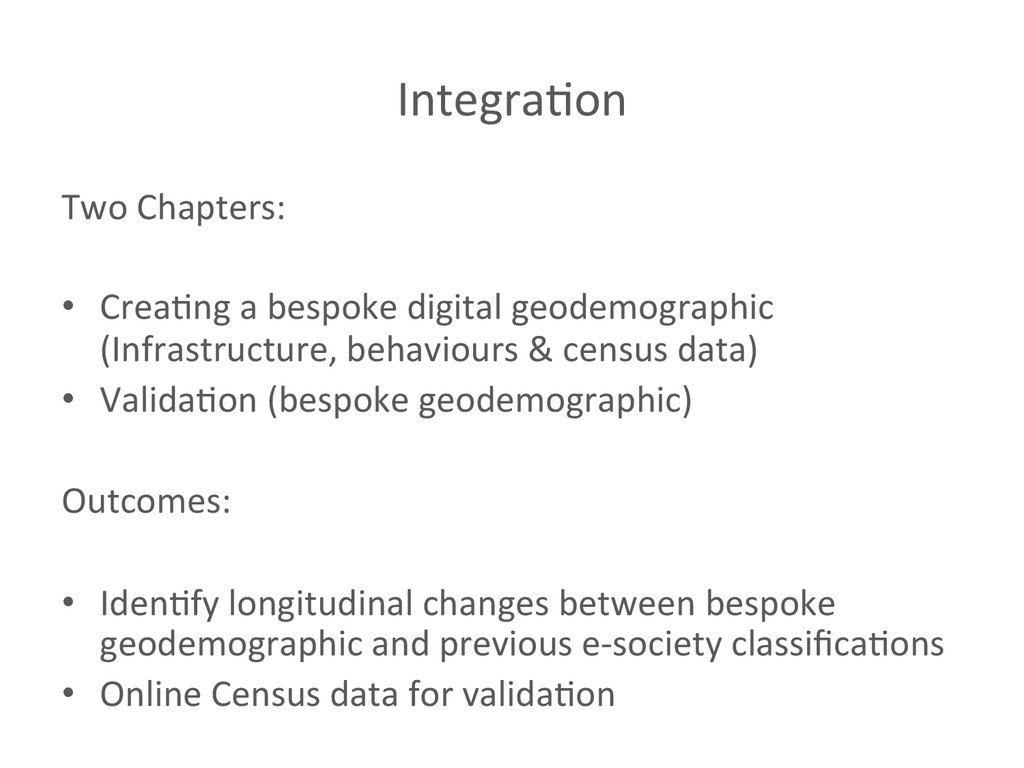
digital geodemographic (Infrastructure, behaviours & census data) • Valida<on (bespoke geodemographic) Outcomes: • Iden<fy longitudinal changes between bespoke geodemographic and previous e-‐society classifica<ons • Online Census data for valida<on
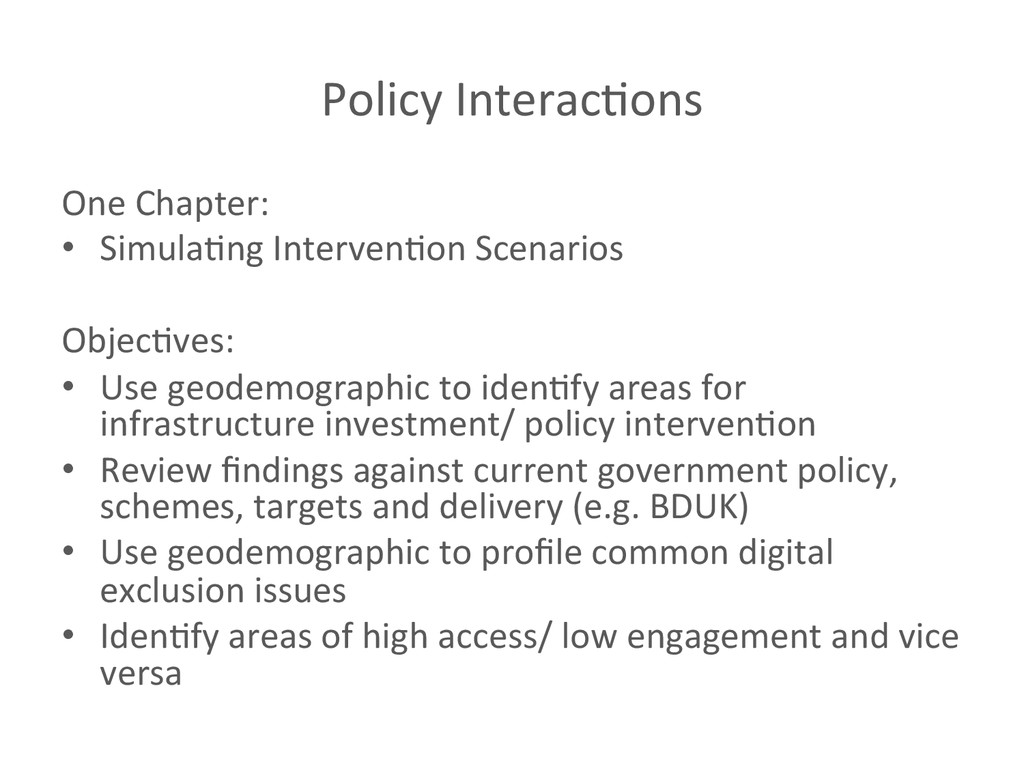
Scenarios Objec<ves: • Use geodemographic to iden<fy areas for infrastructure investment/ policy interven<on • Review findings against current government policy, schemes, targets and delivery (e.g. BDUK) • Use geodemographic to profile common digital exclusion issues • Iden<fy areas of high access/ low engagement and vice versa