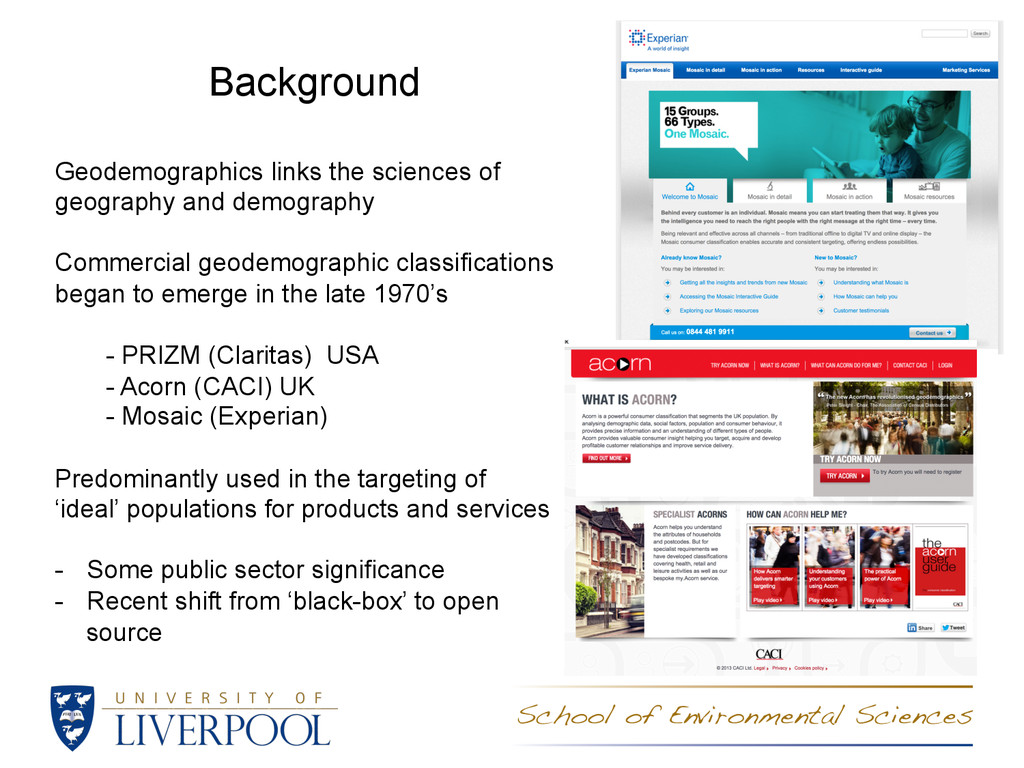
geodemographic classifications began to emerge in the late 1970’s - PRIZM (Claritas) USA - Acorn (CACI) UK - Mosaic (Experian) Predominantly used in the targeting of ‘ideal’ populations for products and services - Some public sector significance - Recent shift from ‘black-box’ to open source
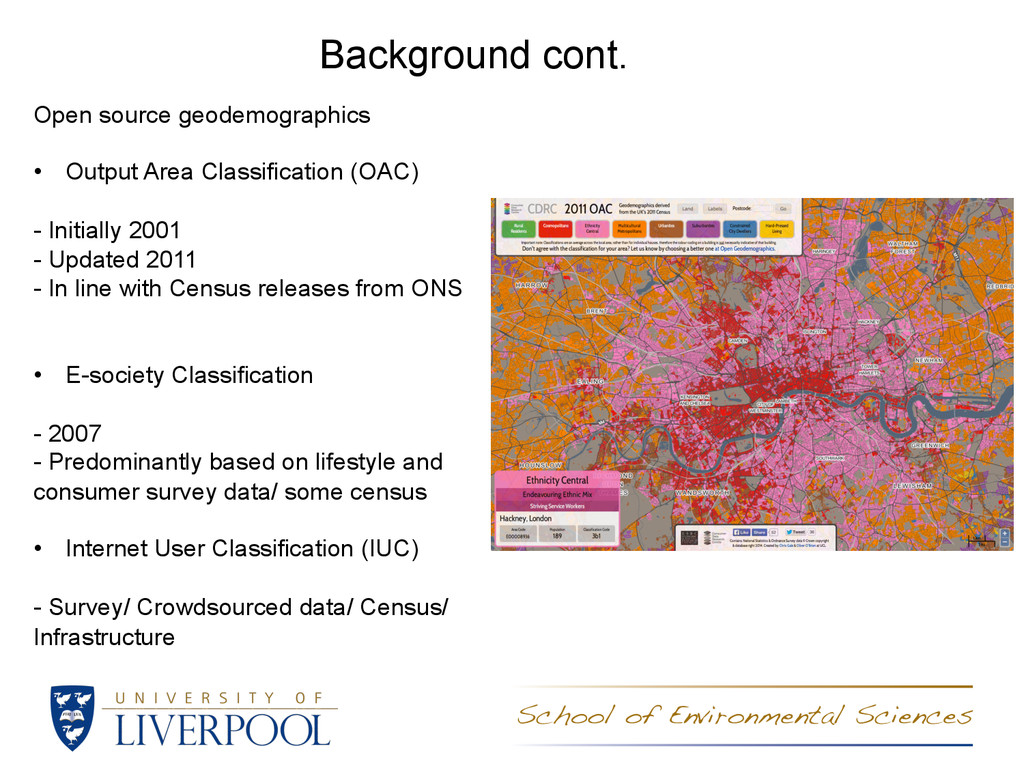
- Initially 2001 - Updated 2011 - In line with Census releases from ONS • E-society Classification - 2007 - Predominantly based on lifestyle and consumer survey data/ some census • Internet User Classification (IUC) - Survey/ Crowdsourced data/ Census/ Infrastructure
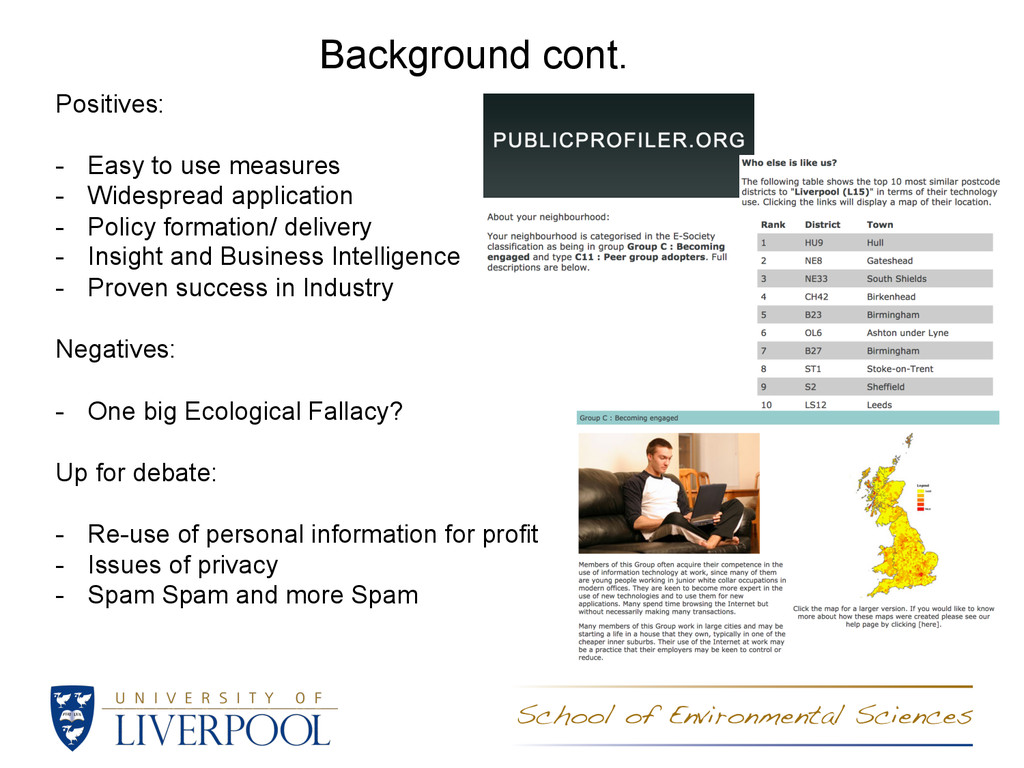
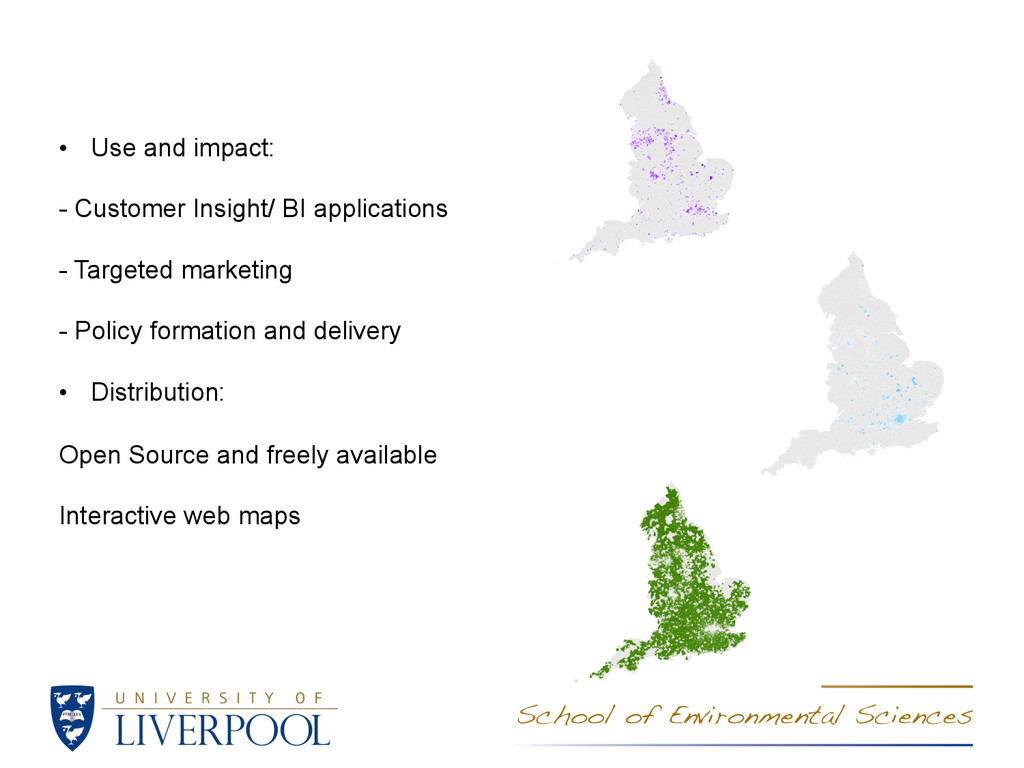
application - Policy formation/ delivery - Insight and Business Intelligence - Proven success in Industry Negatives: - One big Ecological Fallacy? Up for debate: - Re-use of personal information for profit - Issues of privacy - Spam Spam and more Spam
lack focus - The age of the Internet - Harness crowdsourced data - No domain-specific open source classifications • Specifically: - Learn from/ improve upon the E-society classification - Higher spatial resolution - Wide scope for implementation (ONS/ Online Census 2021) - An interesting PhD topic
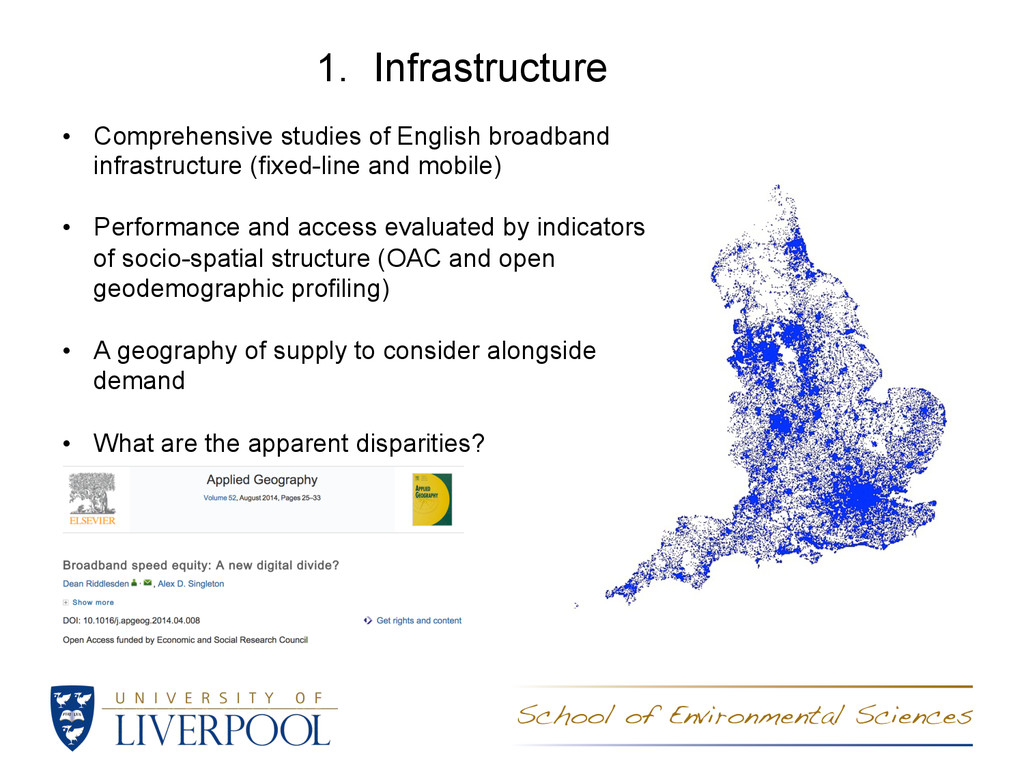
and mobile) • Performance and access evaluated by indicators of socio-spatial structure (OAC and open geodemographic profiling) • A geography of supply to consider alongside demand • What are the apparent disparities?
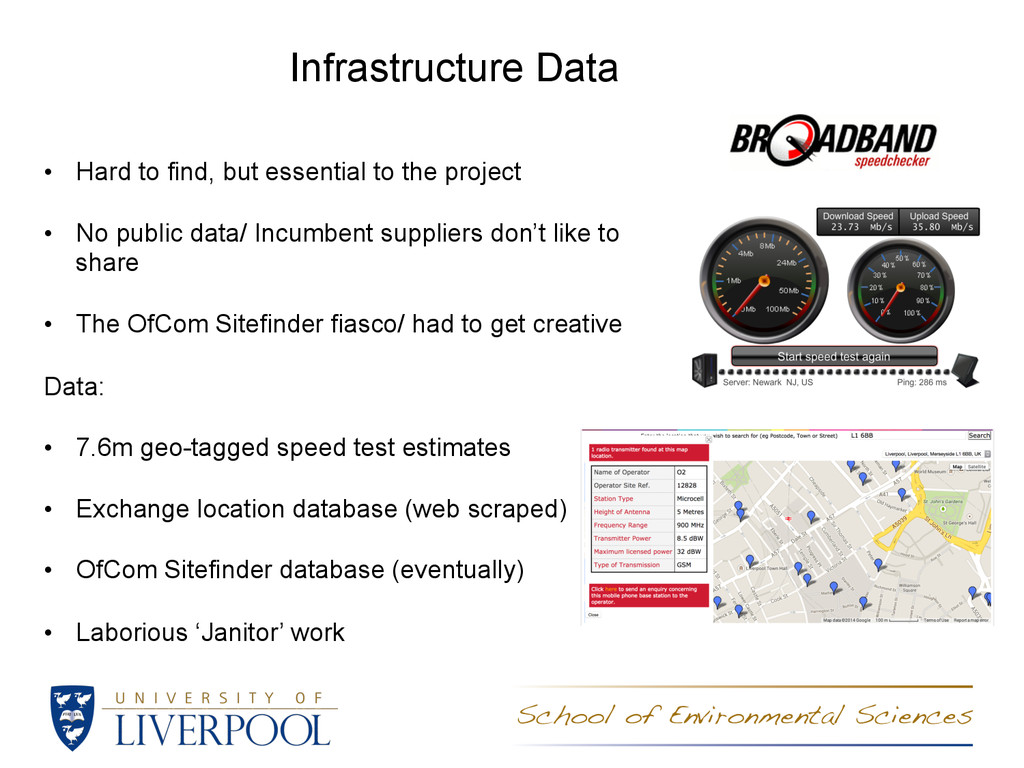
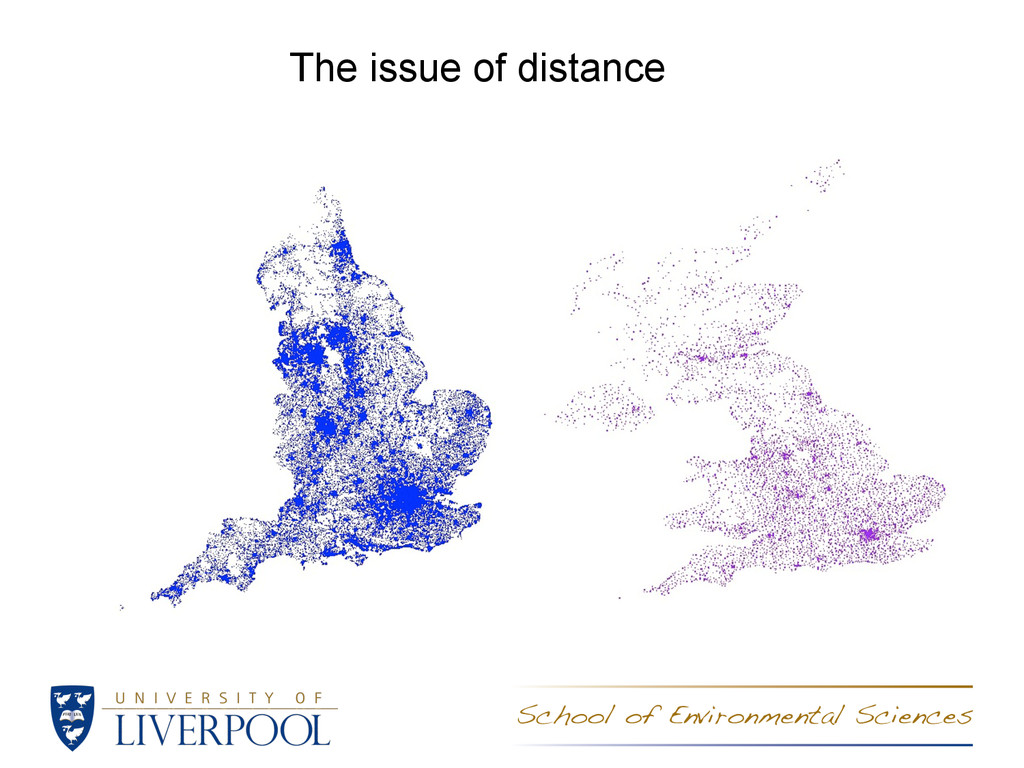
project • No public data/ Incumbent suppliers don’t like to share • The OfCom Sitefinder fiasco/ had to get creative Data: • 7.6m geo-tagged speed test estimates • Exchange location database (web scraped) • OfCom Sitefinder database (eventually) • Laborious ‘Janitor’ work
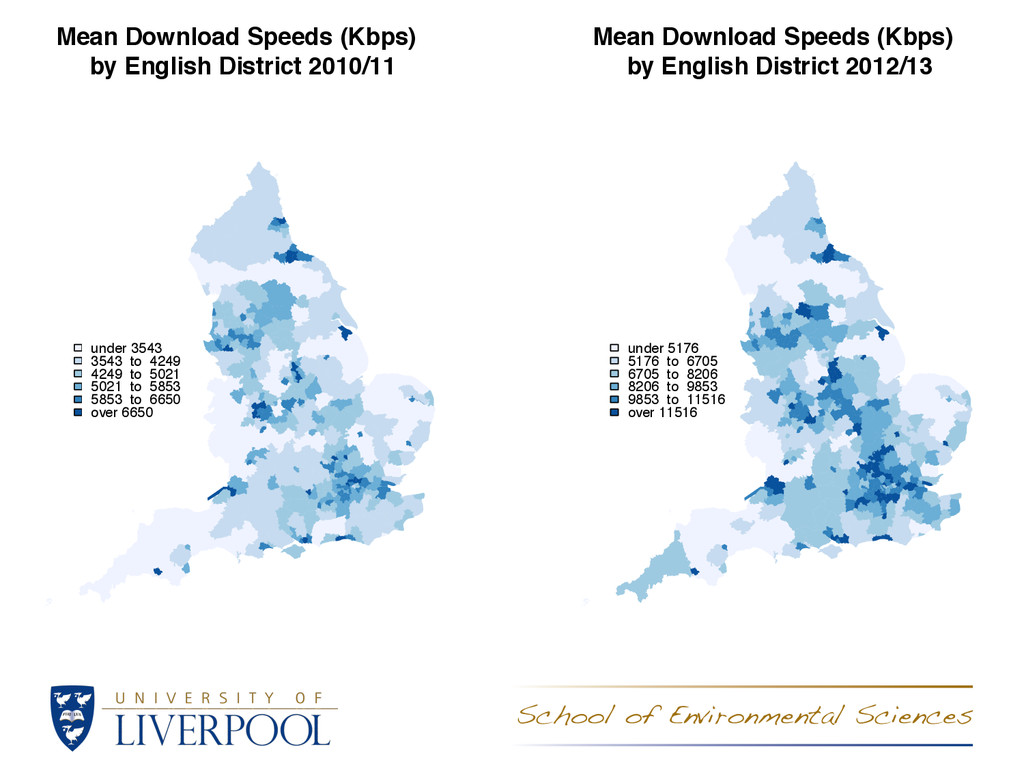
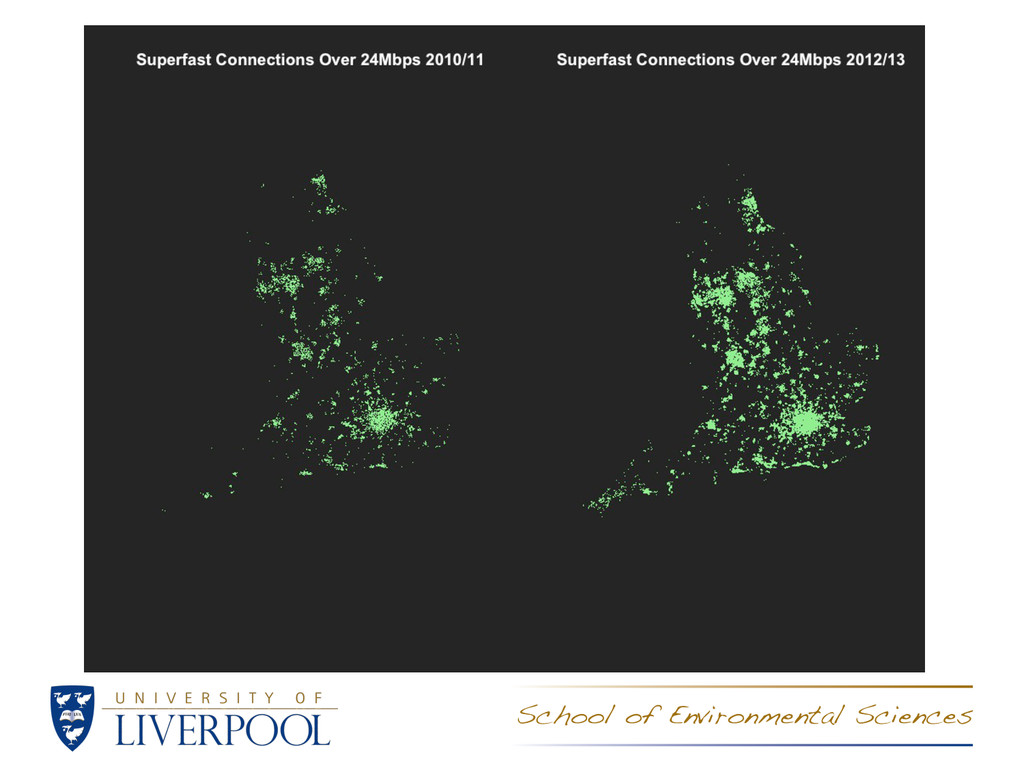
5853 5853 to 6650 over 6650 Mean Download Speeds (Kbps) by English District 2010/11 under 5176 5176 to 6705 6705 to 8206 8206 to 9853 9853 to 11516 over 11516 Mean Download Speeds (Kbps) by English District 2012/13
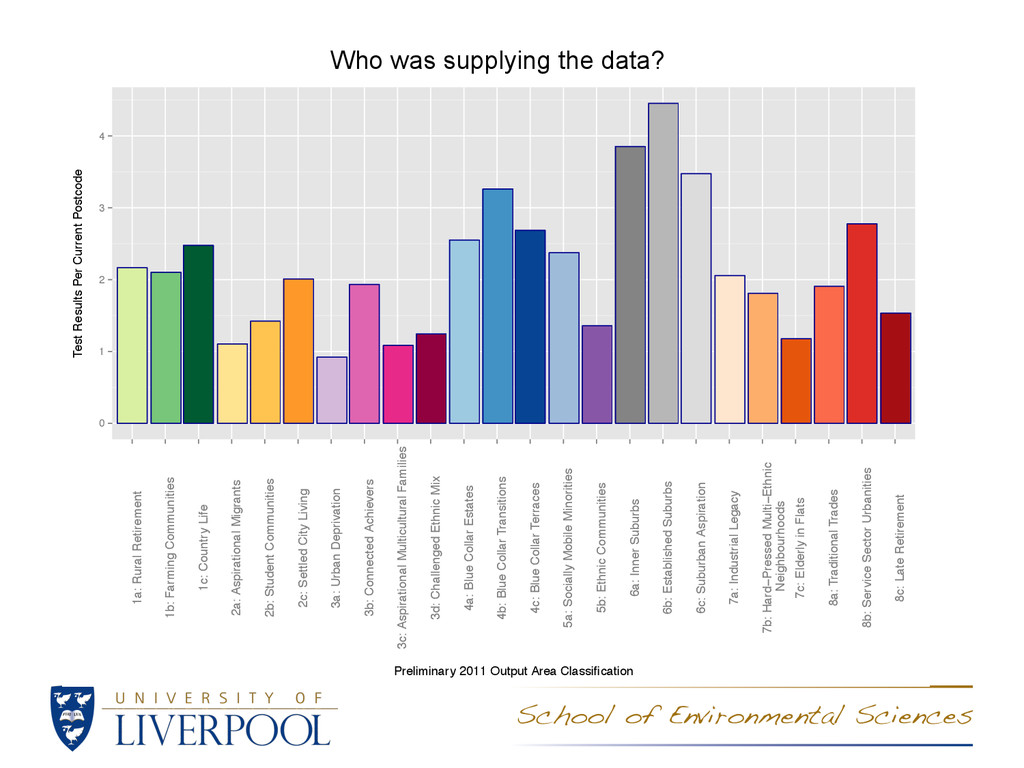
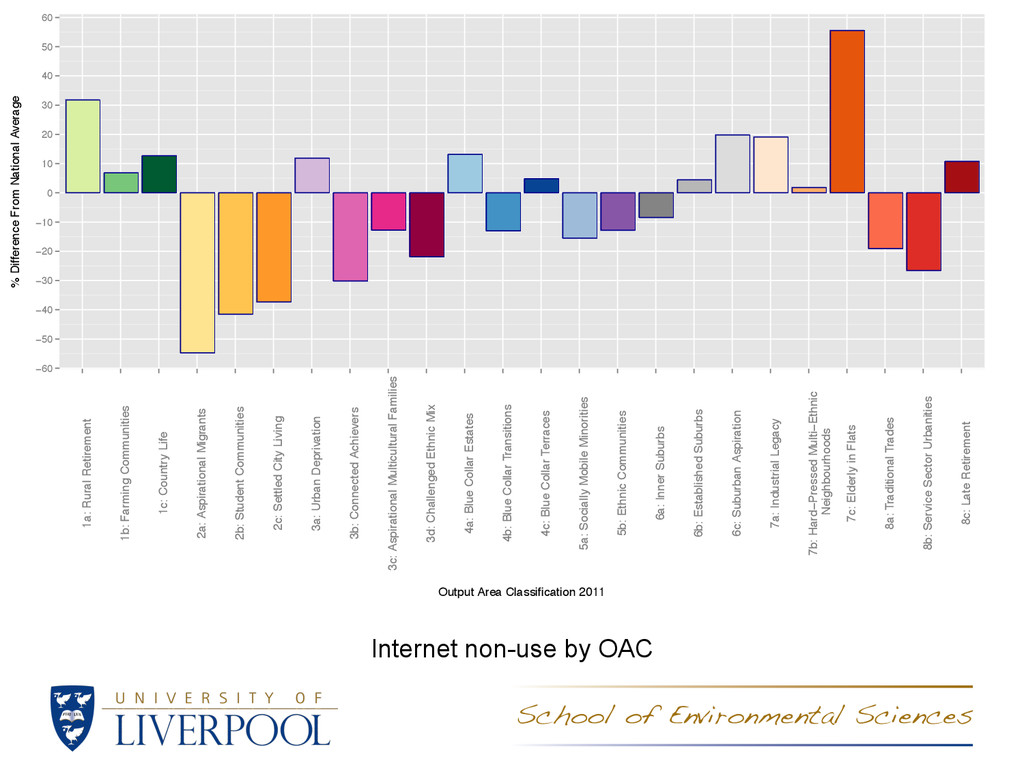
Communities 1c: Country Life 2a: Aspirational Migrants 2b: Student Communities 2c: Settled City Living 3a: Urban Deprivation 3b: Connected Achievers 3c: Aspirational Multicultural Families 3d: Challenged Ethnic Mix 4a: Blue Collar Estates 4b: Blue Collar Transitions 4c: Blue Collar Terraces 5a: Socially Mobile Minorities 5b: Ethnic Communities 6a: Inner Suburbs 6b: Established Suburbs 6c: Suburban Aspiration 7a: Industrial Legacy 7b: Hard−Pressed Multi−Ethnic Neighbourhoods 7c: Elderly in Flats 8a: Traditional Trades 8b: Service Sector Urbanities 8c: Late Retirement Preliminary 2011 Output Area Classification Test Results Per Current Postcode Who was supplying the data?
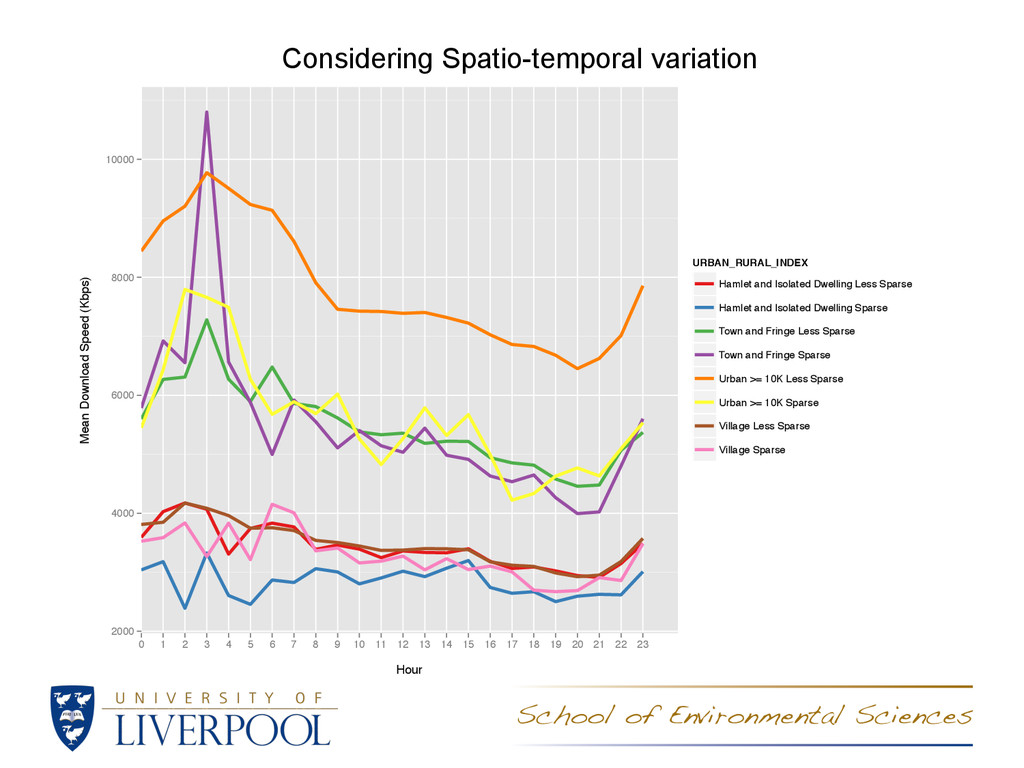
9 22 8 15 10 12 13 6 0 20 18 23 7 2 19 14 4 3 5 Hour Mean Download Speed (Kbps) URBAN_RURAL_INDEX Hamlet and Isolated Dwelling Less Sparse Hamlet and Isolated Dwelling Sparse Town and Fringe Less Sparse Town and Fringe Sparse Urban >= 10K Less Sparse Urban >= 10K Sparse Village Less Sparse Village Sparse Considering Spatio-temporal variation
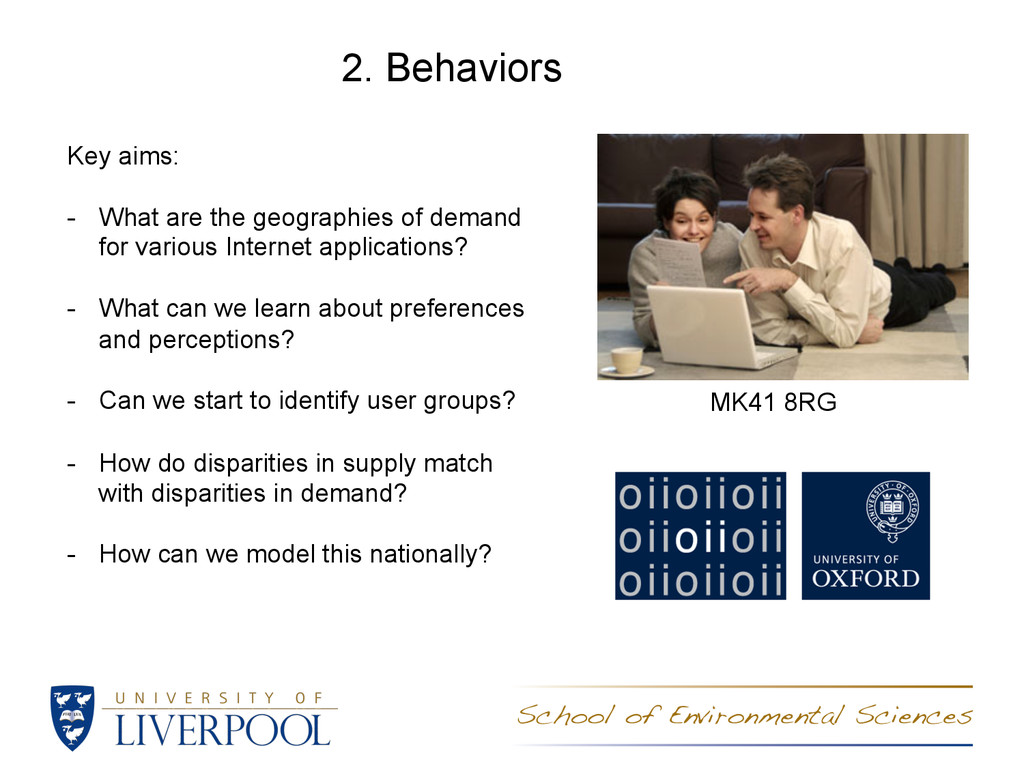
demand for various Internet applications? - What can we learn about preferences and perceptions? - Can we start to identify user groups? - How do disparities in supply match with disparities in demand? - How can we model this nationally? MK41 8RG
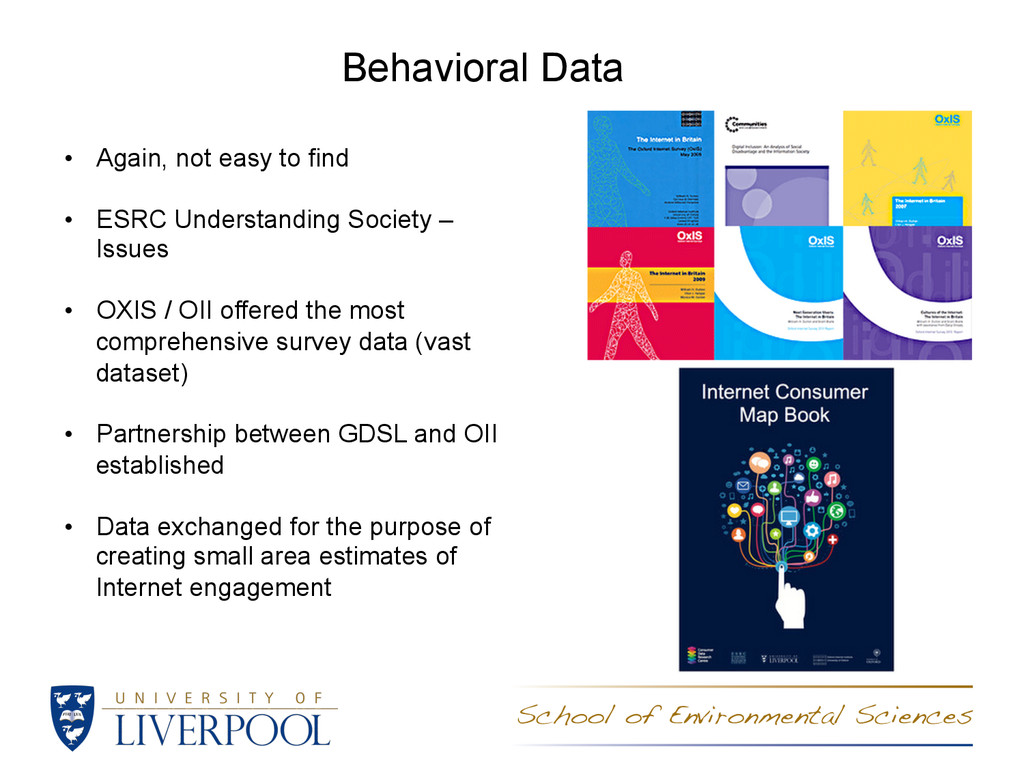
Understanding Society – Issues • OXIS / OII offered the most comprehensive survey data (vast dataset) • Partnership between GDSL and OII established • Data exchanged for the purpose of creating small area estimates of Internet engagement
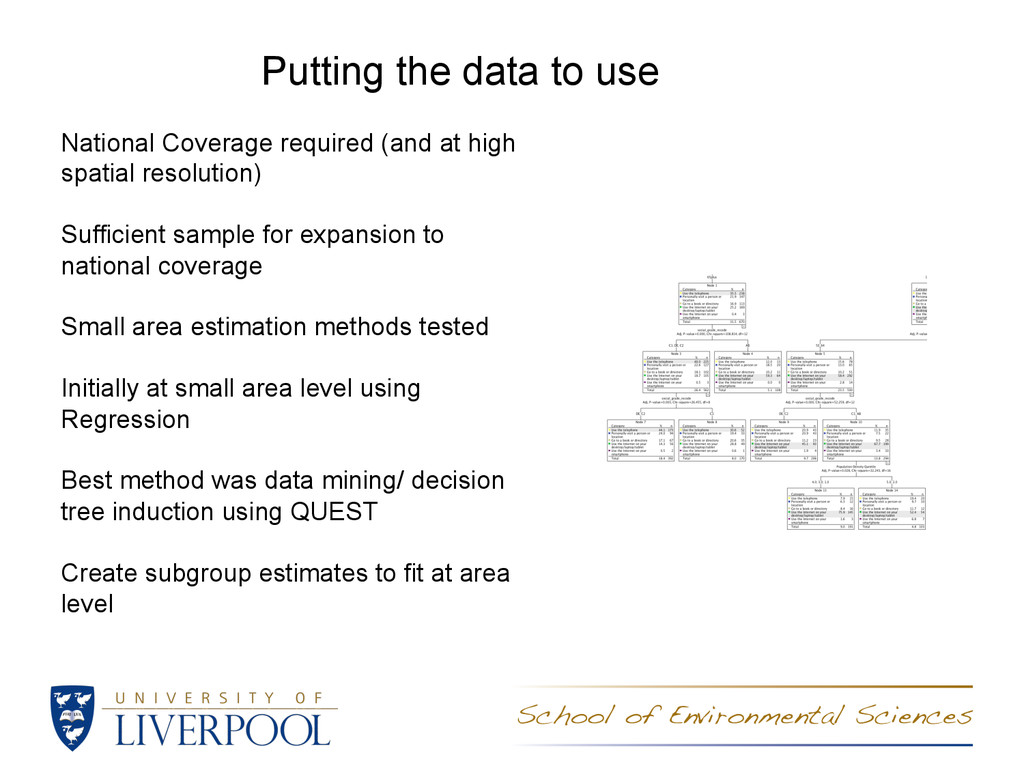
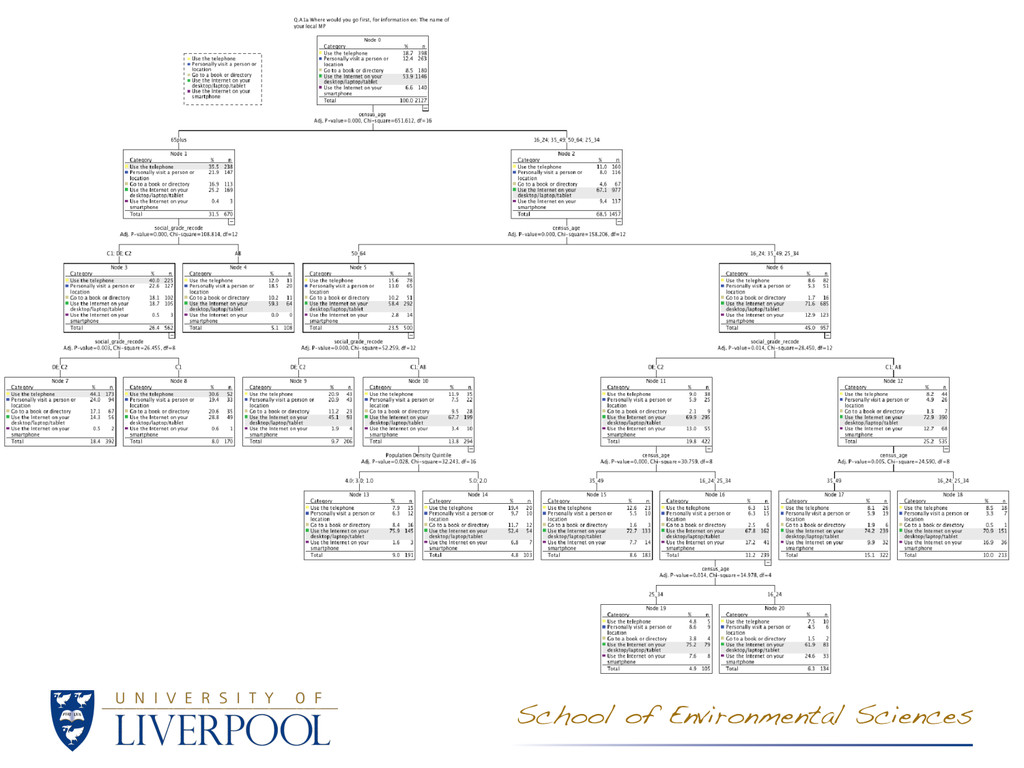
high spatial resolution) Sufficient sample for expansion to national coverage Small area estimation methods tested Initially at small area level using Regression Best method was data mining/ decision tree induction using QUEST Create subgroup estimates to fit at area level
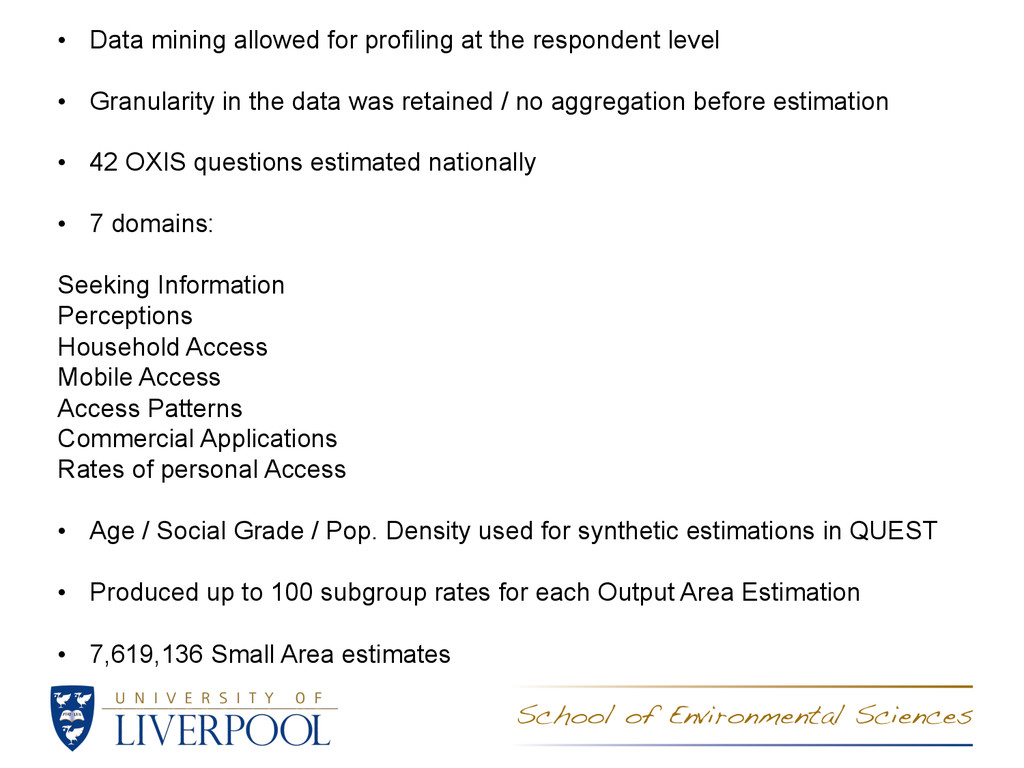
• Granularity in the data was retained / no aggregation before estimation • 42 OXIS questions estimated nationally • 7 domains: Seeking Information Perceptions Household Access Mobile Access Access Patterns Commercial Applications Rates of personal Access • Age / Social Grade / Pop. Density used for synthetic estimations in QUEST • Produced up to 100 subgroup rates for each Output Area Estimation • 7,619,136 Small Area estimates
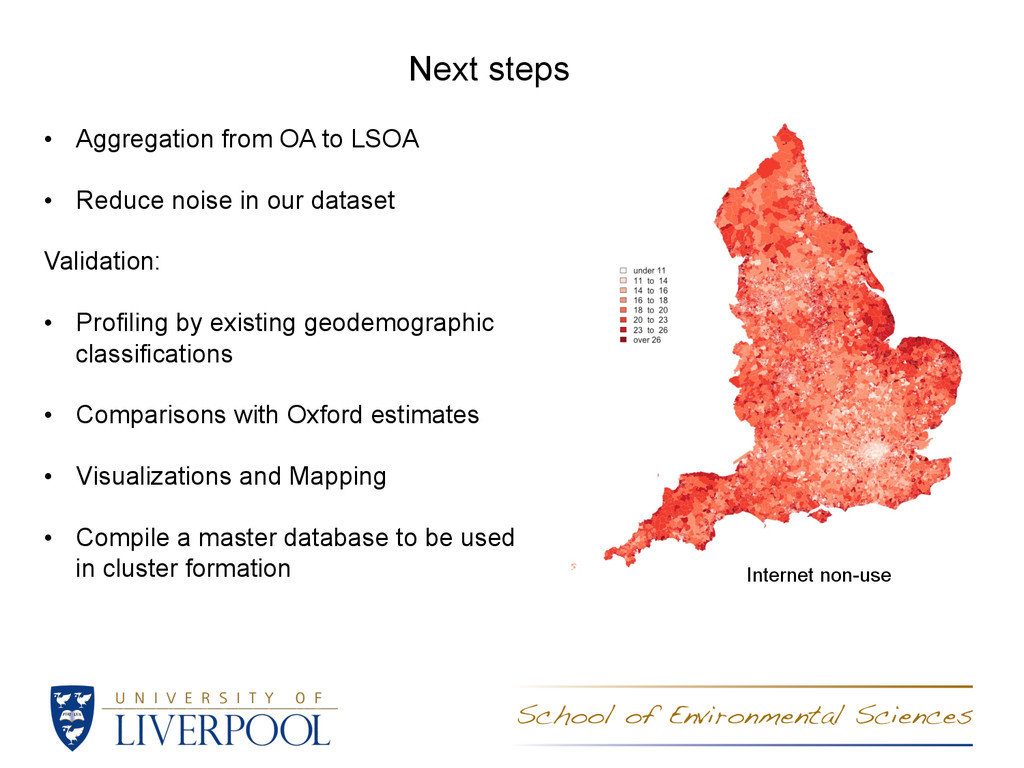
noise in our dataset Validation: • Profiling by existing geodemographic classifications • Comparisons with Oxford estimates • Visualizations and Mapping • Compile a master database to be used in cluster formation Internet non-use
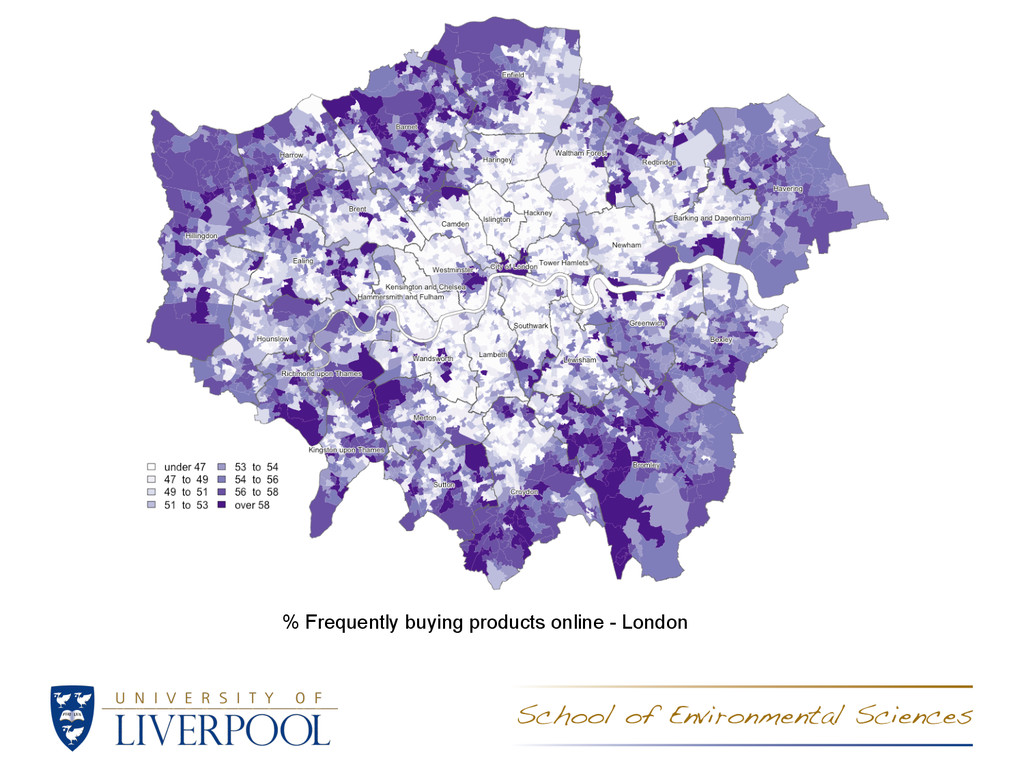
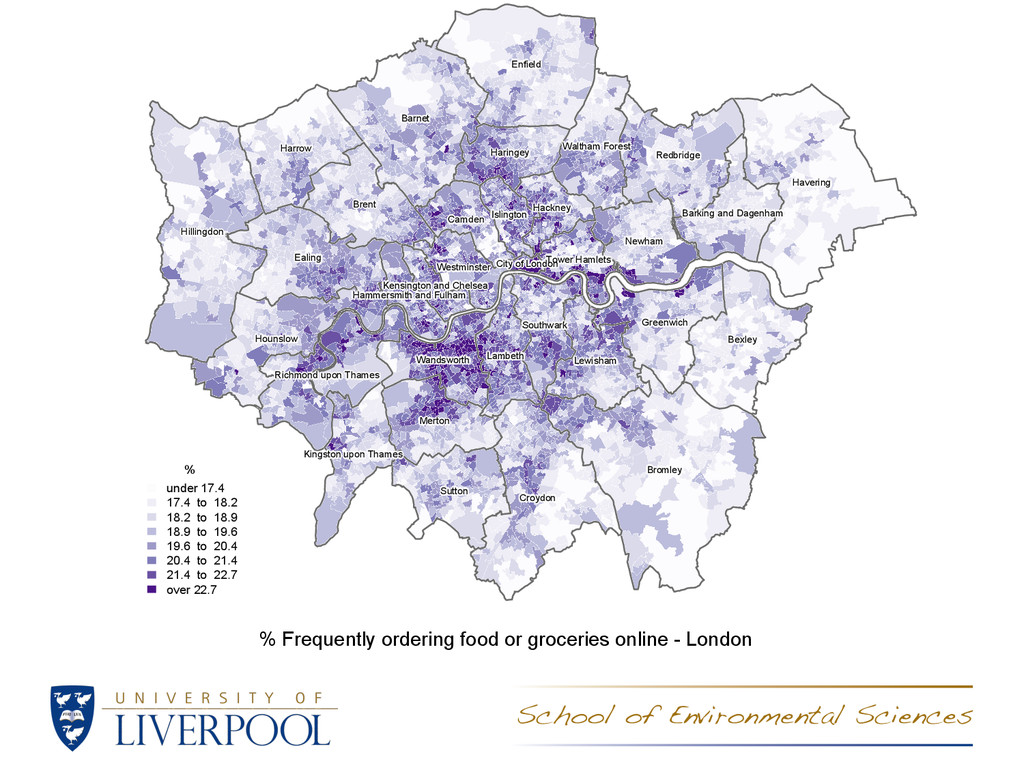
Croydon Kingston upon Thames Harrow Wandsworth Hounslow Haringey Newham Camden Waltham Forest Hackney Redbridge Hillingdon Tower Hamlets City of London Islington Barking and Dagenham Bromley Richmond upon Thames Bexley Barnet Merton Lewisham Ealing Westminster Greenwich Southwark Lambeth Kensington and Chelsea Hammersmith and Fulham Brent Havering Sutton Enfield Croydon Kingston upon Thames Harrow Wandsworth Hounslow Haringey Newham Camden Waltham Forest Hackney Redbridge Hillingdon Tower Hamlets City of London Islington Barking and Dagenham Bromley Richmond upon Thames Bexley Barnet Merton Lewisham Ealing Westminster Greenwich Southwark Lambeth Kensington and Chelsea Hammersmith and Fulham Brent Havering Sutton Enfield Croydon Kingston upon Thames Harrow Wandsworth Hounslow Haringey Newham Camden Waltham Forest Hackney Redbridge Hillingdon Tower Hamlets City of London Islington Barking and Dagenham Bromley Richmond upon Thames Bexley Barnet Merton Lewisham Ealing Westminster Greenwich Southwark Lambeth Kensington and Chelsea Hammersmith and Fulham Brent Havering Sutton Enfield Croydon Kingston upon Thames Harrow Wandsworth Hounslow Haringey Newham Camden Waltham Forest Hackney Redbridge Hillingdon Tower Hamlets City of London Islington Barking and Dagenham Bromley Richmond upon Thames Bexley Barnet Merton Lewisham Ealing Westminster Greenwich Southwark Lambeth Kensington and Chelsea Hammersmith and Fulham Brent Havering Sutton Enfield Croydon Kingston upon Thames Harrow Wandsworth Hounslow Haringey Newham Camden Waltham Forest Hackney Redbridge Hillingdon Tower Hamlets City of London Islington Barking and Dagenham Bromley Richmond upon Thames Bexley Barnet Merton Lewisham Ealing Westminster Greenwich Southwark Lambeth Kensington and Chelsea Hammersmith and Fulham Brent Havering Sutton Enfield Croydon Kingston upon Thames Harrow Wandsworth Hounslow Haringey Newham Camden Waltham Forest Hackney Redbridge Hillingdon Tower Hamlets City of London Islington Barking and Dagenham Bromley Richmond upon Thames Bexley Barnet Merton Lewisham Ealing Westminster Greenwich Southwark Lambeth Kensington and Chelsea Hammersmith and Fulham Brent Havering Sutton Enfield Croydon Kingston upon Thames Harrow Wandsworth Hounslow Haringey Newham Camden Waltham Forest Hackney Redbridge Hillingdon Tower Hamlets City of London Islington Barking and Dagenham Bromley Richmond upon Thames Bexley Barnet Merton Lewisham Ealing Westminster Greenwich Southwark Lambeth Kensington and Chelsea Hammersmith and Fulham Brent Havering Sutton Enfield Croydon Kingston upon Thames Harrow Wandsworth Hounslow Haringey Newham Camden Waltham Forest Hackney Redbridge Hillingdon Tower Hamlets City of London Islington Barking and Dagenham Bromley Richmond upon Thames Bexley Barnet Merton Lewisham Ealing Westminster Greenwich Southwark Lambeth Kensington and Chelsea Hammersmith and Fulham Brent Havering Sutton Enfield Croydon Kingston upon Thames Harrow Wandsworth Hounslow Haringey Newham Camden Waltham Forest Hackney Redbridge Hillingdon Tower Hamlets City of London Islington Barking and Dagenham Bromley Richmond upon Thames Bexley Barnet Merton Lewisham Ealing Westminster Greenwich Southwark Lambeth % under 17 17 to 18 18 to 19 19 to 20 20 to 20 20 to 21 21 to 23 over 23 % under 17.4 17.4 to 18.2 18.2 to 18.9 18.9 to 19.6 19.6 to 20.4 20.4 to 21.4 21.4 to 22.7 over 22.7 % Frequently ordering food or groceries online - London
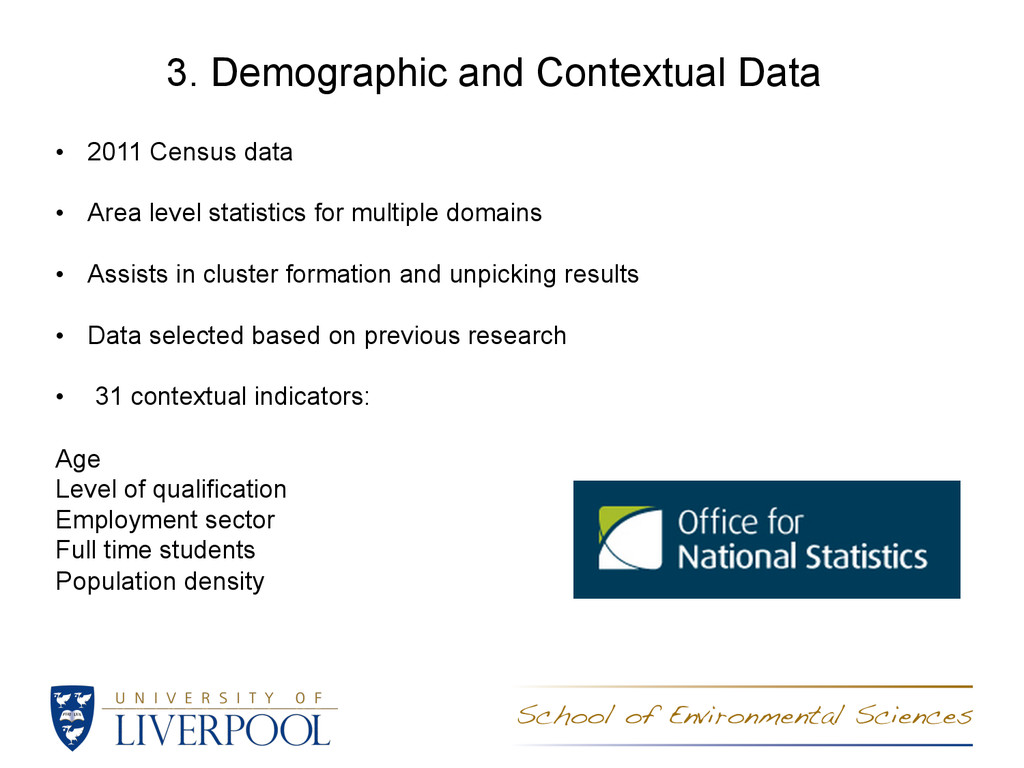
Area level statistics for multiple domains • Assists in cluster formation and unpicking results • Data selected based on previous research • 31 contextual indicators: Age Level of qualification Employment sector Full time students Population density
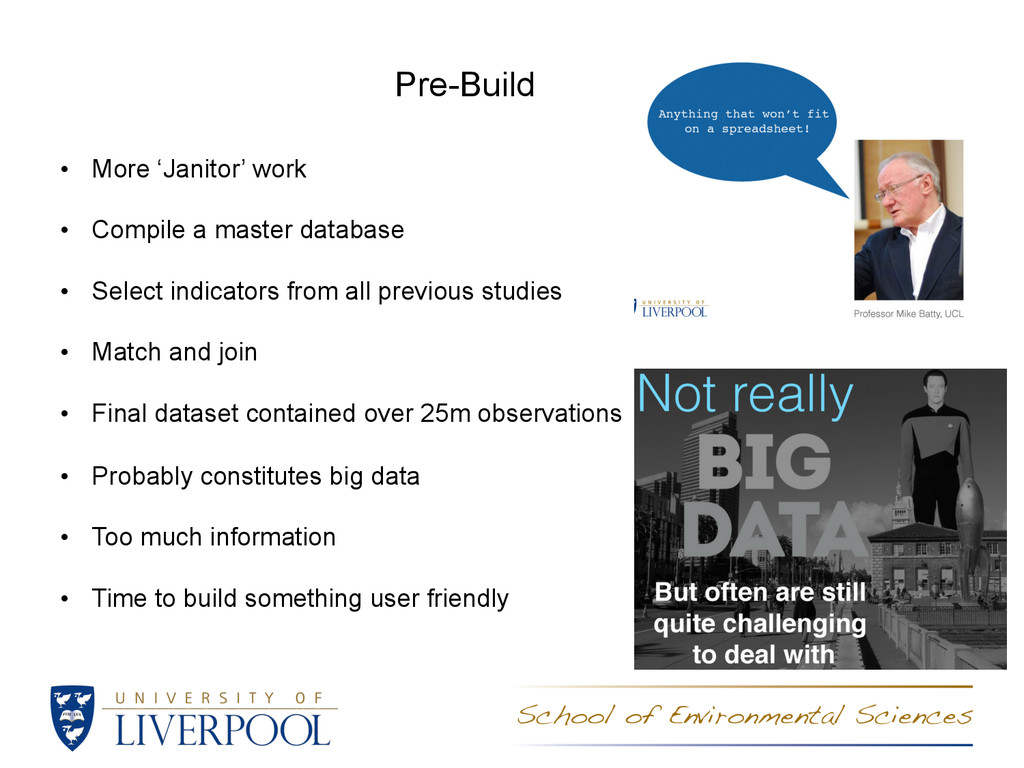
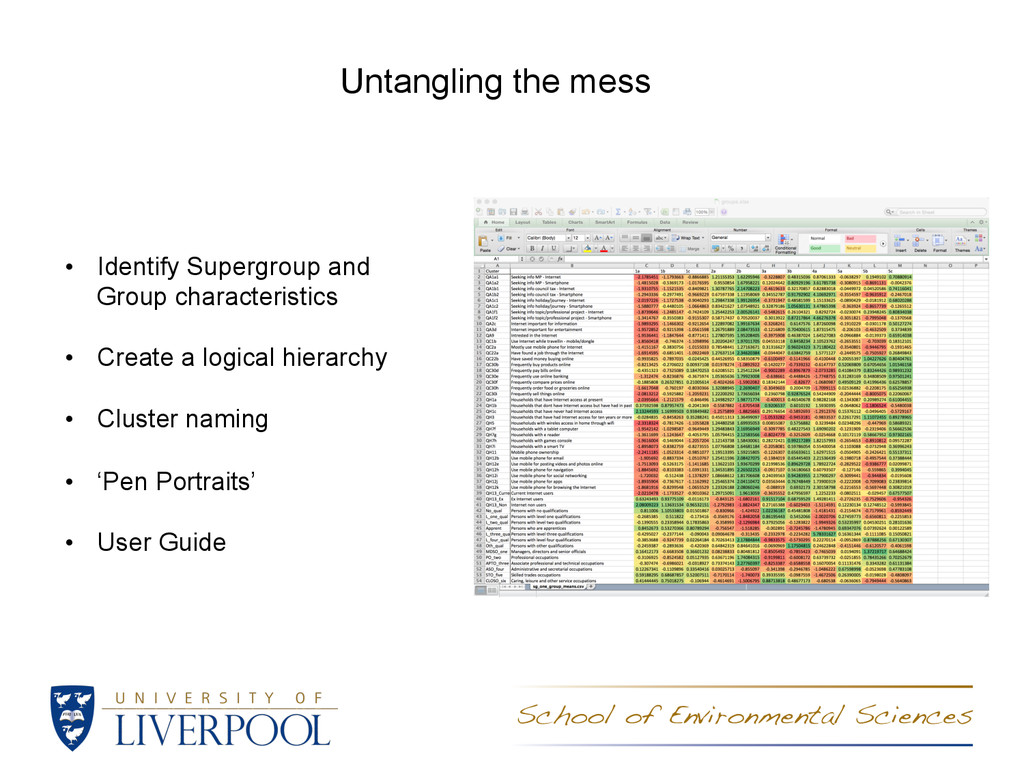
• Select indicators from all previous studies • Match and join • Final dataset contained over 25m observations • Probably constitutes big data • Too much information • Time to build something user friendly
built carefully • Input data is crucially important – E-society failures • Requirement for more focused classifications • Classification building involves trial and error. Part art, part science • Data acquisition is time consuming and difficult • Open source classifications are increasing in popularity • IUC success will depend on uptake – time will tell