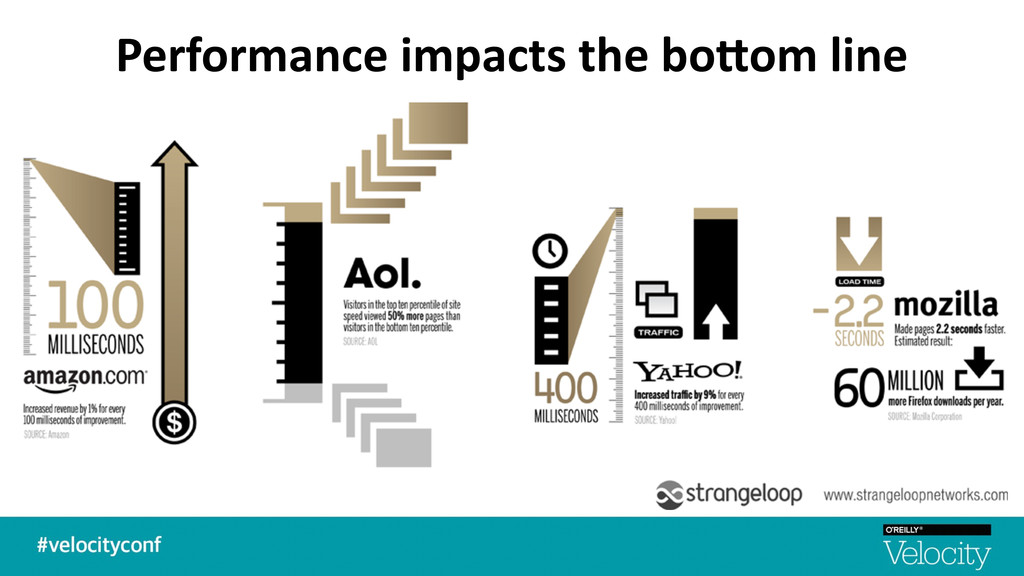
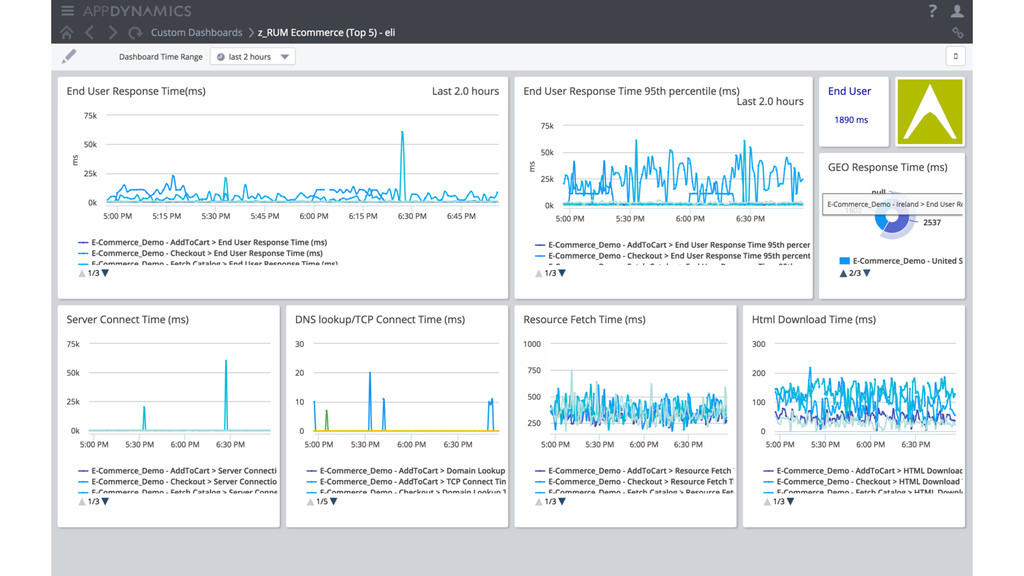
a great user experience -‐ Under 100ms is perceived as reac$ng instantaneously -‐ A 100ms to 300ms delay is percep$ble -‐ 1 second is about the limit for the user's flow of thought to stay uninterrupted -‐ Users expect a site to load in 2 seconds -‐ ADer 3 seconds, 40% will abandon your site. -‐ 10 seconds is about the limit for keeping the user's a*en$on § Modern applica7ons spend more 7me in the browser than on the server-‐side
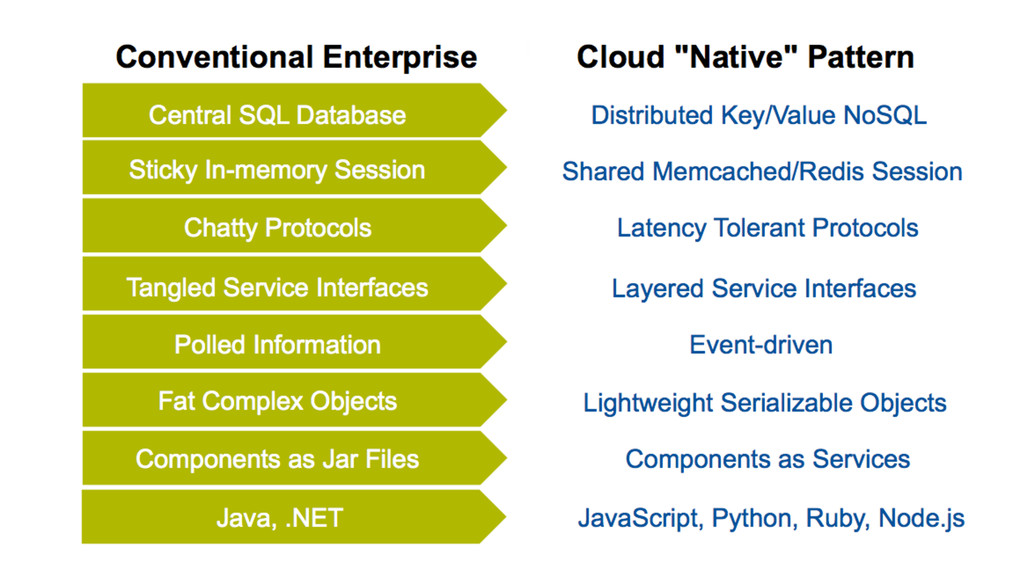
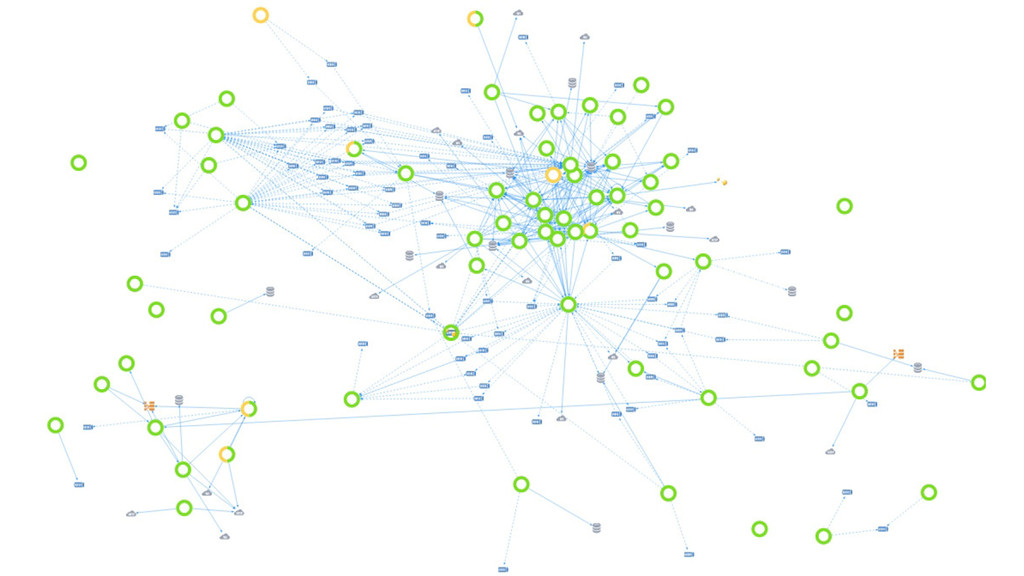
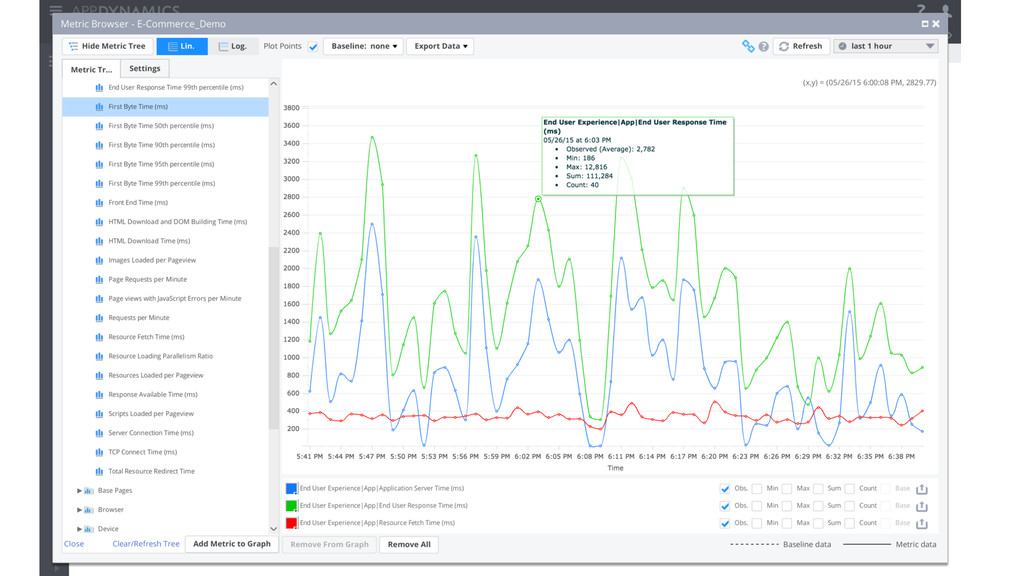
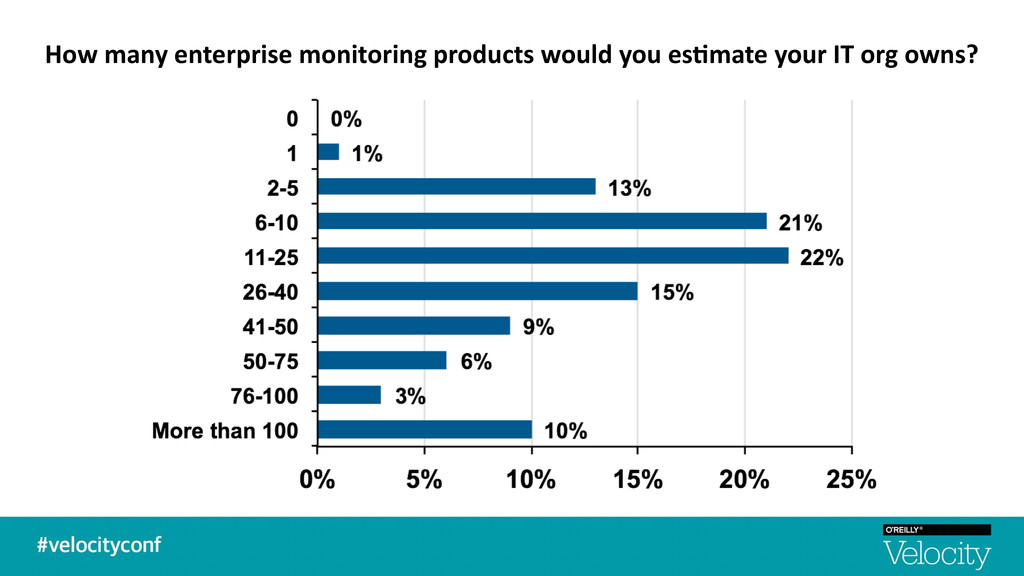
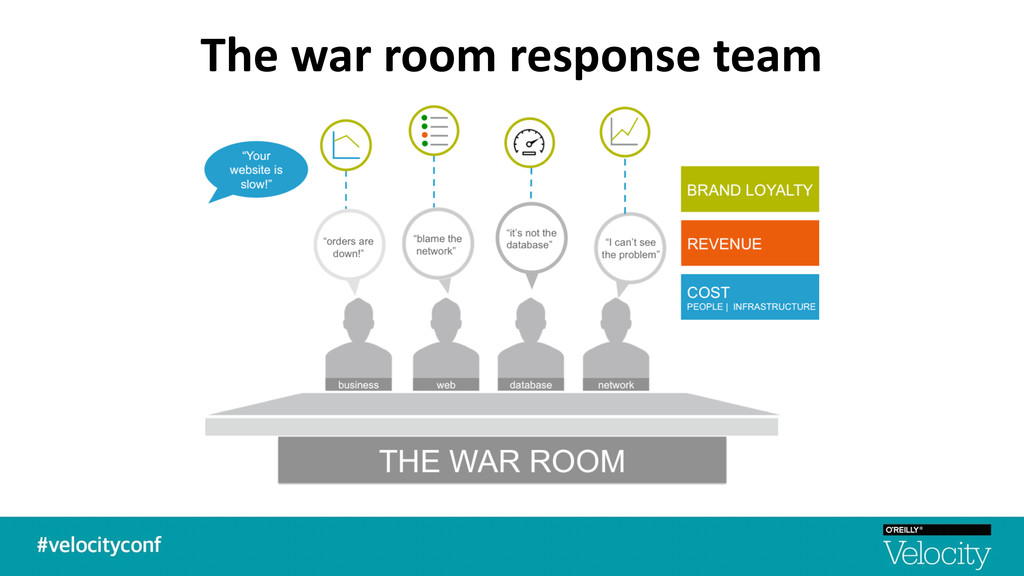
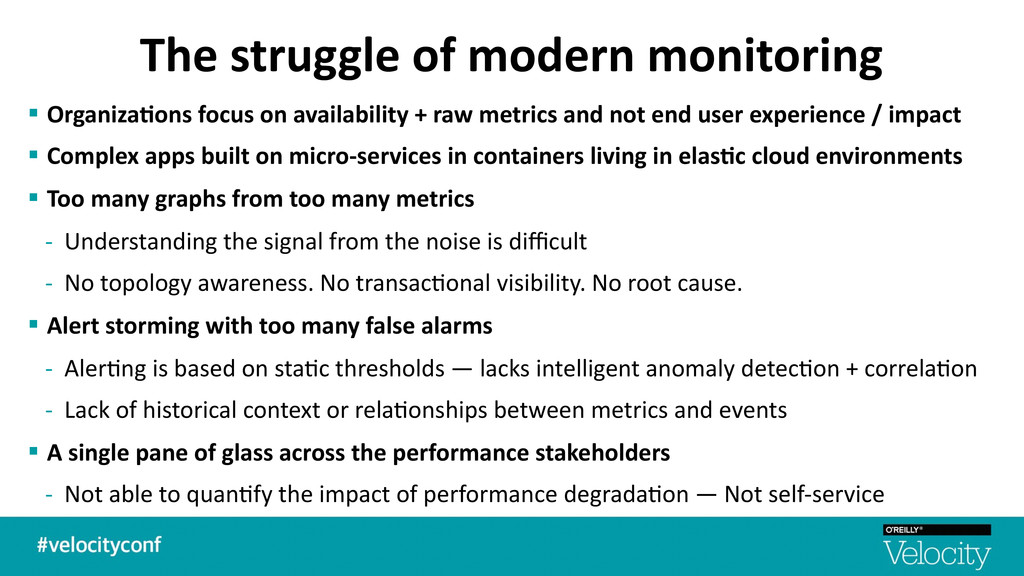
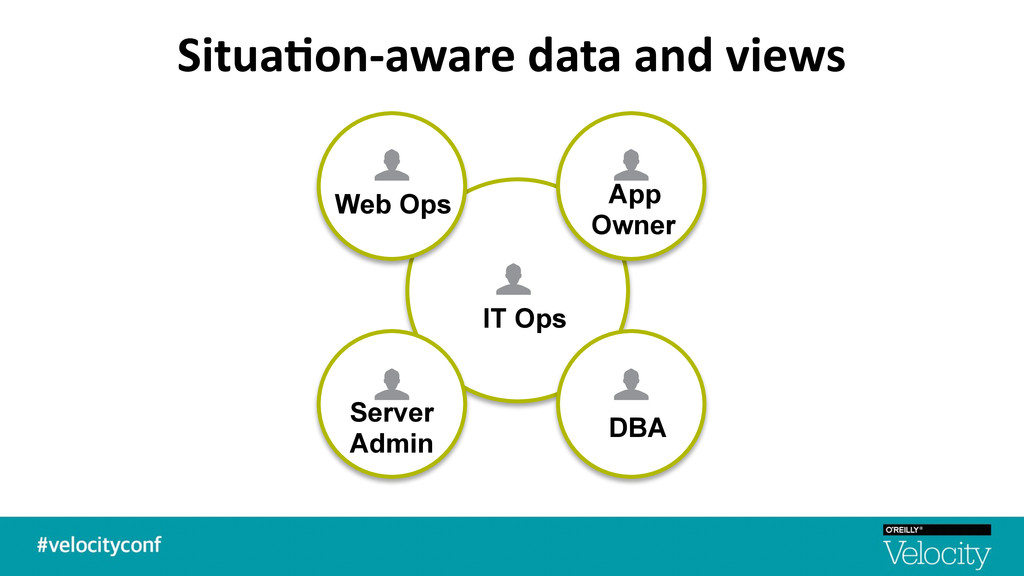
+ raw metrics and not end user experience / impact § Complex apps built on micro-‐services in containers living in elas7c cloud environments § Too many graphs from too many metrics -‐ Understanding the signal from the noise is difficult -‐ No topology awareness. No transac$onal visibility. No root cause. § Alert storming with too many false alarms -‐ Aler$ng is based on sta$c thresholds — lacks intelligent anomaly detec$on + correla$on -‐ Lack of historical context or rela$onships between metrics and events § A single pane of glass across the performance stakeholders -‐ Not able to quan$fy the impact of performance degrada$on — Not self-‐service
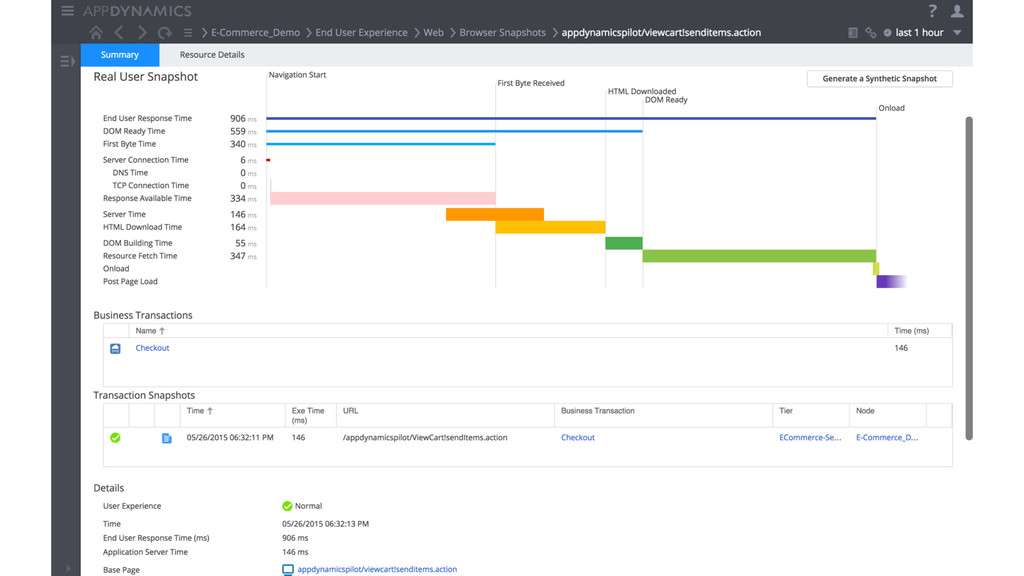
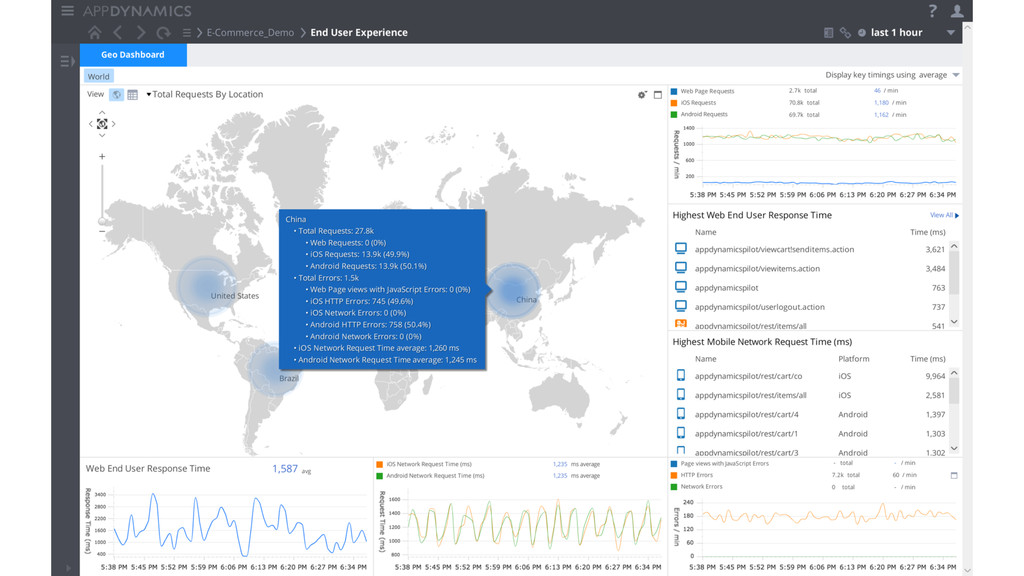
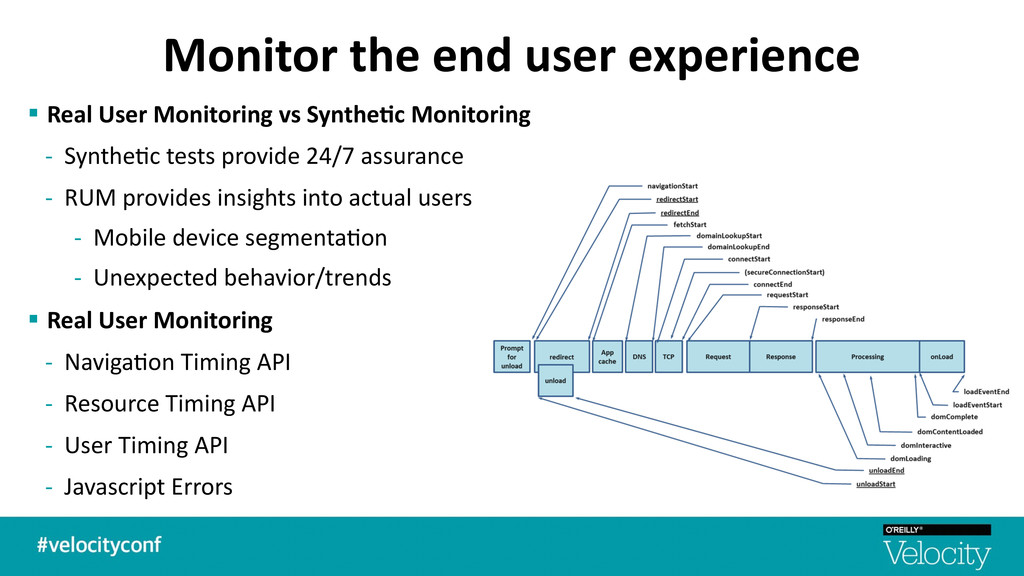
Synthe7c Monitoring -‐ Synthe$c tests provide 24/7 assurance -‐ RUM provides insights into actual users -‐ Mobile device segmenta$on -‐ Unexpected behavior/trends § Real User Monitoring -‐ Naviga$on Timing API -‐ Resource Timing API -‐ User Timing API -‐ Javascript Errors
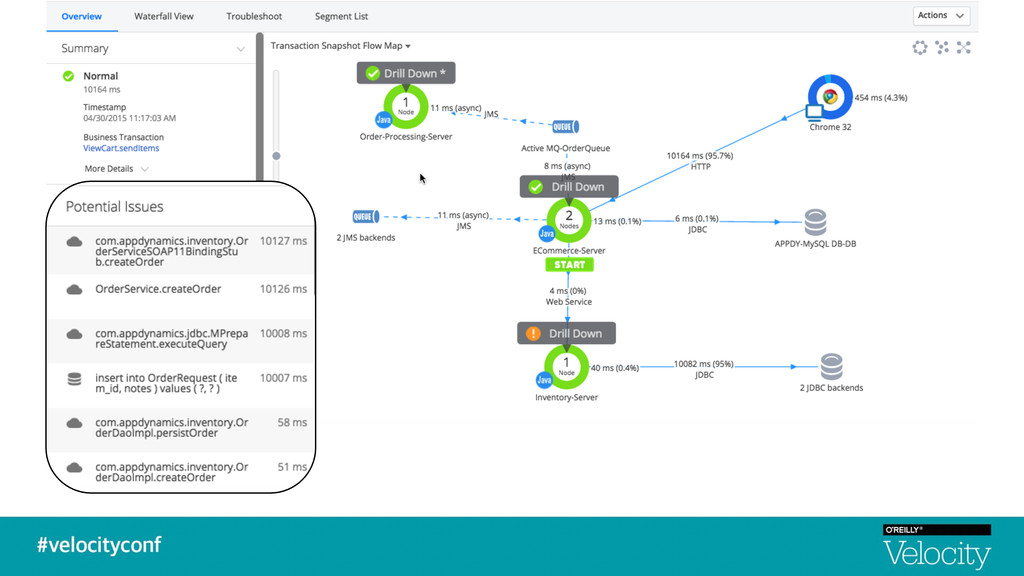
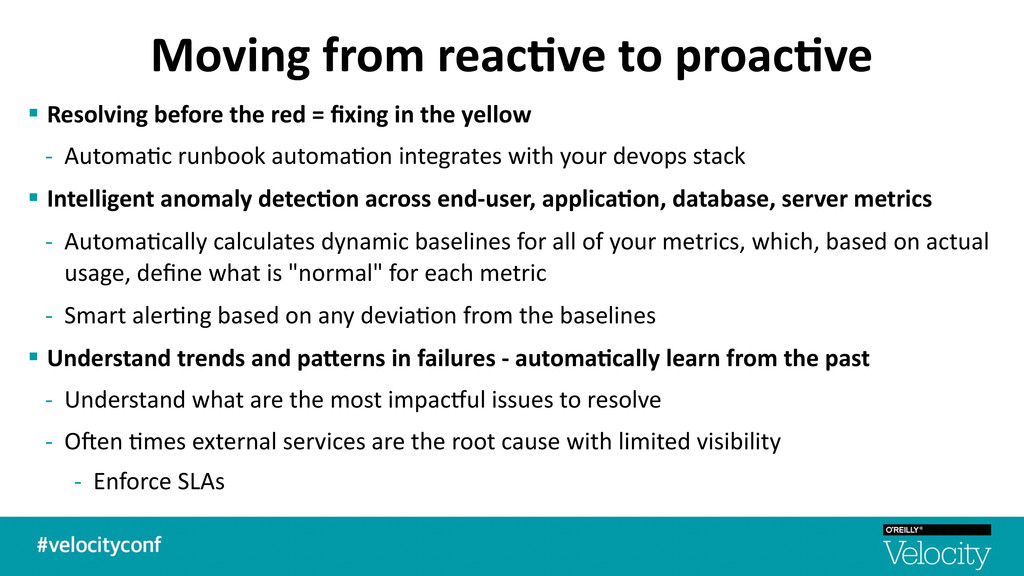
= fixing in the yellow -‐ Automa$c runbook automa$on integrates with your devops stack § Intelligent anomaly detec7on across end-‐user, applica7on, database, server metrics -‐ Automa$cally calculates dynamic baselines for all of your metrics, which, based on actual usage, define what is "normal" for each metric -‐ Smart aler$ng based on any devia$on from the baselines § Understand trends and pa=erns in failures -‐ automa7cally learn from the past -‐ Understand what are the most impacaul issues to resolve -‐ Ocen $mes external services are the root cause with limited visibility -‐ Enforce SLAs
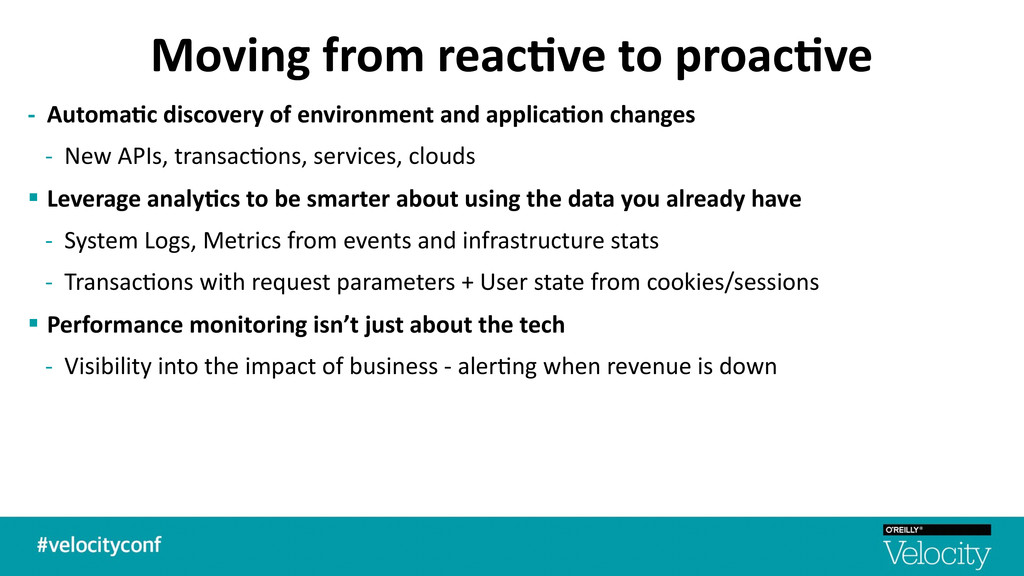
and applica7on changes -‐ New APIs, transac$ons, services, clouds § Leverage analy7cs to be smarter about using the data you already have -‐ System Logs, Metrics from events and infrastructure stats -‐ Transac$ons with request parameters + User state from cookies/sessions § Performance monitoring isn’t just about the tech -‐ Visibility into the impact of business -‐ aler$ng when revenue is down
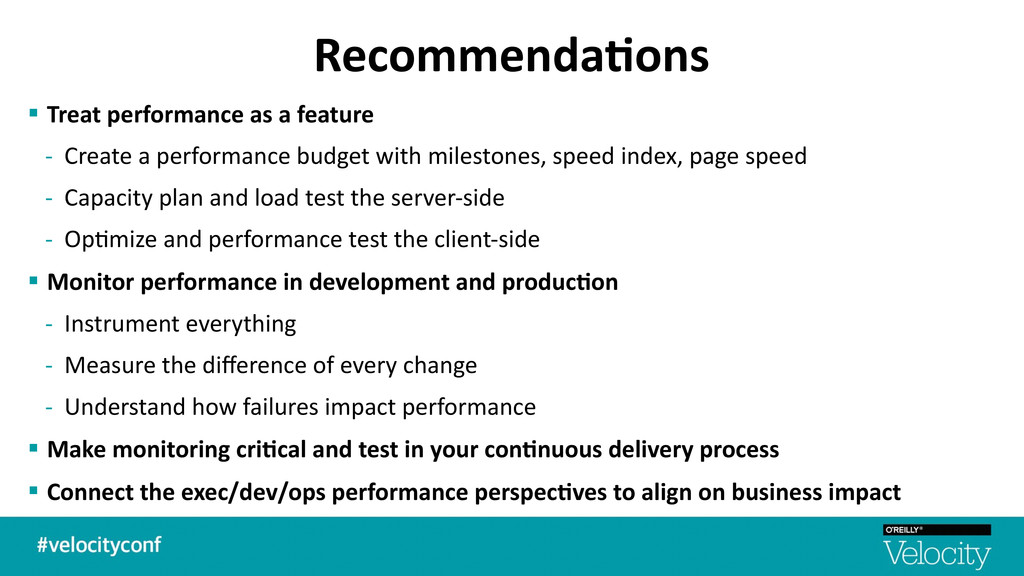
Create a performance budget with milestones, speed index, page speed -‐ Capacity plan and load test the server-‐side -‐ Op$mize and performance test the client-‐side § Monitor performance in development and produc7on -‐ Instrument everything -‐ Measure the difference of every change -‐ Understand how failures impact performance § Make monitoring cri7cal and test in your con7nuous delivery process § Connect the exec/dev/ops performance perspec7ves to align on business impact