Upgrade to Pro — share decks privately, control downloads, hide ads and more …

Factors for Consideration in Learning Analytics; Analysing Student Activity on the KLE to produce a more personalised and supportive system of education

Factors for Consideration in Learning Analytics; Analysing Student Activity on the KLE to produce a more personalised and supportive system of education

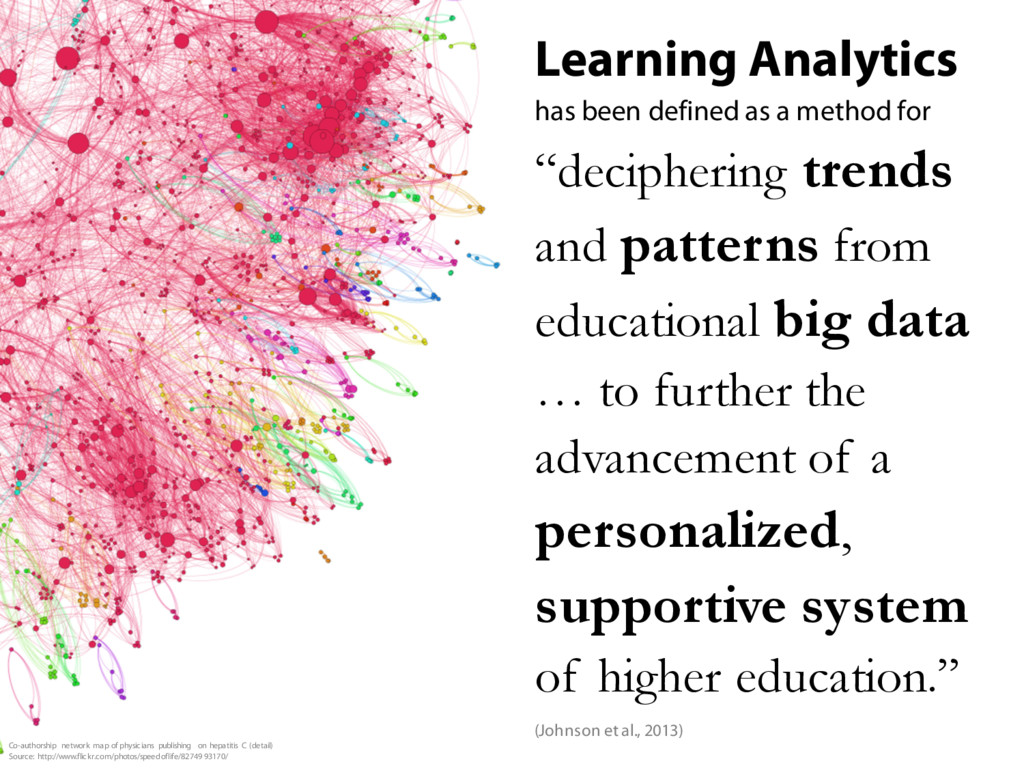
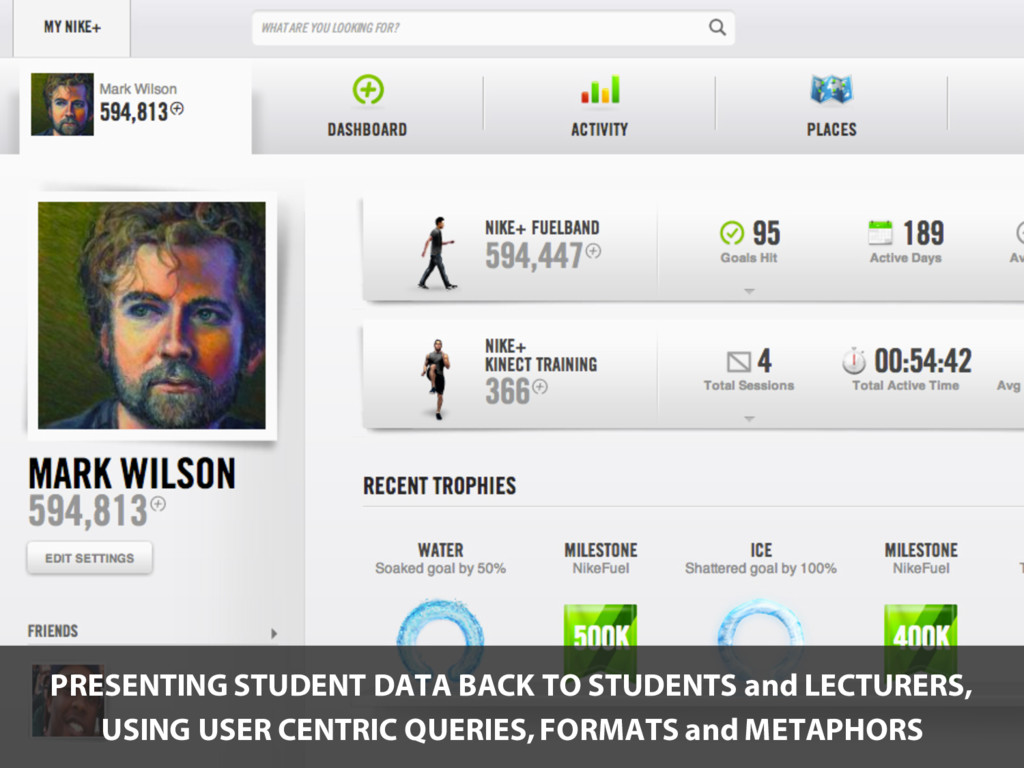
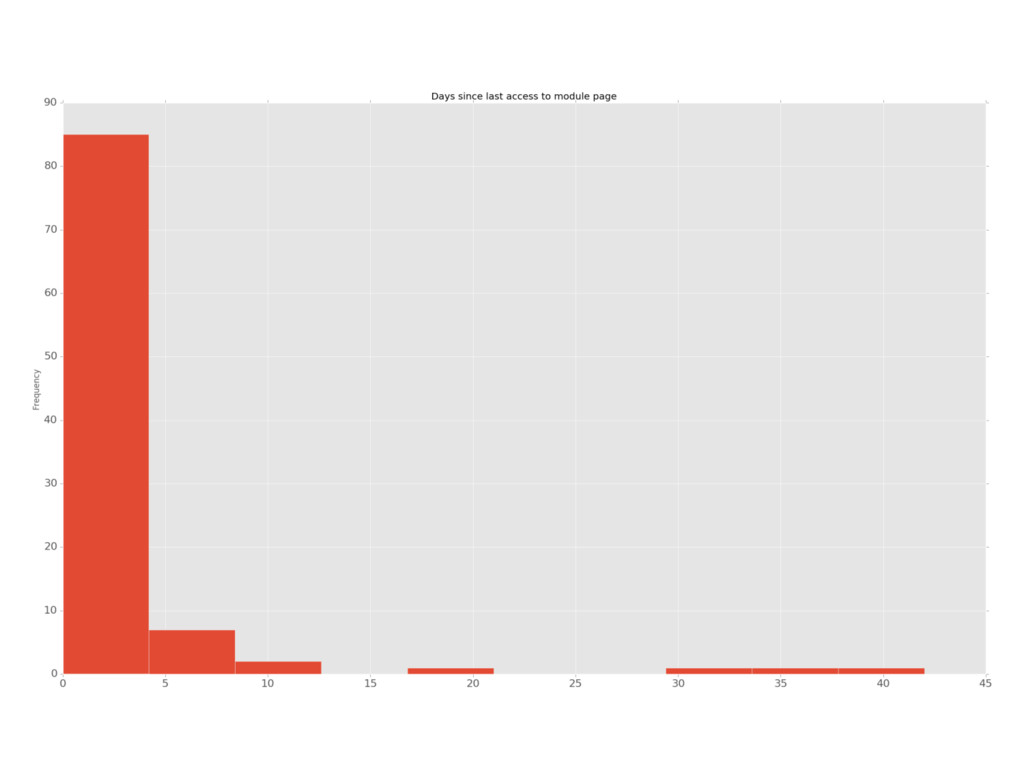
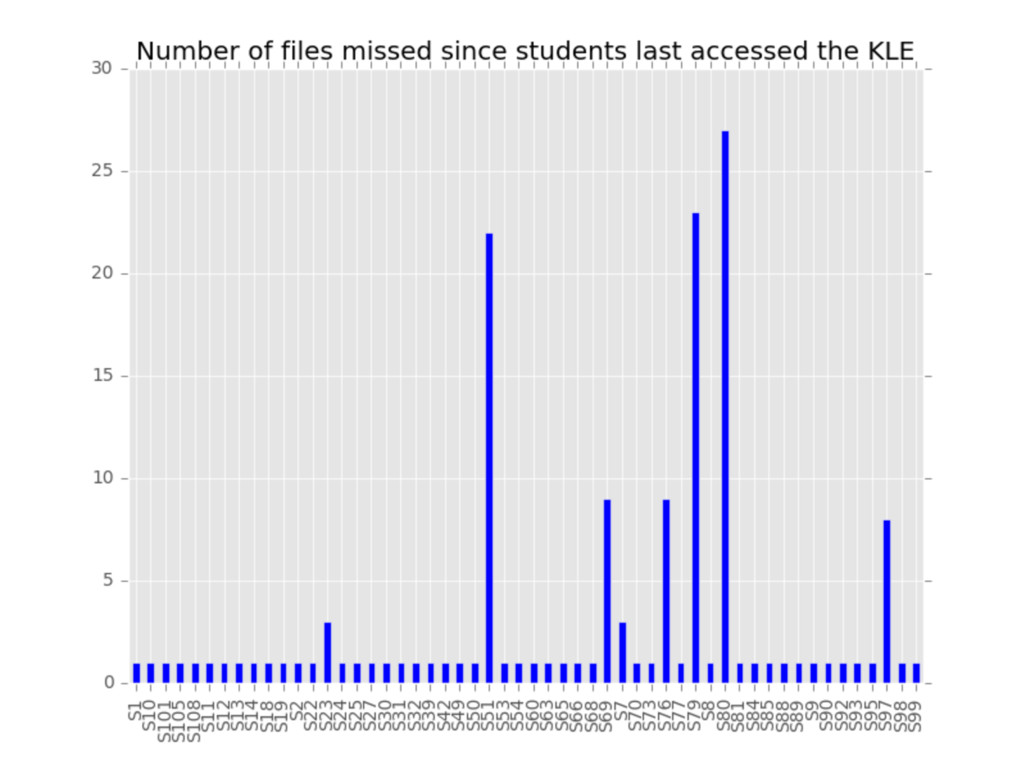
Traditionally a student's progress and level of engagement has been measured by assessment and physical attendance. However, in a student's day-to-day interactions with a University, other real-time measures are being generated e.g. VLE interaction. The analysis of this data has been termed Learning Analytics (LA). Following on from successful work at the University of Greenwich (de Quincey and Stoneham, 2014), this project aims to identify potential sources of data at Keele that are suitable for LA and how they can be used to produce a more personalised and supportive system of education, in the form of a Learner Dashboard.

Ed de Quincey

March 15, 2016
Tweet

More Decks by Ed de Quincey

Other Decks in Education

Transcript

  1. Factors for Consideration in Learning Analytics; Analysing Student Activity on

    the KLE to produce a more personalised and supportive system of education Dr Ed de Quincey, Dr Mark Turner, Dr Theo Kyriacou, Dr Nikki Williams School of Computing and Mathematics, KeeleUniversity Photo by GotCredit www.gotcredit.com
  2. TRADITIONALLY A STUDENT’S PROGRESS AND LEVEL OF ENGAGEMENT HAS BEEN

    MEASURED BY ASSESSMENT Photo by Alberto G. https://www.flickr.com/photos/albertogp123/5843577306
  3. HOW ELSE CAN WE MEASURE ENGAGEMENT AND PROGRESS IN REAL-TIME?

    Photos by Cropbot https://en.wikipedia.org/wiki/Lecture_hall#/media/File:5th_Floor_Lecture_Hall.jpg See-ming Lee https://www.flickr.com/photos/seeminglee/4556156477
  4. Learning Analytics has been defined as a method for “deciphering

    trends and patterns from educational big data … to further the advancement of a personalized, supportive system of higher education.” (Johnson et al., 2013) Co-authorship network map of physicians publishing on hepatitis C (detail) Source: http://www.flickr.com/photos/speedoflife/82749 93170/
  5. WP1. KLE Data Review A review of activity log data

    that are currently available via the KLE. ✓ ✖
  6. WP1. KLE Data Review A review of activity log data

    that are currently available via the KLE. ✓ ✖ Around 11 “reports” available 9 Course Reports, a Performance Dashboard and a Retention Centre Inconsistent formats Reports take a long time to run No way to bulk download all “raw” data Single Course User Participation Report is the most useful BUT have to run for each student
  7. WP1. KLE Data Review (and WP2. LA Pilot Study) A

    set of log files, generated from previous KLE module activity. ✖ ✖ Data Persistence Logs deleted after 6 months Data Protection/Usage Policy Current policies do not cover usage for Learning Analytics
  8. Review of Existing Systems Few systems available for general use

    ✖ Primarily targeted at educators. Only 5 of the 22 systems being designed purely for use by students Only 4 of the studies gathered the requirements for the systems directly from students Currently analysing visualisation techniques used and types/sources of data used
  9. WP3. Requirements Gathering Set as Coursework Case Study Contextual Interviews

    with staff 2nd Year Computing Module 84 students in 14 groups Asked questions as they complete tasks on the KLE 2 completed so far
  10. WP3. Requirements Gathering Preliminary results from Thematic Analysis of key

    features students said the dashboard should include: Students want an overview of their activity/learningi.e. everything one place Comparison to average seems important Common metaphor was a timeline/calendari.e. students wanting a way of showing their progress against deadlines Common functionality was support for (Instant) Messaging/ Discussion
  11. 'My Timeline': Past events which have been completed successfully provide

    gratification to the user in the form of positive icons such as thumbs up or smiley faces. The past timeline balances with the upcoming events to try and alleviate future workload stress by demonstrating positive success at the same time.
  12. Digital Synchable Diary: The diary can be edited and synced

    to various devices; A countdown system to exams and assignments; The ability for students to set prioritiesto set work.
  13. Course/Module Progress Bar: a progress bar based upon the how

    far in the course users are. Indicating how much of the course they should know and how much time is left until the course finishes.
  14. Score Indicator: The score indicator is a metric derived from

    an algorithm which would track a student’s engagement with course materials and other important areas of engagement that students should be utilising (comments,discussion).
  15. Comparison with peers: The chance for the user to see

    how they are comparing with the top 20% of the class and how they are doing comparedwith the average mark.
  16. Goals and Trophies: The student will get a list of

    goals or tasks sent to their dashboard and there they can also add more tasks of their own.
  17. News Feed: An aggregated news feed is a pattern followed

    on many major platforms, and provides a intuitive way to group content into a digestible stream of informationfrom multiplesources (modules).
  18. Discussion Forum: An open forum within the learning dashboard application,

    to allow students to post questions about specific issues related to their course or to materials, and for staff to then see where collective issues were found
  19. WP3. Requirements Gathering Contextual Interviews with staff • Accesses does

    not necessarily mean engagement. • Only interested in low values e.g. not accessed for a long time. • Current inaccurate Dashboard and the Retention Centre alerts makes people feel less trustful of the data. • Information in current reports interesting rather than being useful. • Comparison against average values (for a module/class) is important as it provides context to the data, otherwise it is not clear what is 'good' or 'bad'. • The reports need to be easy and quick to run/use. • No easily accessible method for seeing a student’s overall level of interaction on all modules
  20. WP4. Implementation of Prototype LA Dashboard WP5. Pilot Study into

    uses of LA Dashboard within a Module Python programme that utilises 2 reports to calculate files uploaded since last login