Upgrade to Pro — share decks privately, control downloads, hide ads and more …

Linux Systems Tools For PHP Debugging and Perfo...

Linux Systems Tools For PHP Debugging and Performance

FrOSCon 2023 - https://froscon.org

Avatar for Volker Dusch

Volker Dusch

August 05, 2023
Tweet

More Decks by Volker Dusch

Other Decks in Technology

Transcript

  1. Hi

  2. Our story for today Our monitoring found a problem Queue

    entries are not getting processed One of your workers is sometimes running into some sort of busy loop
  3. Our story for today Our monitoring found a problem Queue

    entries are not getting processed One of your workers is sometimes running into some sort of busy loop 100% CPU usage, unresponsive PHP process
  4. Our story for today Our monitoring found a problem Queue

    entries are not getting processed One of your workers is sometimes running into some sort of busy loop 100% CPU usage, unresponsive PHP process What now?
  5. Our story for today Our monitoring found a problem Queue

    entries are not getting processed One of your workers is sometimes running into some sort of busy loop 100% CPU usage, unresponsive PHP process What now? In this process we'll explore tools that can help you along the way.
  6. About me Nearly 20 years of PHP I work on

    web applications with long life cycles
  7. About me Nearly 20 years of PHP I work on

    web applications with long life cycles Happily working at @Tideways - But that's not what the talk is about
  8. About me Nearly 20 years of PHP I work on

    web applications with long life cycles Happily working at @Tideways - But that's not what the talk is about Manager and "Full Stack" Engineer
  9. "Full Stack" Nothing is someone else's problem I might not

    know how it works But I'm sure we can fix it
  10. top top - 21:48:05 up 50 days, 20:32, 1 user,

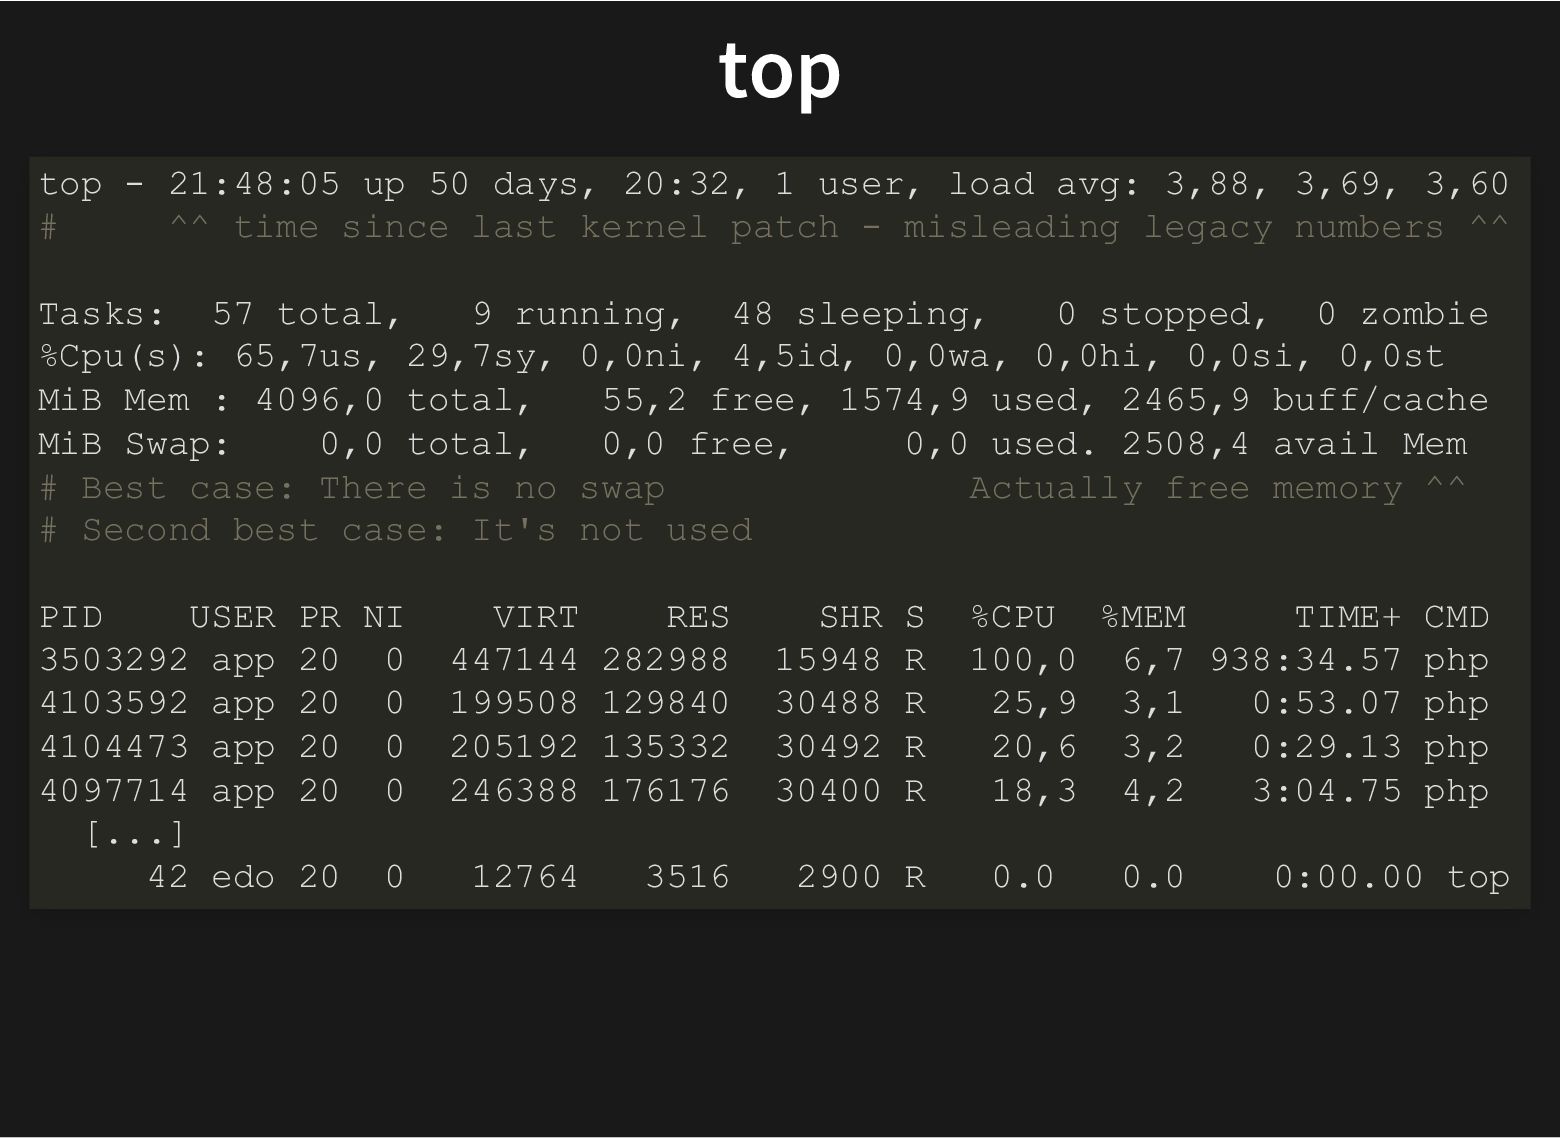
    load avg: 3,88, 3,69, 3,60 # ^^ time since last kernel patch - misleading legacy numbers ^^ Tasks: 57 total, 9 running, 48 sleeping, 0 stopped, 0 zombie %Cpu(s): 65,7us, 29,7sy, 0,0ni, 4,5id, 0,0wa, 0,0hi, 0,0si, 0,0st MiB Mem : 4096,0 total, 55,2 free, 1574,9 used, 2465,9 buff/cache MiB Swap: 0,0 total, 0,0 free, 0,0 used. 2508,4 avail Mem # Best case: There is no swap Actually free memory ^^ # Second best case: It's not used PID USER PR NI VIRT RES SHR S %CPU %MEM TIME+ CMD 3503292 app 20 0 447144 282988 15948 R 100,0 6,7 938:34.57 php 4103592 app 20 0 199508 129840 30488 R 25,9 3,1 0:53.07 php 4104473 app 20 0 205192 135332 30492 R 20,6 3,2 0:29.13 php 4097714 app 20 0 246388 176176 30400 R 18,3 4,2 3:04.75 php [...] 42 edo 20 0 12764 3516 2900 R 0.0 0.0 0:00.00 top
  11. ps ProcesS We see a worker process fully occupying one

    core. ps faxwu USER PID %CPU %MEM VSZ RSS START TIME COMMAND root 268 0.0 0.0 8720 116 Jun07 0:01 nginx: master www 269 0.0 0.0 9332 904 Jun07 0:03 \_ nginx: worker worker 274 1.1 0.4 32848 19180 Jun07 175:39 supervisord worker 3503292 87.1 6.7 447144 282988 02:15 938:39 \_php [..] // ^^ Process ID --- 15.6 hours of CPU usage ^^ worker 288561 4.4 2.4 179988 103044 01:42 0:56 \_php [..] f full-format a All users x Also processes without a tty w Wide output - See the full command u User-oriented format ("Useful")
  12. ss - The new netstat Socket Statistics Our process is

    in CLOSE-WAIT ?! ss -tnap State Recv-Q Send-Q Local Addr:Port Peer Addr:Port Process ESTAB 0 0 10.4.2.42:47864 10.4.2.38:3306 users:(("p ESTAB 0 0 10.4.2.42:49598 10.4.2.38:3306 users:(("p ESTAB 0 0 10.4.2.42:54508 10.4.2.44:9200 users:(("p ESTAB 0 79 10.4.2.42:43018 10.4.2.45:6379 users:(("p CLOSE-WAIT 1 0 10.4.2.42:33622 10.4.2.35:80 users:(("p -t --tcp -a --all Also show listening sockets -n --numeric Don't resolve host names! -p --proccess Show the process using the socket
  13. TCP

  14. CLOSE_WAIT In short: CLOSE_WAIT means the other side closed the

    socket and we didn't react yet. Or something is wrong.
  15. lsof LiSt Open Files sudo lsof -Pnp 3503292 | grep

    -v ".so" COMMAND PID FD TYPE NAME php 3503292 cwd DIR / php 3503292 rtd DIR / php 3503292 txt REG /usr/bin/php8.1 php 3503292 mem REG /usr/lib/locale/locale-archive php 3503292 mem REG /usr/lib/locale/C.UTF-8/LC_CTYPE php 3503292 mem REG /usr/lib/x86_64-linux-gnu/gconv/gconv-modules php 3503292 4u unix type=STREAM php 3503292 5u unix type=STREAM php 3503292 9u IPv4 10.4.2.42:33622->10.4.2.35:80 (CLOSE_WAIT) php 3503292 16u unix type=DGRAM -n No hostname resolution -P Print port numbers instead of mappings from `/etc/services` -p Process Id
  16. We found something! Why is this http connection waiting to

    be closed? Rerunning lsof doesn't seem to change anything. Let's see what's going on with strace. lsof -Pnp 3503292 | grep CLOSE_WAIT 10.4.2.42:33622->10.4.2.35:80 (CLOSE_WAIT) lsof -p 3503292 | grep CLOSE_WAIT worker.example.org:33622->service.example.org:http (CLOSE_WAIT)
  17. stderred It can be hard to figure out what's strace

    output and what's program output. https://github.com/sickill/stderred cat stderred.php
  18. Basic usage strace -fttp $pid Demo -f --follow-forks - Usually

    doesn't happen in PHP, but just in case -tt --absolute-timestamps=precision:us Readable high precision time -p --attach=pid - Process Id strace php simple-reproduce.php
  19. Strace by example Strace can also start a program -

    So we can trace from the start strace php strace-demo.php |& less
  20. Color patch for strace That's a lot! Let's make it

    a bit more readable for the demo ~/private/strace/src/strace --color=always \ php strace-demo.php |& less -r https://github.com/xfgusta/strace-with-colors
  21. Continue investigating It keeps looping the following three lines Let's

    see what's going on. sudo strace -fttp 3503292 11:25:04.663911 rt_sigaction(SIGPIPE, NULL, {sa_handler=SIG_IGN, sa_m 11:25:04.663974 rt_sigaction(SIGPIPE, {sa_handler=SIG_IGN, sa_mask=[P 11:25:04.664026 rt_sigaction(SIGPIPE, {sa_handler=SIG_IGN, sa_mask=[P
  22. Quickly inspecting the stack ProcFS For example: That's not enough.

    Let's use gdb. cat /proc/$pid/stack php -r 'sleep(10);' & cat /proc/$!/stack
  23. Intro to gdb Gnu DeBugger Attack to a running process

    Demo gdb -p $pid gdb php simple-reproduce.php r run s step bt backtrace
  24. Our example process sudo gdb -p 3503292 bt (gdb) bt

    #0 0x00007f763229e166 in ?? () from /lib/x86_64-linux-gnu/libc.so.6 #1 0x00007f762fc01ea5 in ?? () from /usr/lib/x86_64-linux-gnu/libcur #2 0x00007f762fc02a42 in ?? () from /usr/lib/x86_64-linux-gnu/libcur #3 0x00007f762fbeda5e in curl_share_cleanup () from /usr/lib/x86_64- #4 0x00007f762fc5d1f1 in ?? () from /usr/lib/php/20210902/curl.so #5 0x00005639ac7da6d3 in zend_objects_store_free_object_storage () #6 0x00005639ac7399ca in zend_shutdown_executor_values () #7 0x00005639ac739e43 in ?? () #8 0x00005639ac749d63 in zend_deactivate () #9 0x00005639ac6e5bf6 in php_request_shutdown () #10 0x00005639ac831bb0 in ?? () #11 0x00005639ac588f48 in ?? () #12 0x00007f763227f083 in __libc_start_main () from /lib/x86_64-linux #13 0x00005639ac58971e in _start ()
  25. ?? Symbols Symbols tell your debugger which memory address has

    which name Debian With Ondřej:ppa apt install php8.2-phpdbg # /etc/apt/sources.list.d/ondrej-ubuntu-php-jammy.list deb https://ppa.launchpadcontent.net/ondrej/php/ubuntu/ jammy main # just append "main/debug" apt update apt install php8.2-cli-dbgsym
  26. Once again with symbols (gdb) bt #0 0x00007fbfef531166 in __GI___libc_sigaction

    (sig=sig@entry=13, ac #1 0x00007fbfef531299 in __GI___sigaction (sig=sig@entry=13, act=act #2 0x00007fbfece84f2a in sigpipe_ignore (ig=ig@entry=0x7ffd98161340, #3 0x00007fbfece85a42 in sigpipe_ignore (ig=0x7ffd98161340, data=<op #4 Curl_conncache_close_all_connections (connc=connc@entry=0x55863df #5 0x00007fbfece70a5e in curl_share_cleanup (share=0x55863df2b730) a #6 0x00007fbfed42e1f1 in curl_share_free_obj (object=0x7fbfe91c5ba8) #7 0x000055863c548833 in zend_objects_store_free_object_storage (obj #8 0x000055863c4a7b1a in zend_shutdown_executor_values (fast_shutdow #9 0x000055863c4a7f93 in shutdown_executor () at ./Zend/zend_execute #10 0x000055863c4b7eb3 in zend_deactivate () at ./Zend/zend.c:1271 #11 0x000055863c453c56 in php_request_shutdown (dummy=<optimized out> #12 0x000055863c59fd80 in do_cli (argc=10, argv=0x55863db55150) at ./ #13 0x000055863c2f6f68 in main (argc=10, argv=0x55863db55150) at ./sa
  27. Dynamic linker/loader We might not want to install a lib

    system-wide. LD_LIBRARY_PATH="/home/edo/curl-7.87.0/lib/.libs/" \ php -r 'var_dump(curl_version()["version"]);' string(10) "7.87.0-DEV" https://man7.org/linux/man-pages/man8/ld.so.8.html
  28. LD_DEBUG More things to do with ld.so LD_DEBUG=files php -v

    |& less LD_DEBUG=libs php -v |& grep curl
  29. ProcFS Process information, system information, and sysctl pseudo-filesystem php -r

    'sleep(1000);' & pid=$! ls -lash /proc/$pid/fd/ ls -lash /proc/$pid/exe ls -lash /proc/$pid/cwd cat /proc/$pid/cmdline | tr '\0' ' ' cat /proc/$pid/environ | tr '\0' '\n' cat /proc/$pid/syscall https://github.com/torvalds/linux/blob/master/arch/x86/entry/syscalls/syscall_64.tbl curl https://raw.githubusercontent.com/torvalds/linux/\ master/arch/x86/entry/syscalls/syscall_64.tbl | grep $number grep $number /usr/include/x86_64-linux-gnu/asm/unistd_64.h
  30. Perf record perf record -F 9999 -g php perf.php perf

    report -g graph --no-children --sort=dso php -v https://brendangregg.com/linuxperf.html
  31. Flame Graph Search test_bu.. x.. d.. s.. gener.. S.. _..

    unary_.. execute_command_internal x.. bash shell_expand_word_list red.. execute_builtin __xst.. __dup2 main _.. do_redirection_internal do_redirections do_f.. ext4_f.. __GI___li.. __.. expand_word_list_internal unary_.. expan.. tra.. path.. execute_command two_ar.. cleanup_redi.. execute_command do_sy.. trac.. __GI___libc_.. posixt.. execute_builtin_or_function _.. [unknown] tra.. expand_word_internal _.. tracesys ex.. _.. vfs_write c.. test_co.. e.. u.. v.. SY.. i.. execute_simple_command execute_command_internal p.. gl.. s.. sys_write __GI___l.. expand_words d.. __libc_start_main d.. do_sync.. generi.. e.. reader_loop sy.. execute_while_command do_redirecti.. sys_o.. g.. __gene.. __xsta.. tracesys c.. _.. execute_while_or_until
  32. FlameGraphs from perf perf script > out.stacks ~/private/FlameGraph/stackcollapse-perf.pl out.stacks |

    ~/private/Fla ~/private/FlameGraph/stackcollapse-perf.pl out.stacks | grep tideways ~/private/FlameGraph/stackcollapse-perf.pl out.stacks | grep xdebug |
  33. Thank you Slides will be at I sometimes talk PHP

    on Mastodon @edorian.phpc.social https://speakerdeck.com/edorian