Upgrade to Pro — share decks privately, control downloads, hide ads and more …

eBPF Can Do It! A Deep Dive into Real-World PHP...

Avatar for Sohei Iwahori Sohei Iwahori
September 11, 2026

eBPF Can Do It! A Deep Dive into Real-World PHP Issues Solved with eBPF

Avatar for Sohei Iwahori

Sohei Iwahori

September 11, 2026

More Decks by Sohei Iwahori

Other Decks in Technology

Transcript

  1. eBPF Can Do It! A Deep Dive into Real-World PHP

    Issues Solved with eBPF 2026/09/11 PHP×Tokyo September 2026 Sohei Iwahori (GREE, Inc.)
  2. About Me • Sohei Iwahori • X/bsky/GitHub: @egmc • Senior

    Lead Engineer at GREE, Inc. • • Leading Monitoring Unit Community • eBPF Japan Meetup
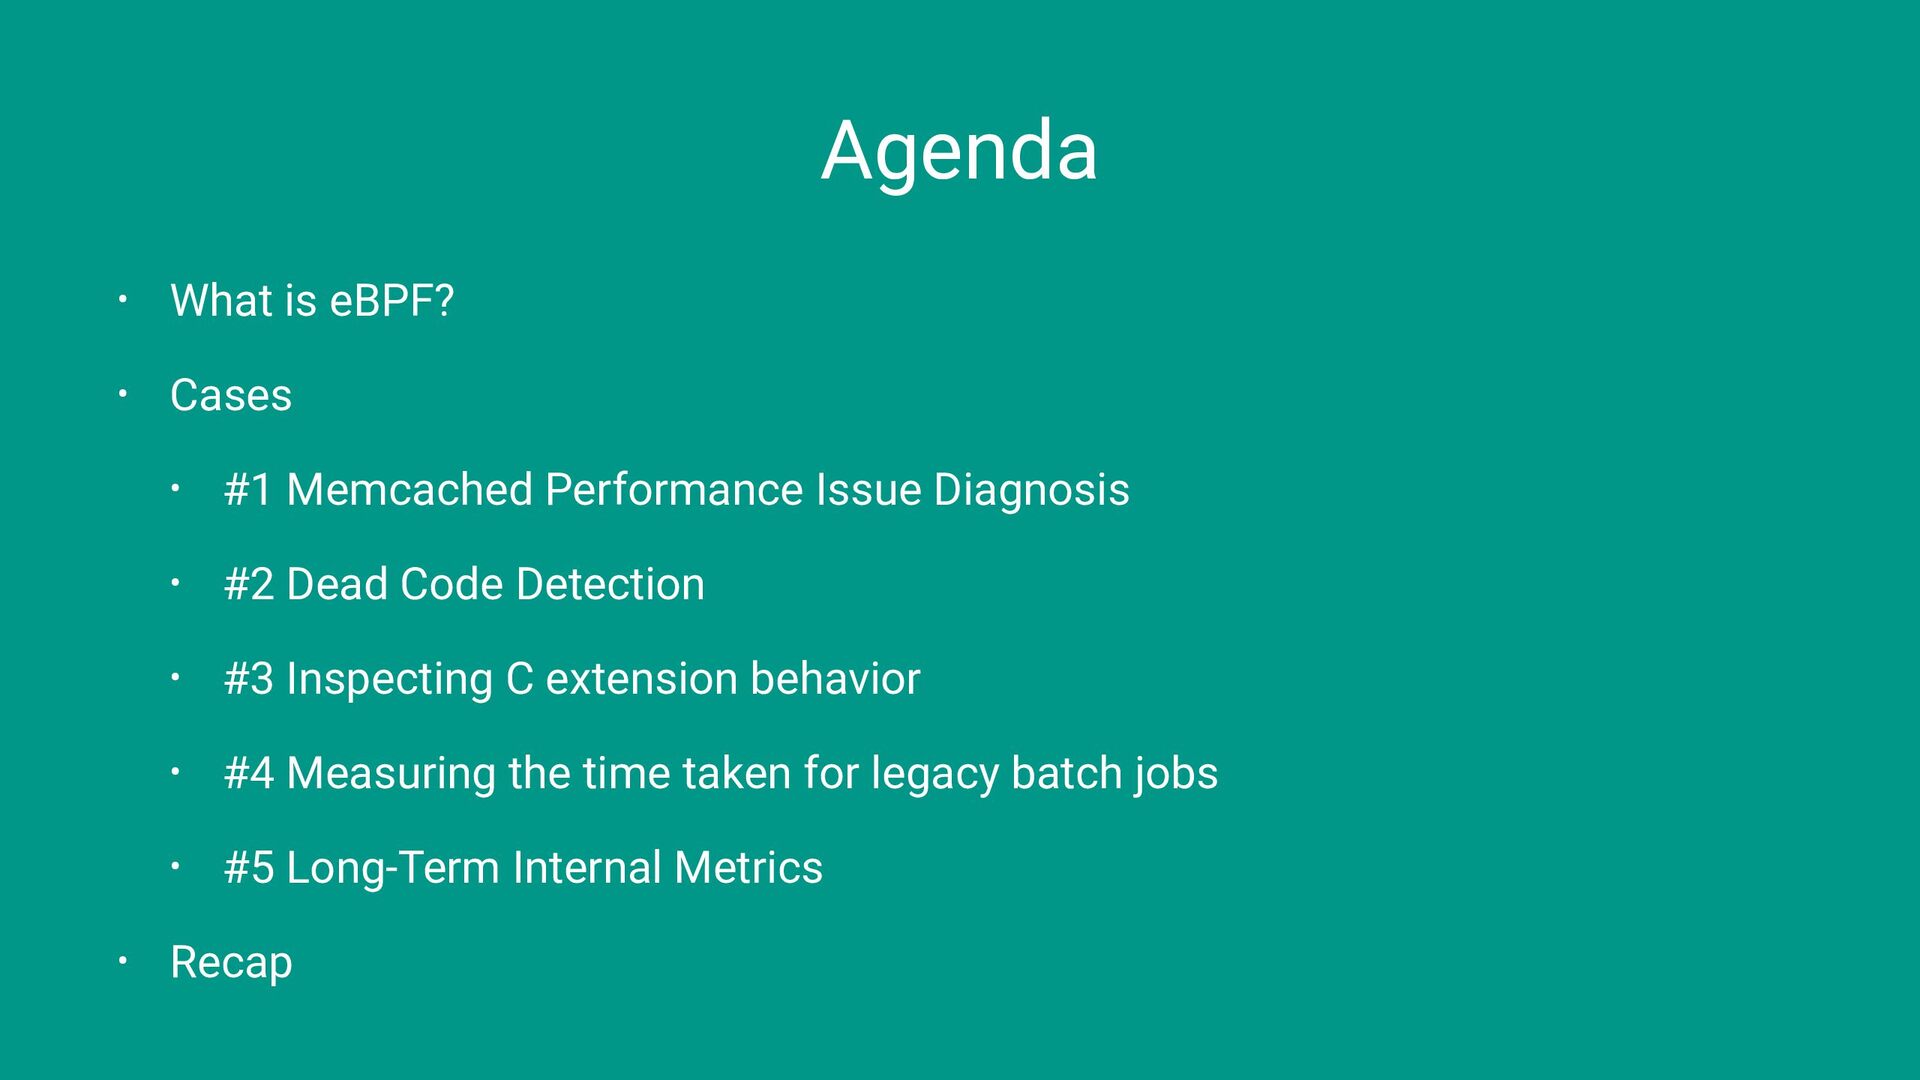
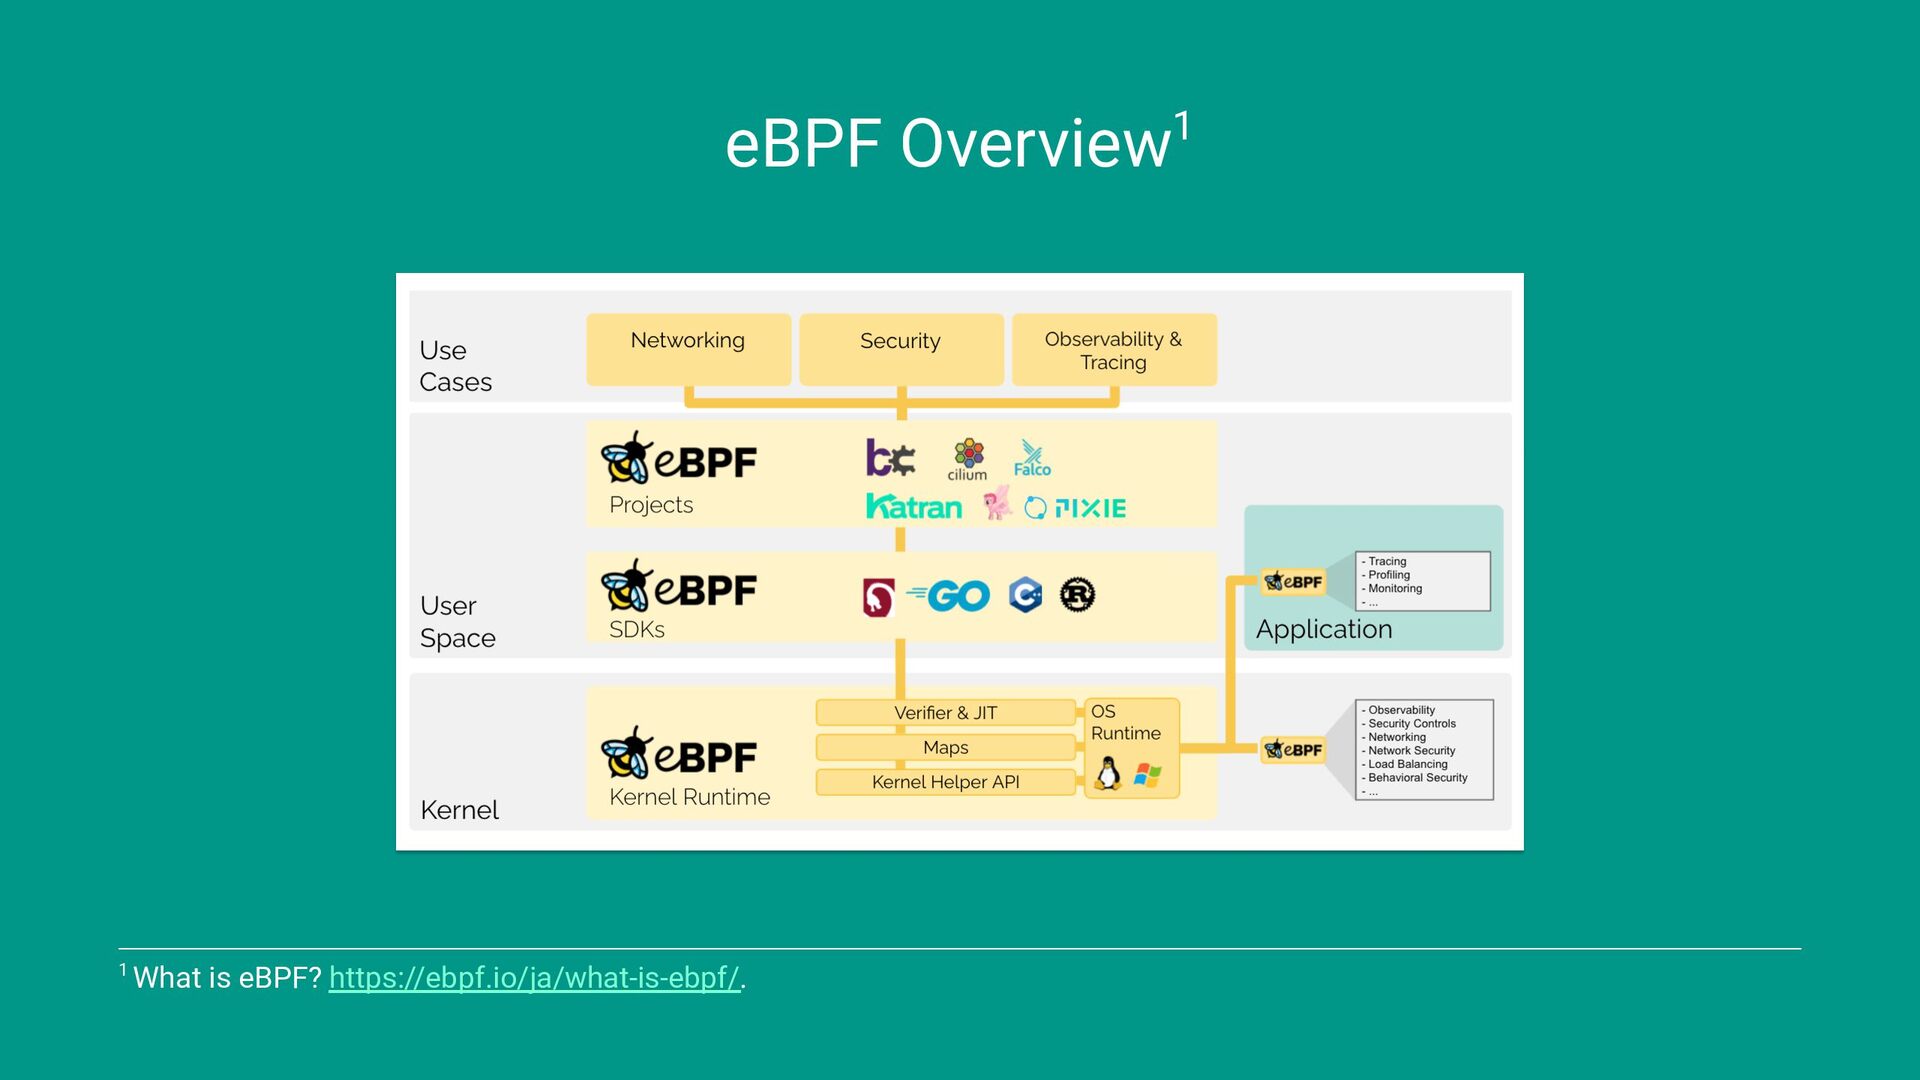
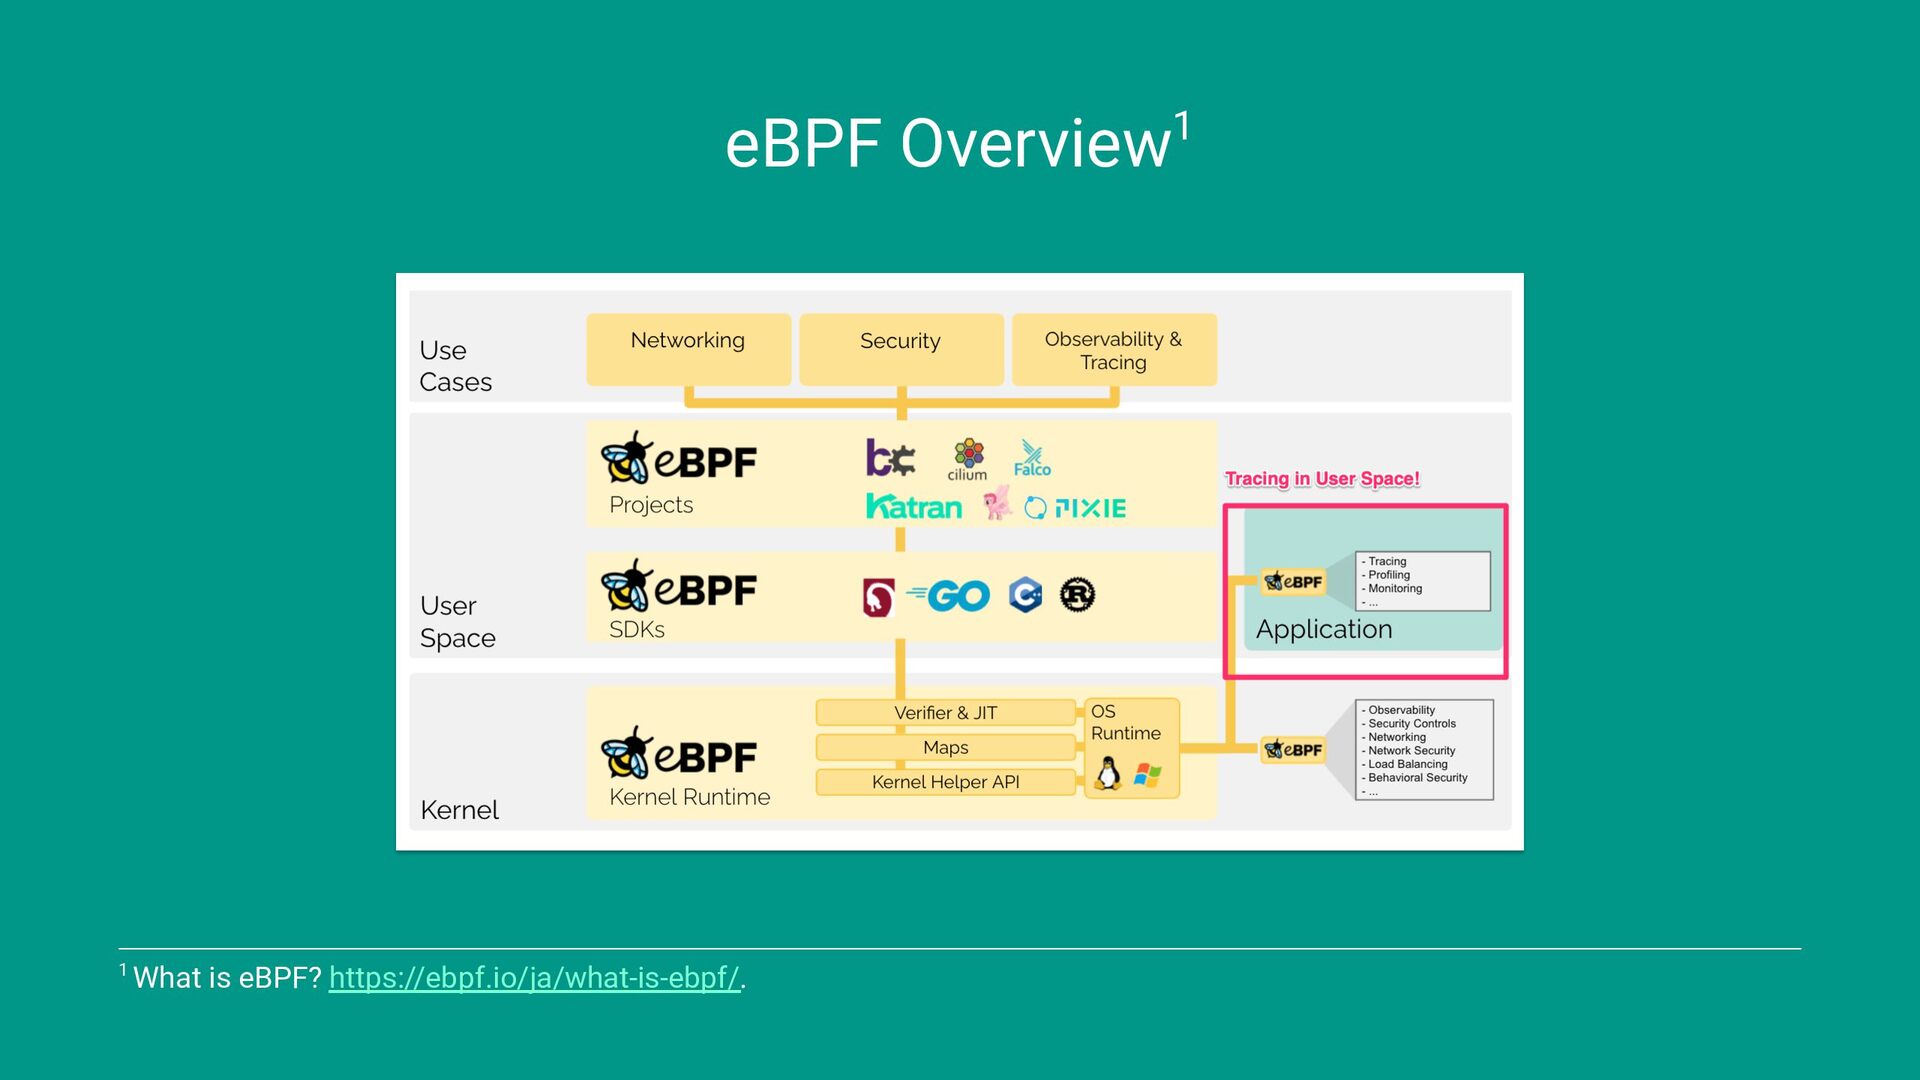
  3. Agenda • What is eBPF? • Cases • • #1

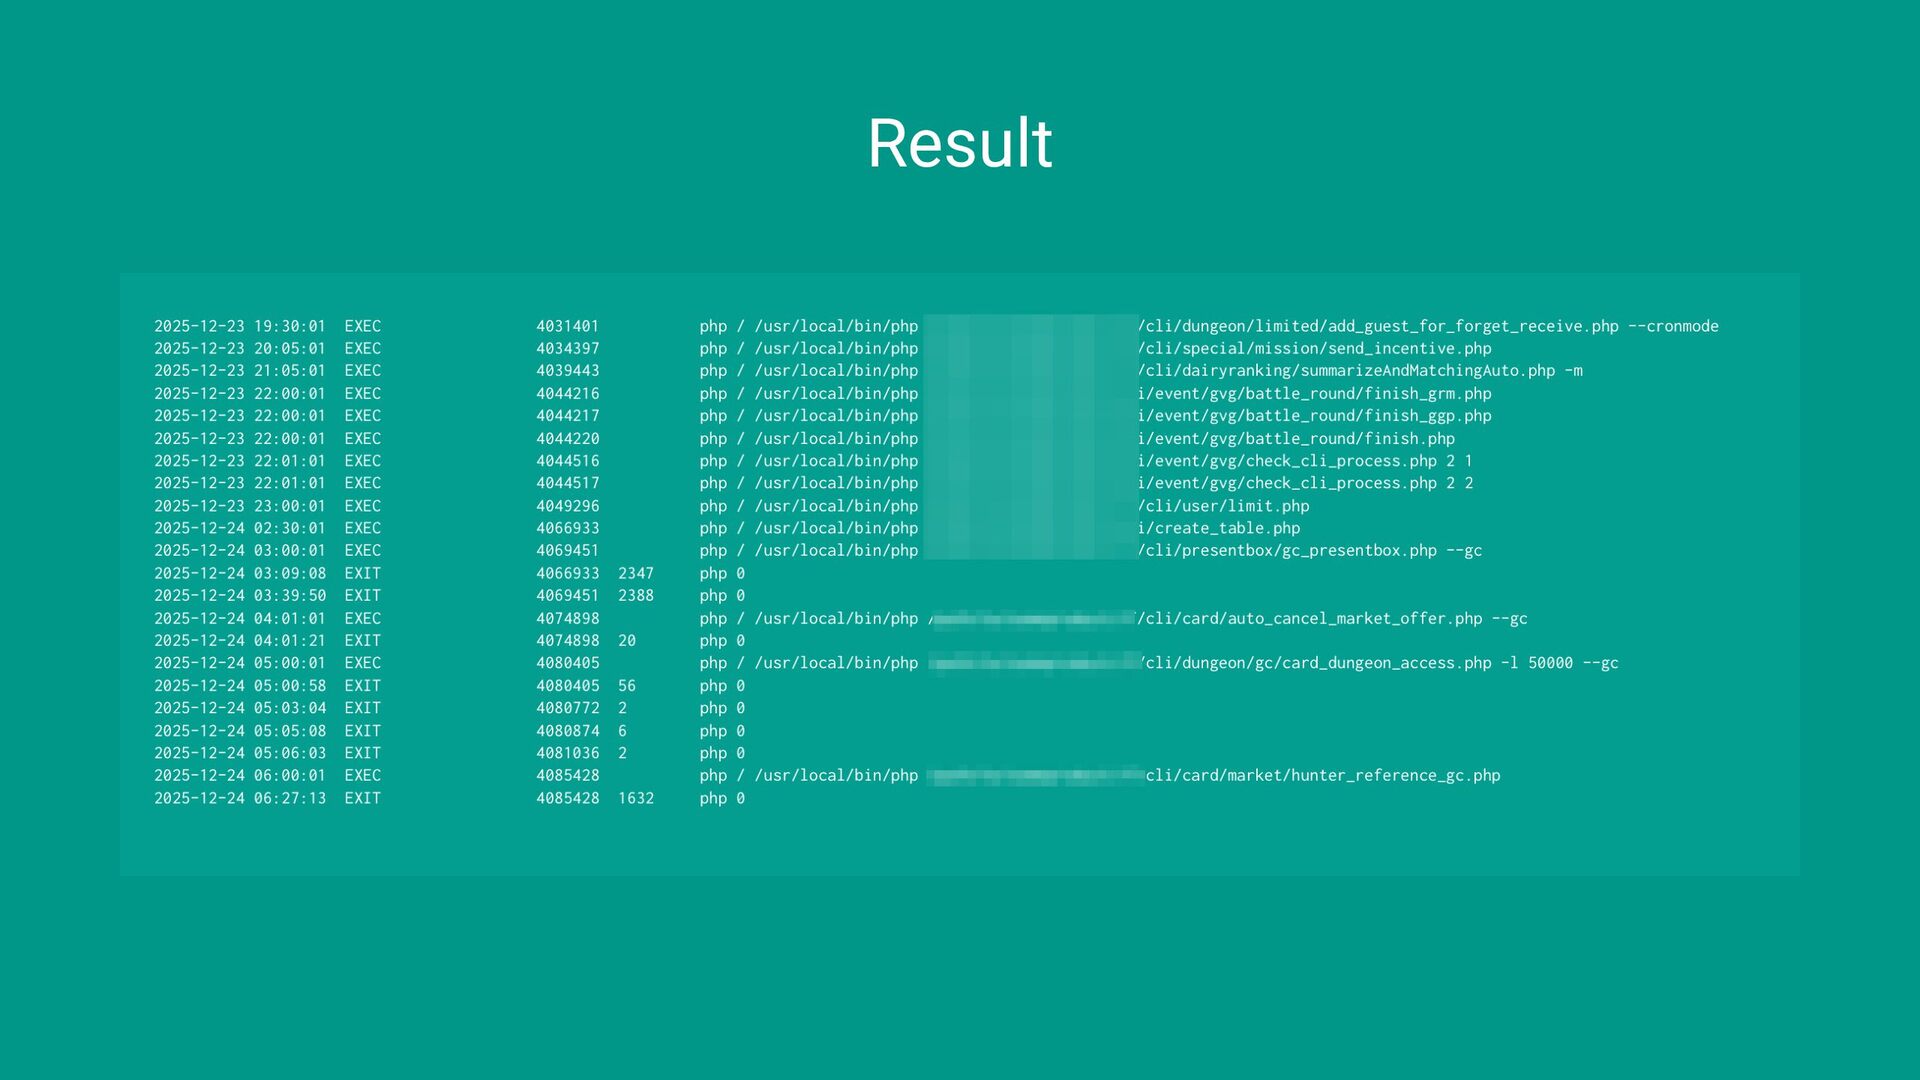
    Memcached Performance Issue Diagnosis • #2 Dead Code Detection • #3 Inspecting C extension behavior • #4 Measuring the time taken for legacy batch jobs • #5 Long-Term Internal Metrics Recap
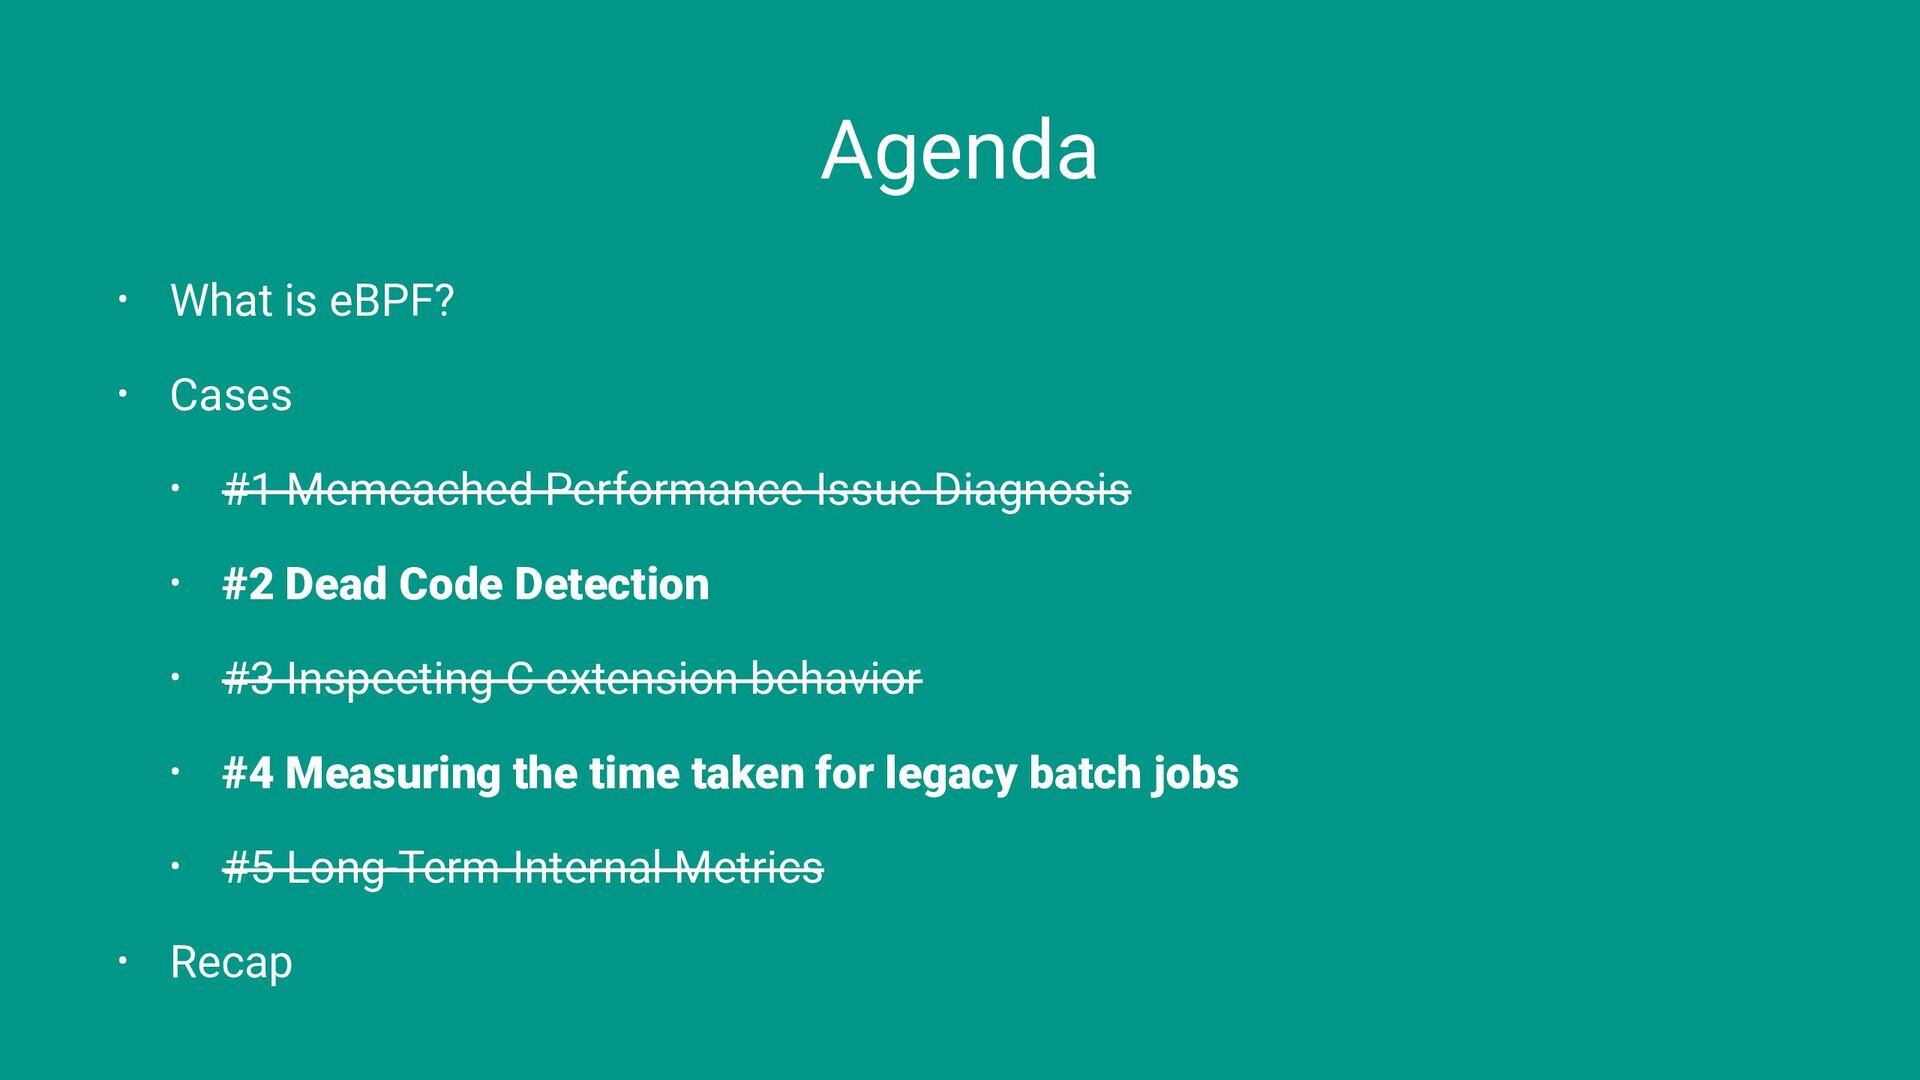
  4. Agenda • What is eBPF? • Cases • • #1

    Memcached Performance Issue Diagnosis • #2 Dead Code Detection • #3 Inspecting C extension behavior • #4 Measuring the time taken for legacy batch jobs • #5 Long-Term Internal Metrics Recap
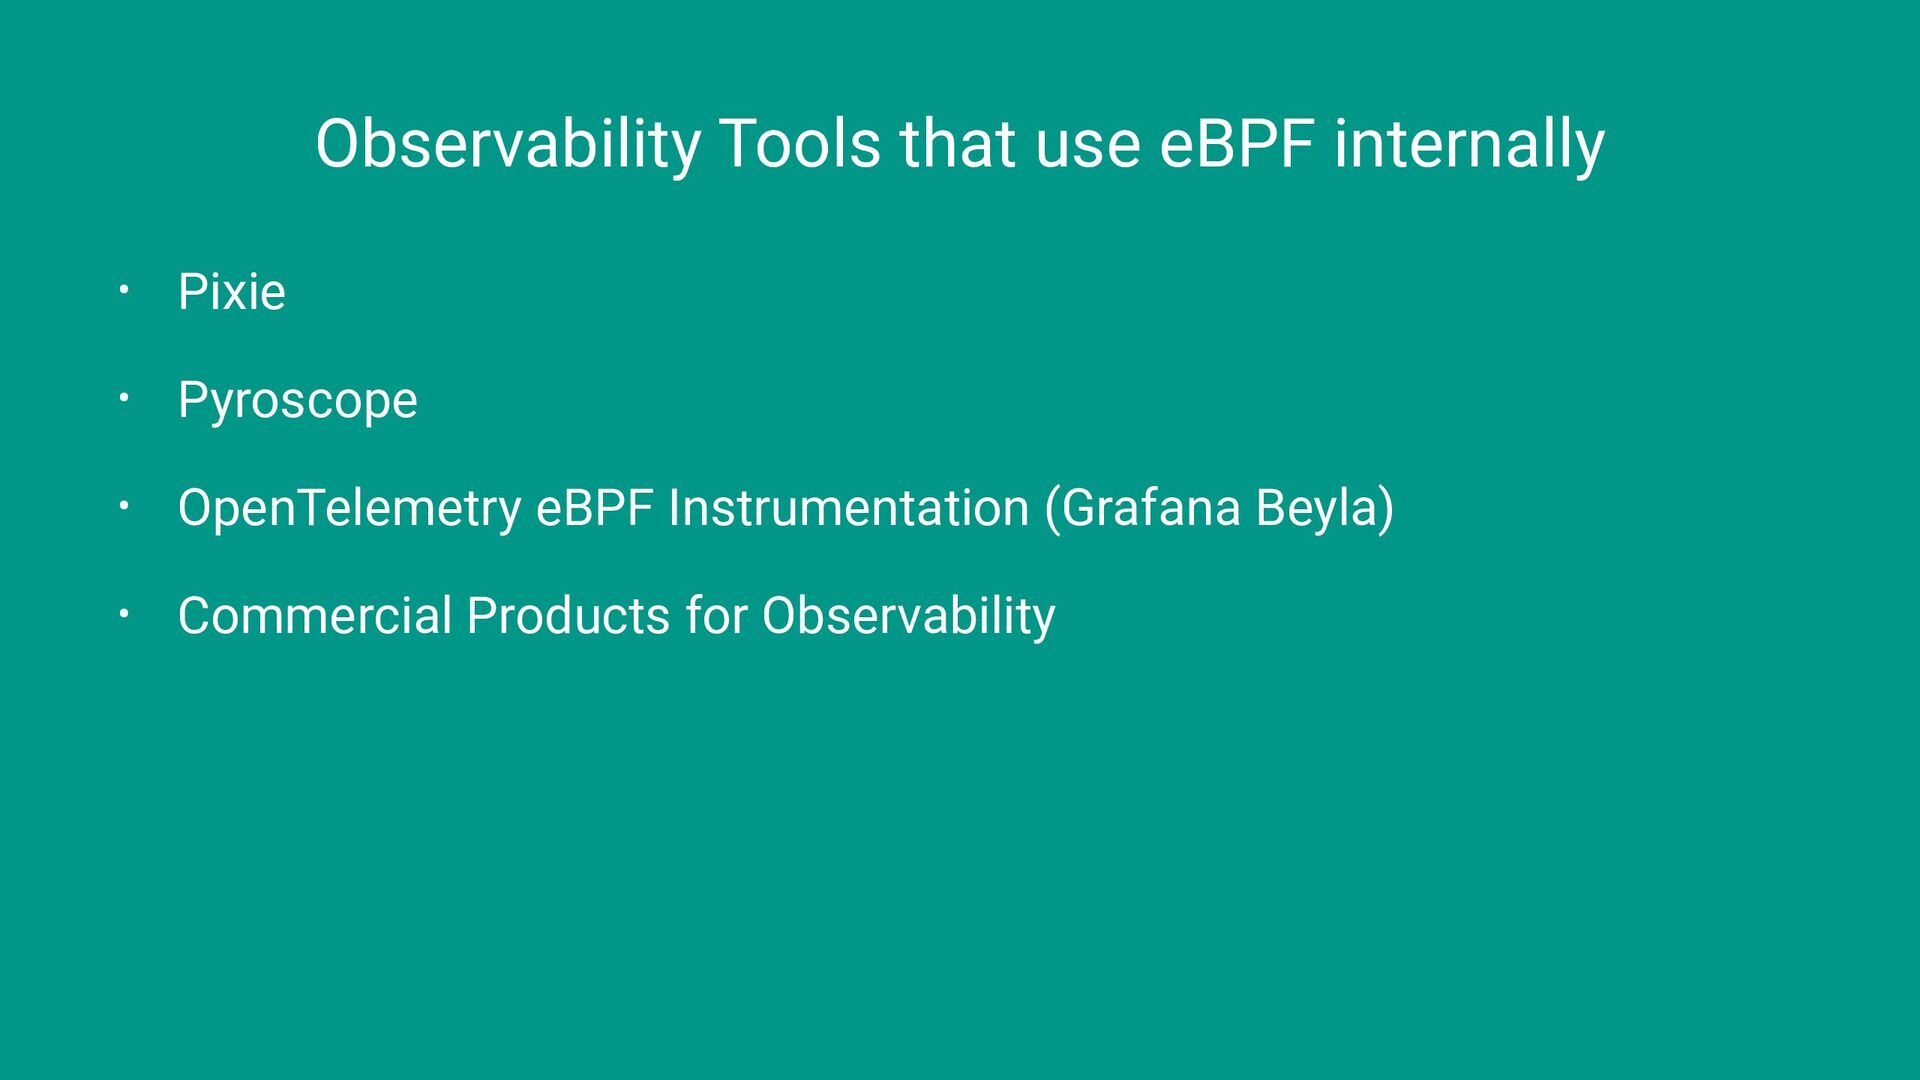
  5. Observability Tools that use eBPF internally • Pixie • Pyroscope

    • OpenTelemetry eBPF Instrumentation (Grafana Beyla) • Commercial Products for Observability
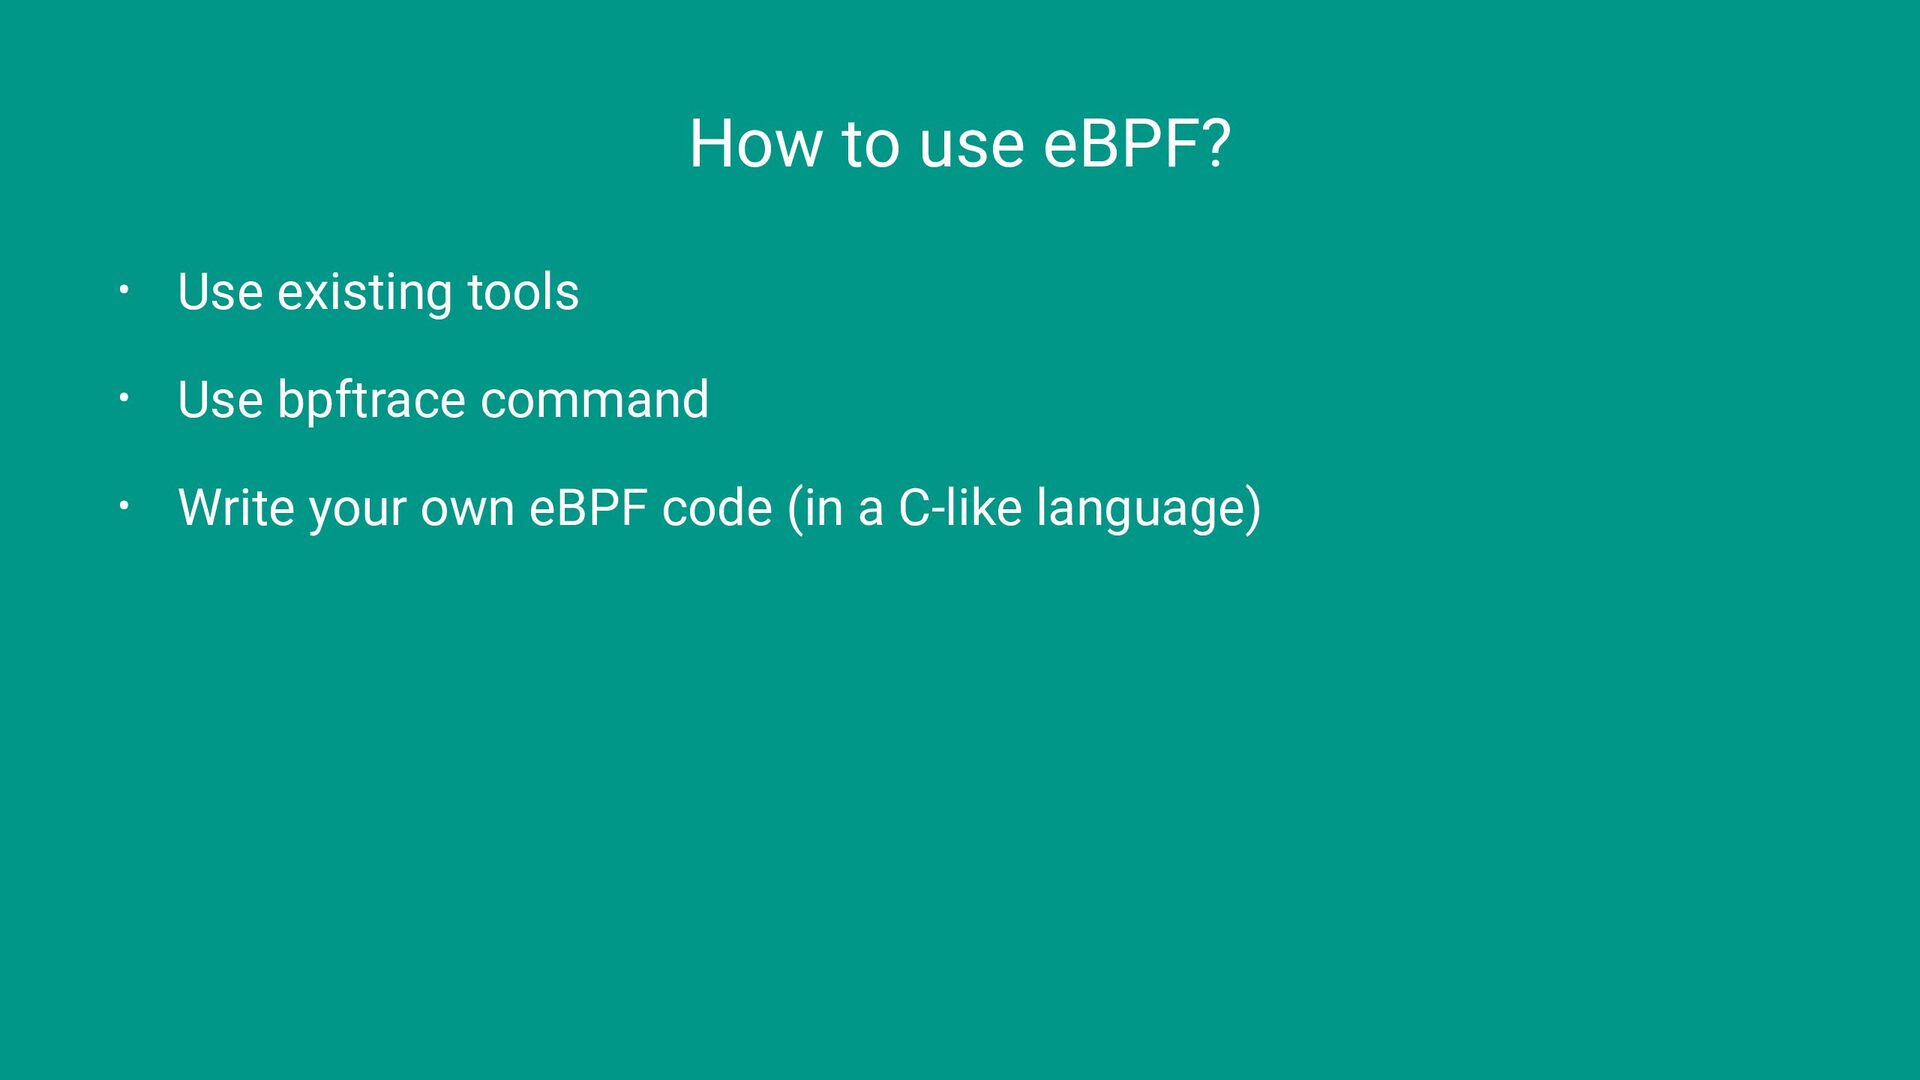
  6. How to use eBPF? • Use existing tools • Use

    bpftrace command • Write your own eBPF code (in a C-like language)
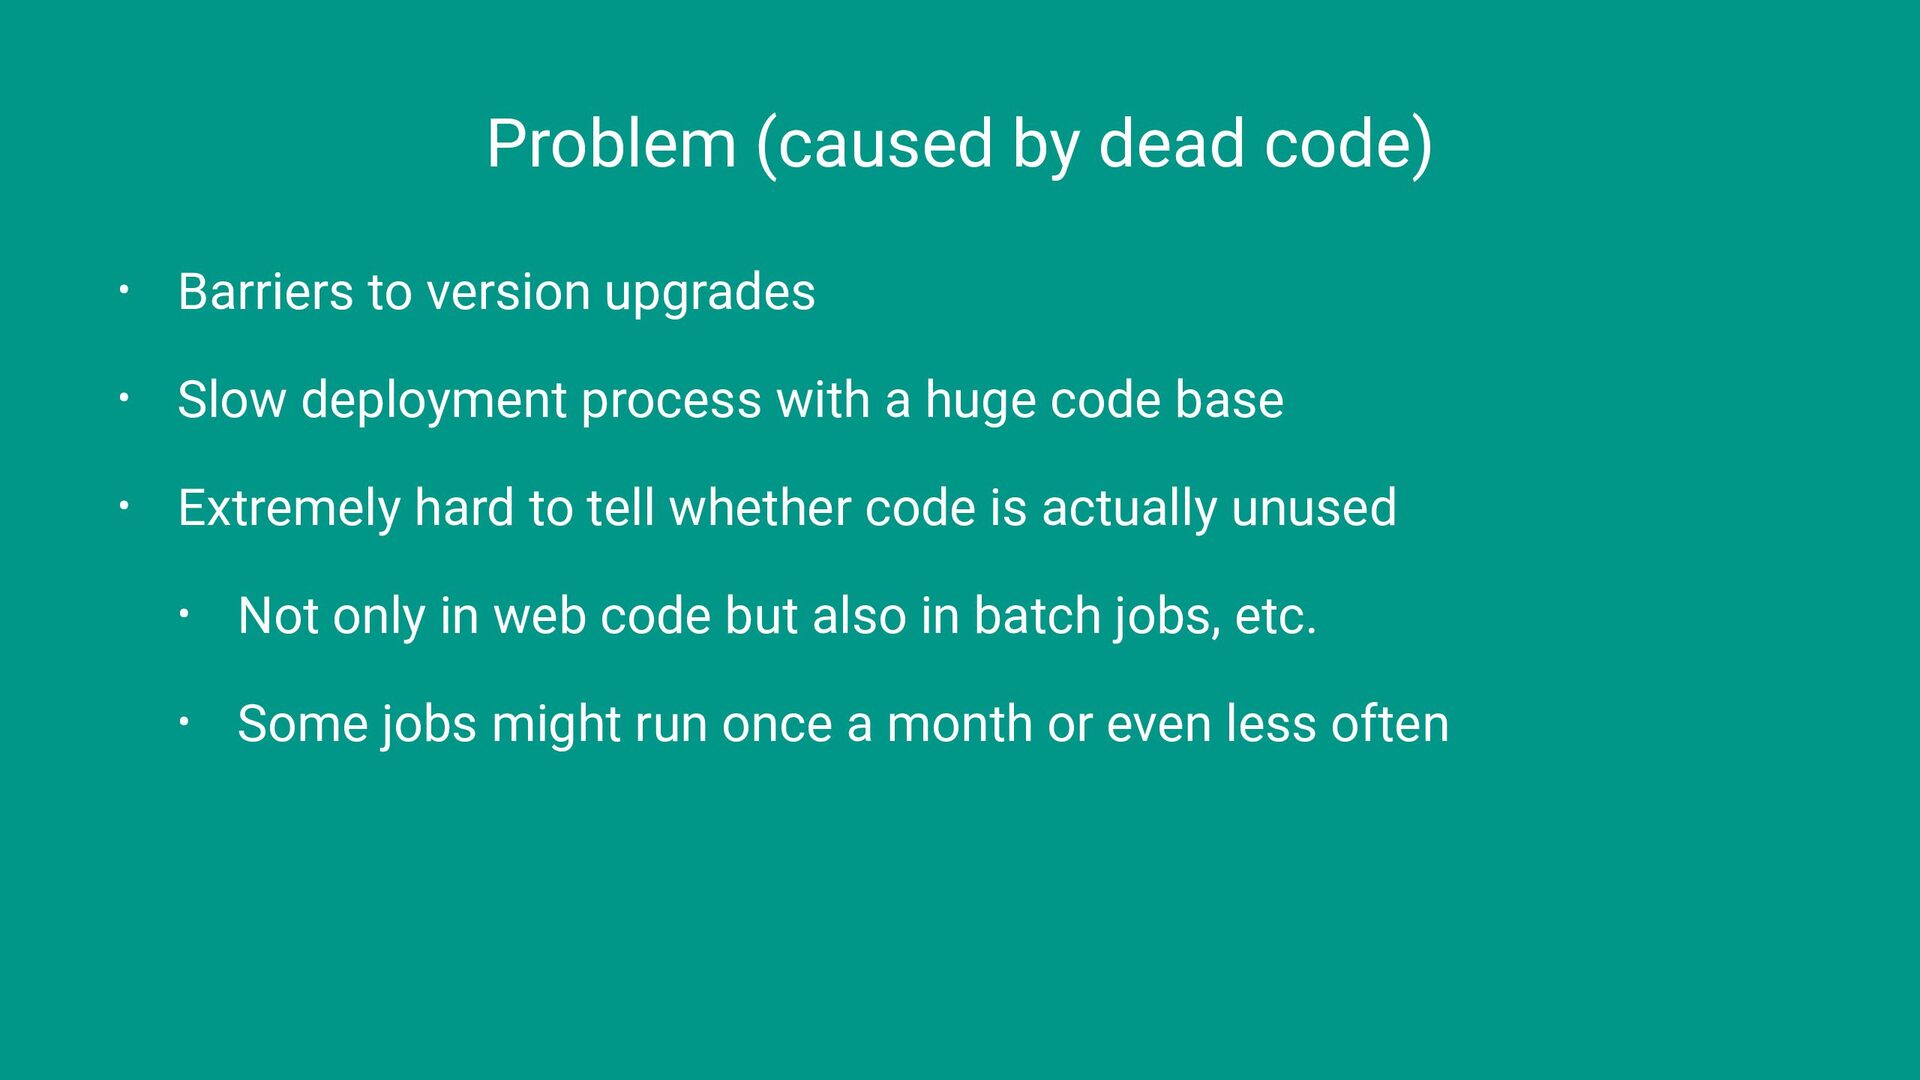
  7. Problem (caused by dead code) • Barriers to version upgrades

    • Slow deployment process with a huge code base • Extremely hard to tell whether code is actually unused • Not only in web code but also in batch jobs, etc. • Some jobs might run once a month or even less often
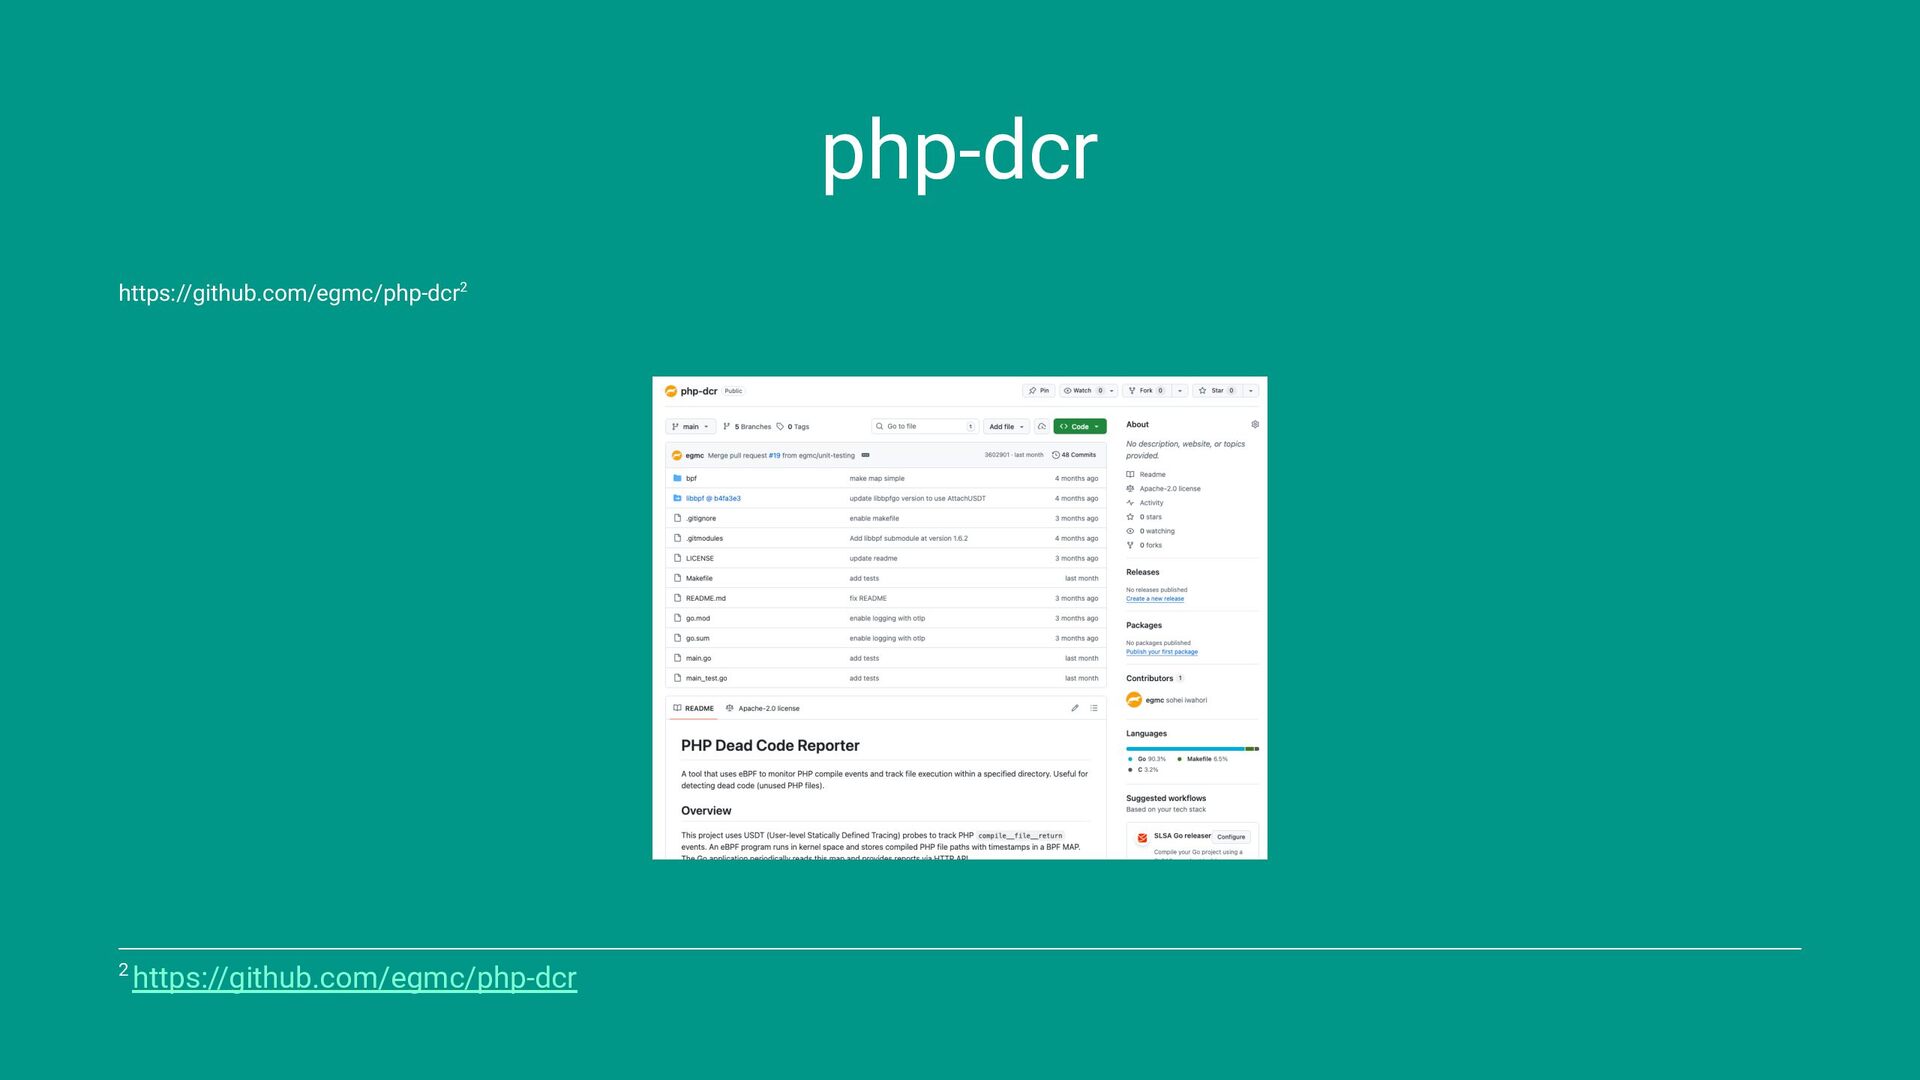
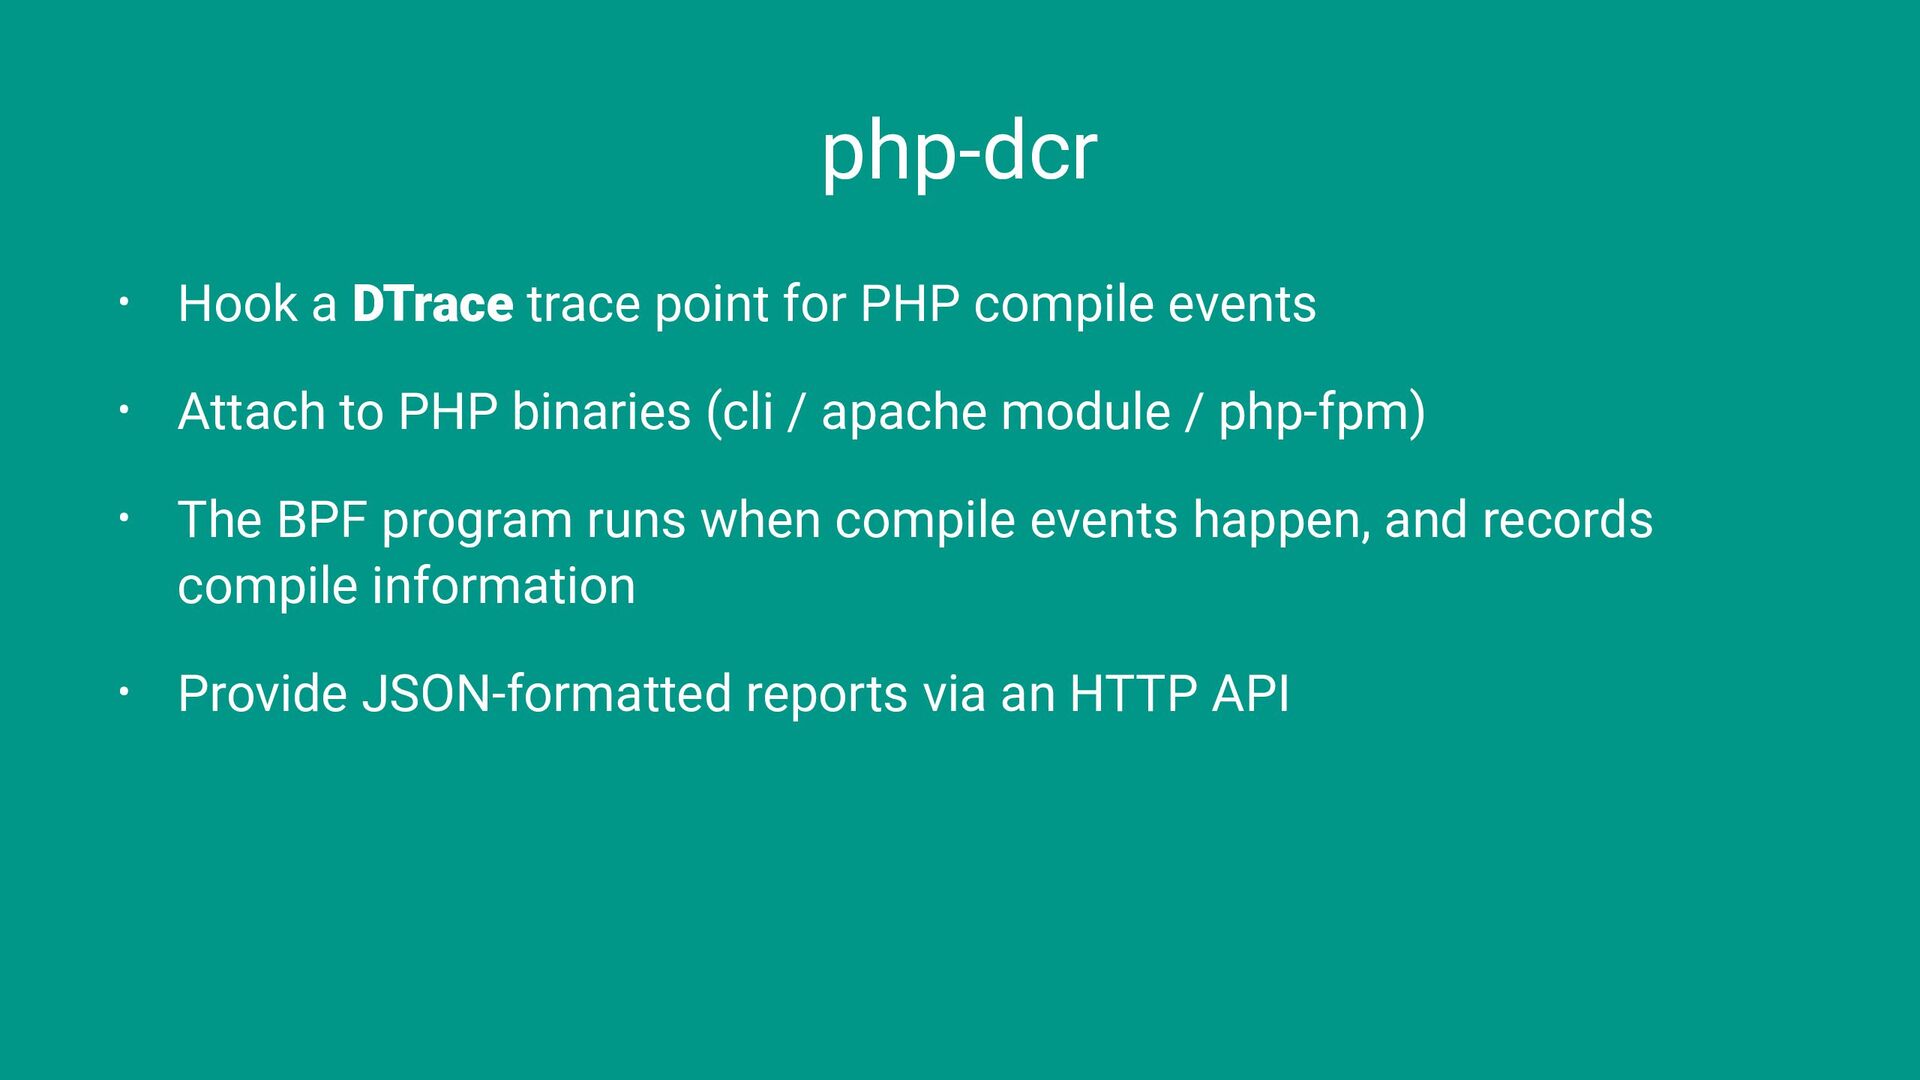
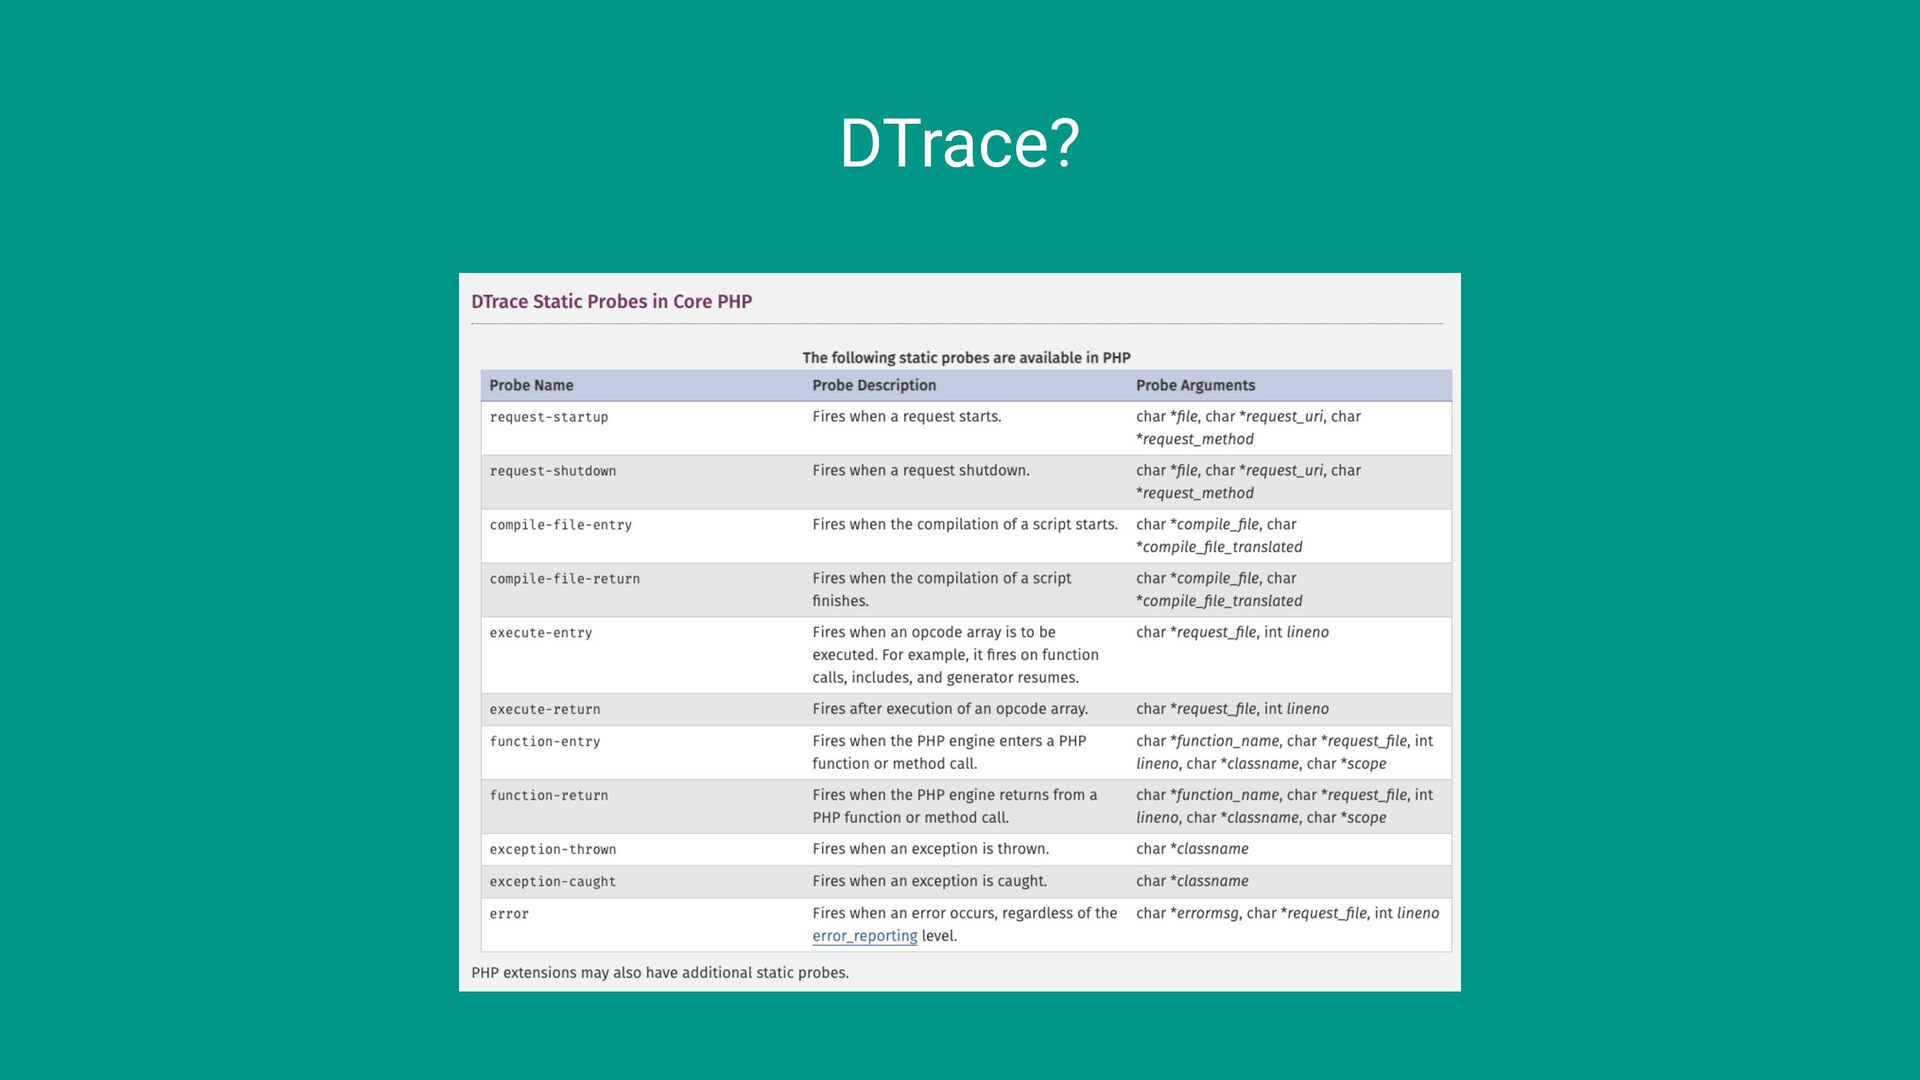
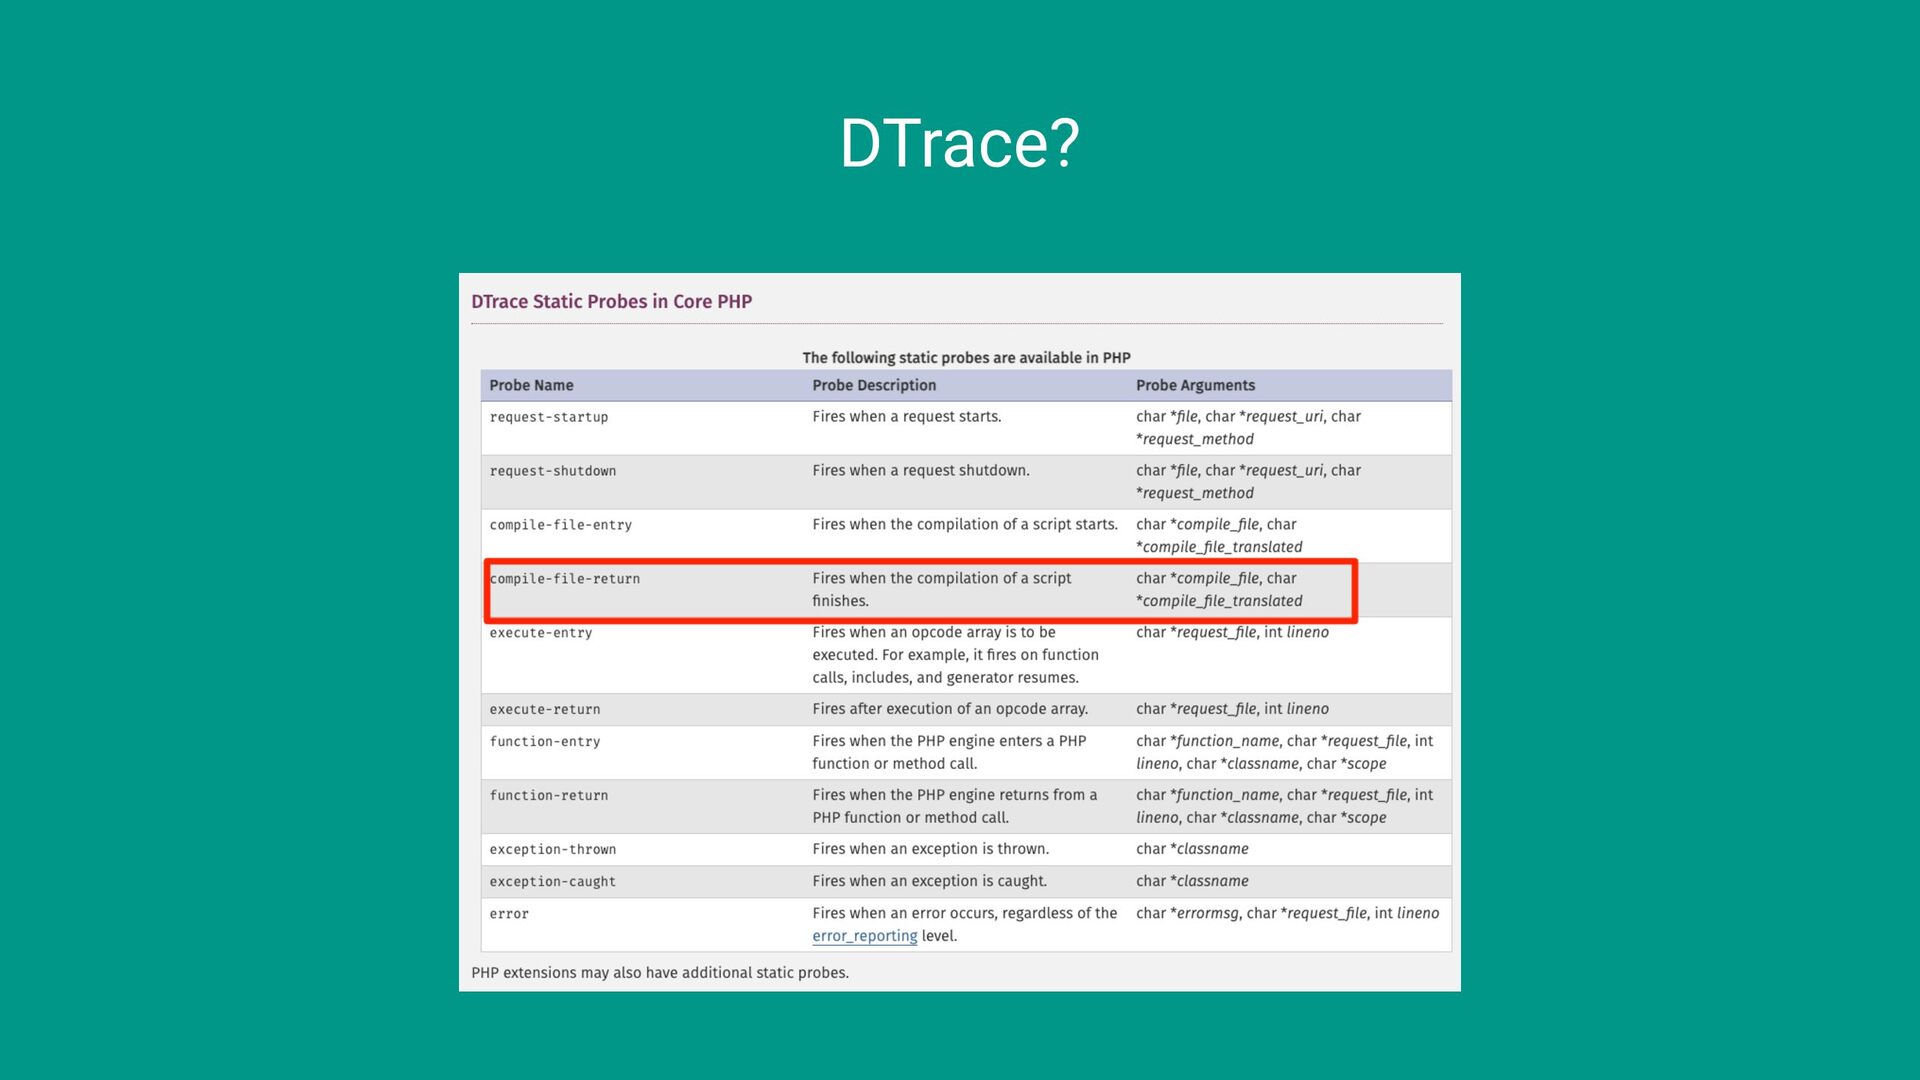
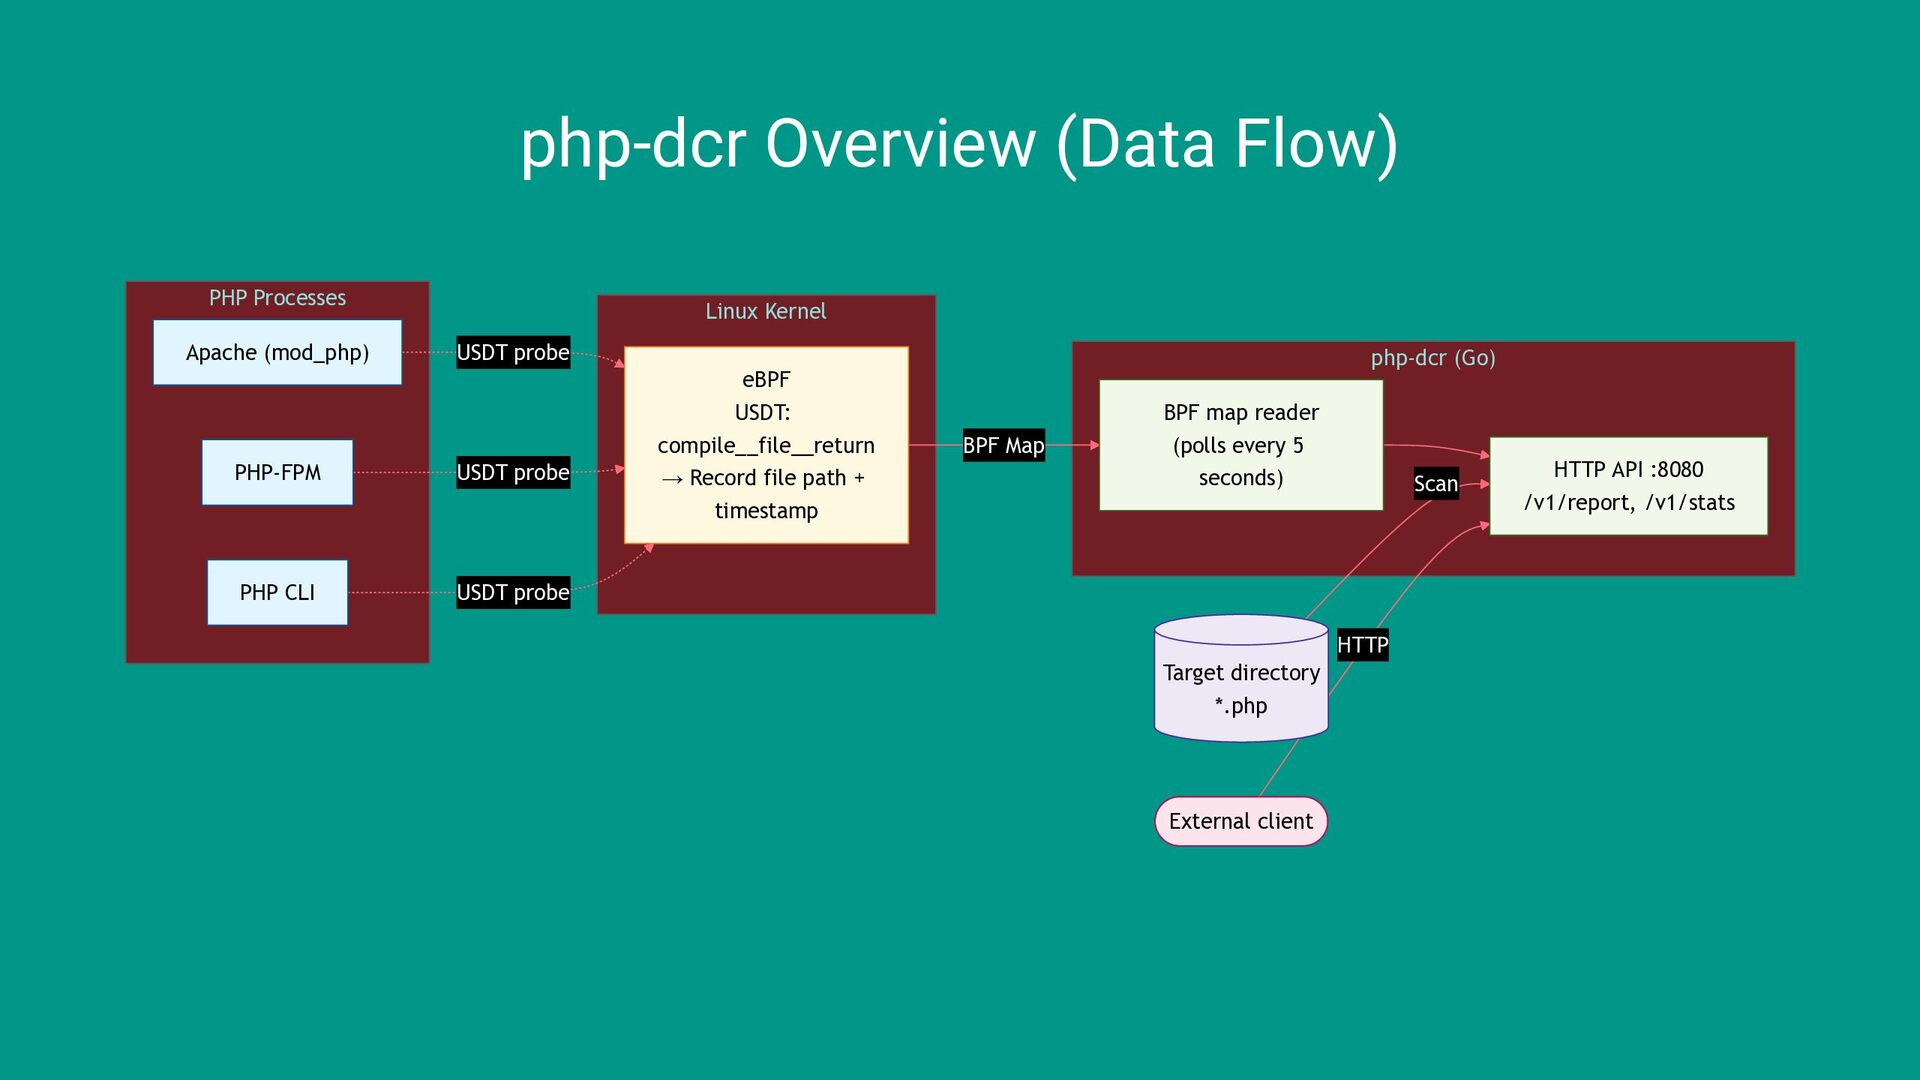
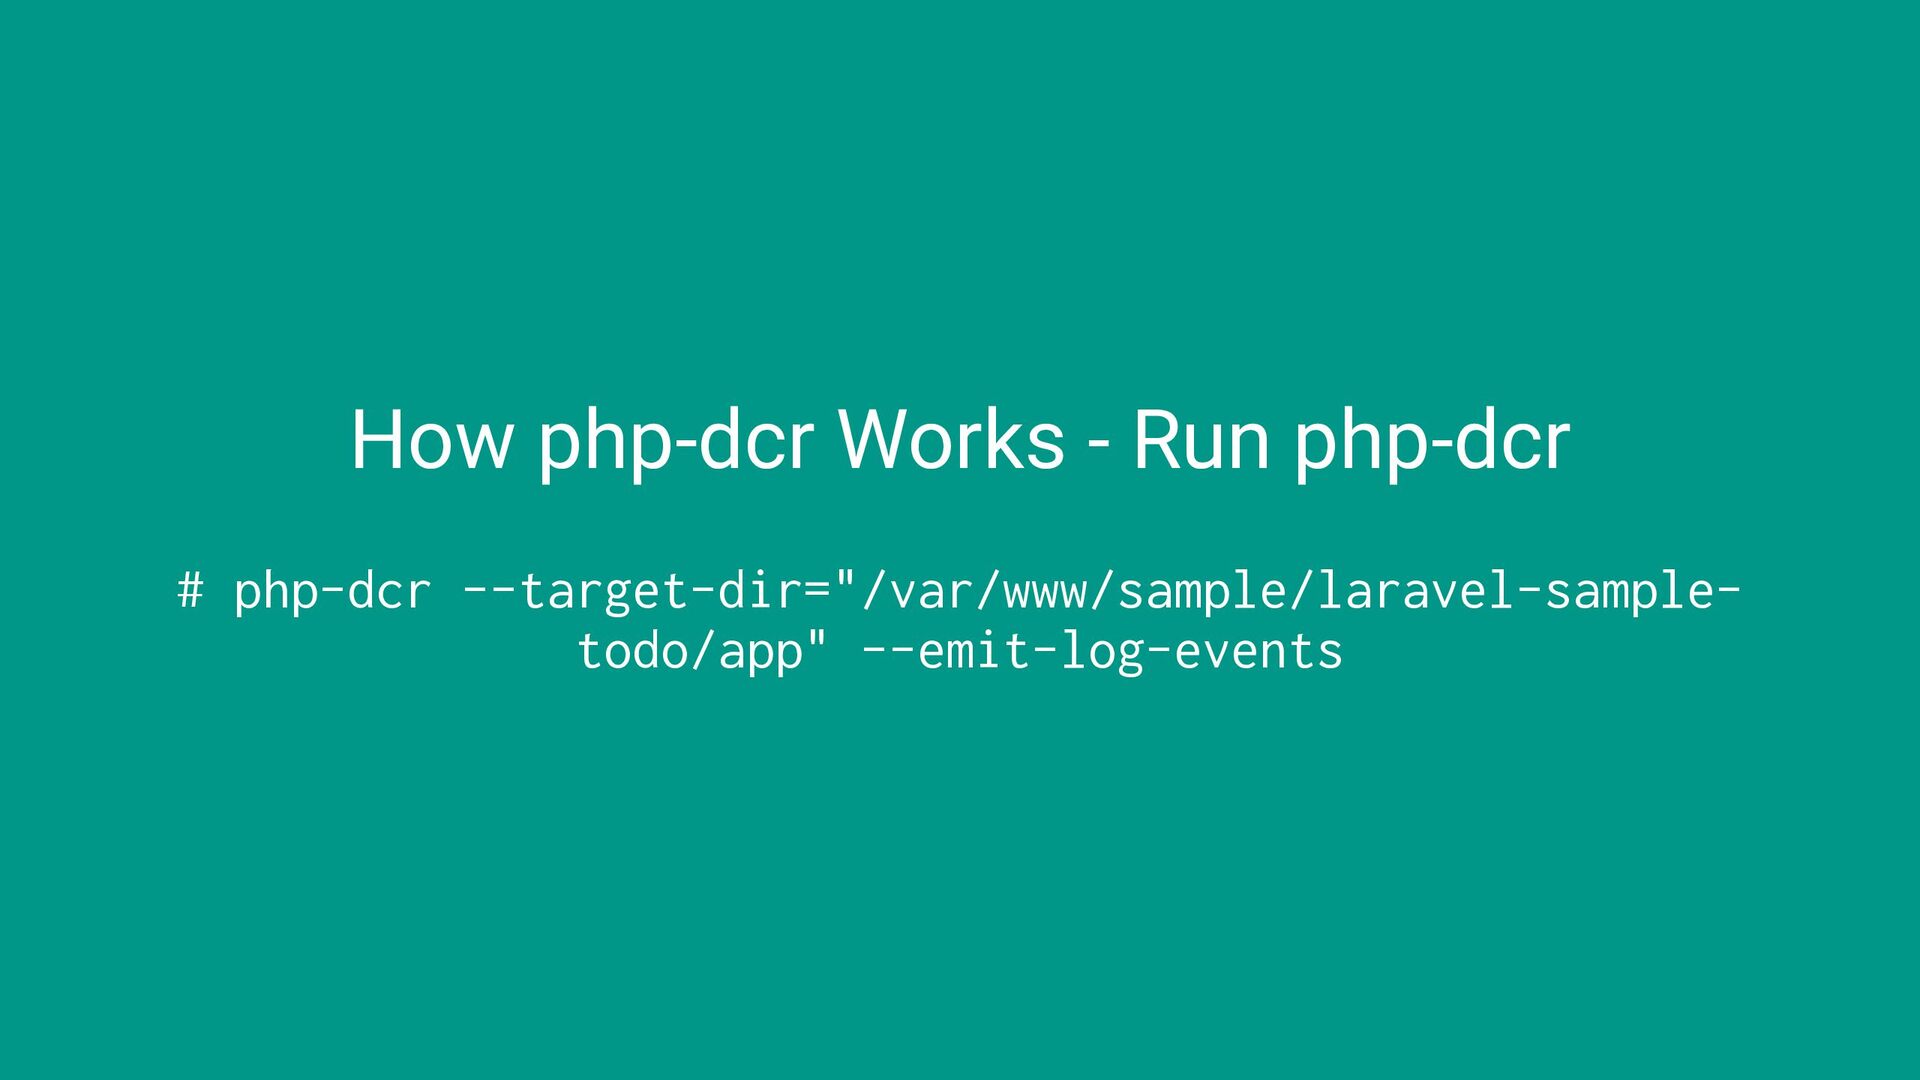
  8. php-dcr • Hook a DTrace trace point for PHP compile

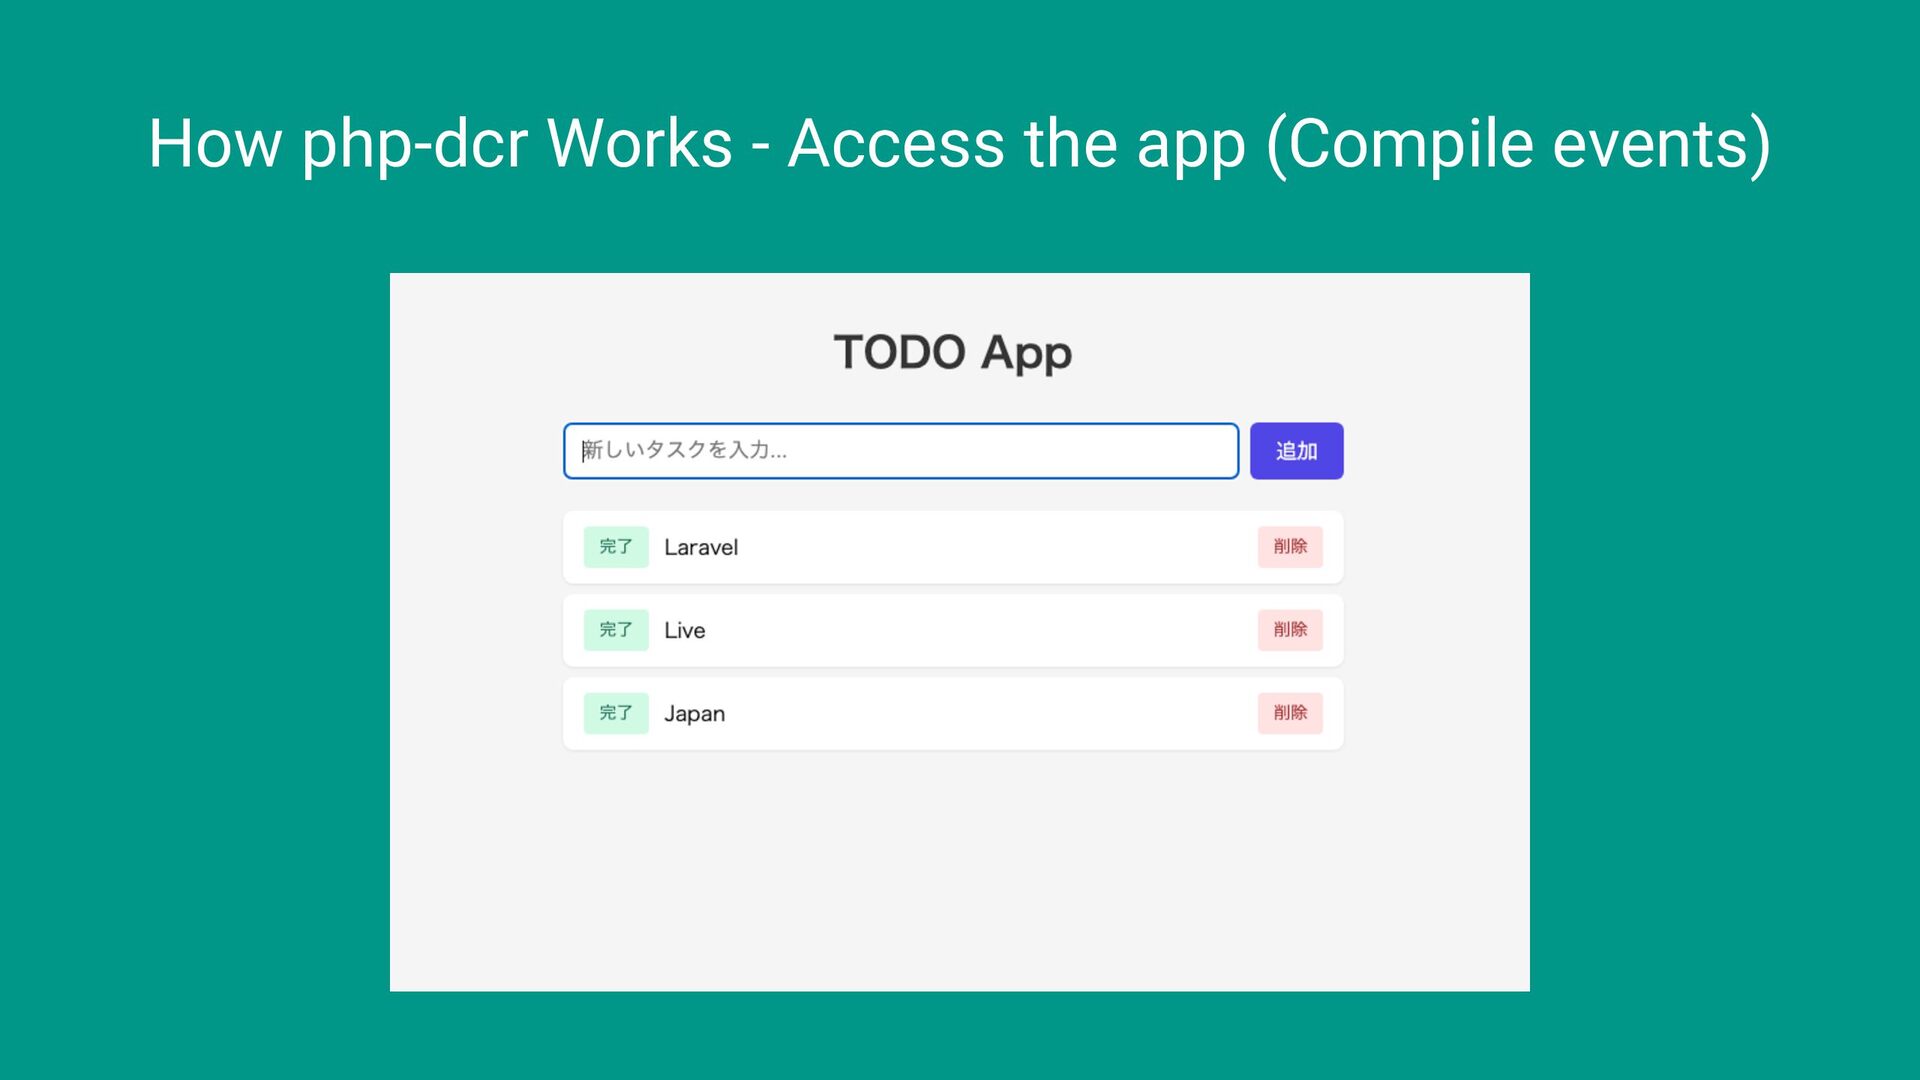
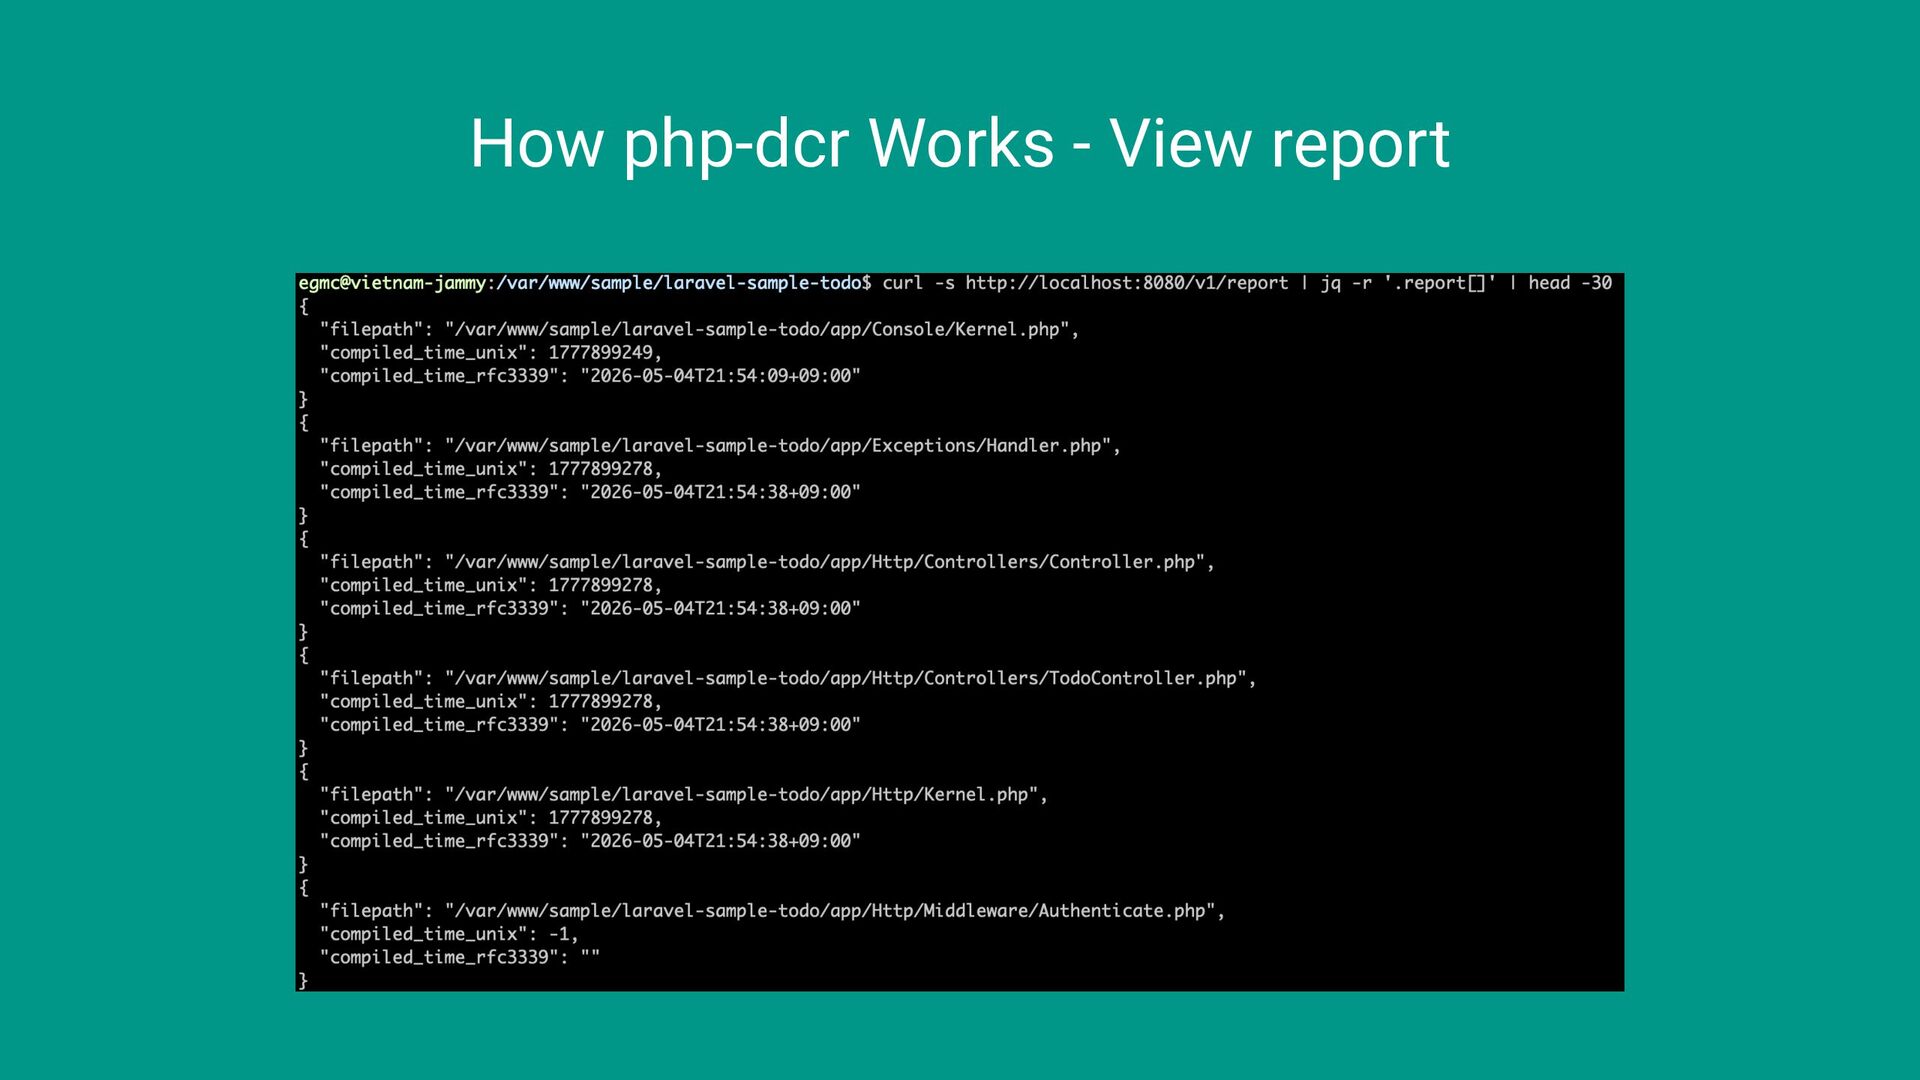
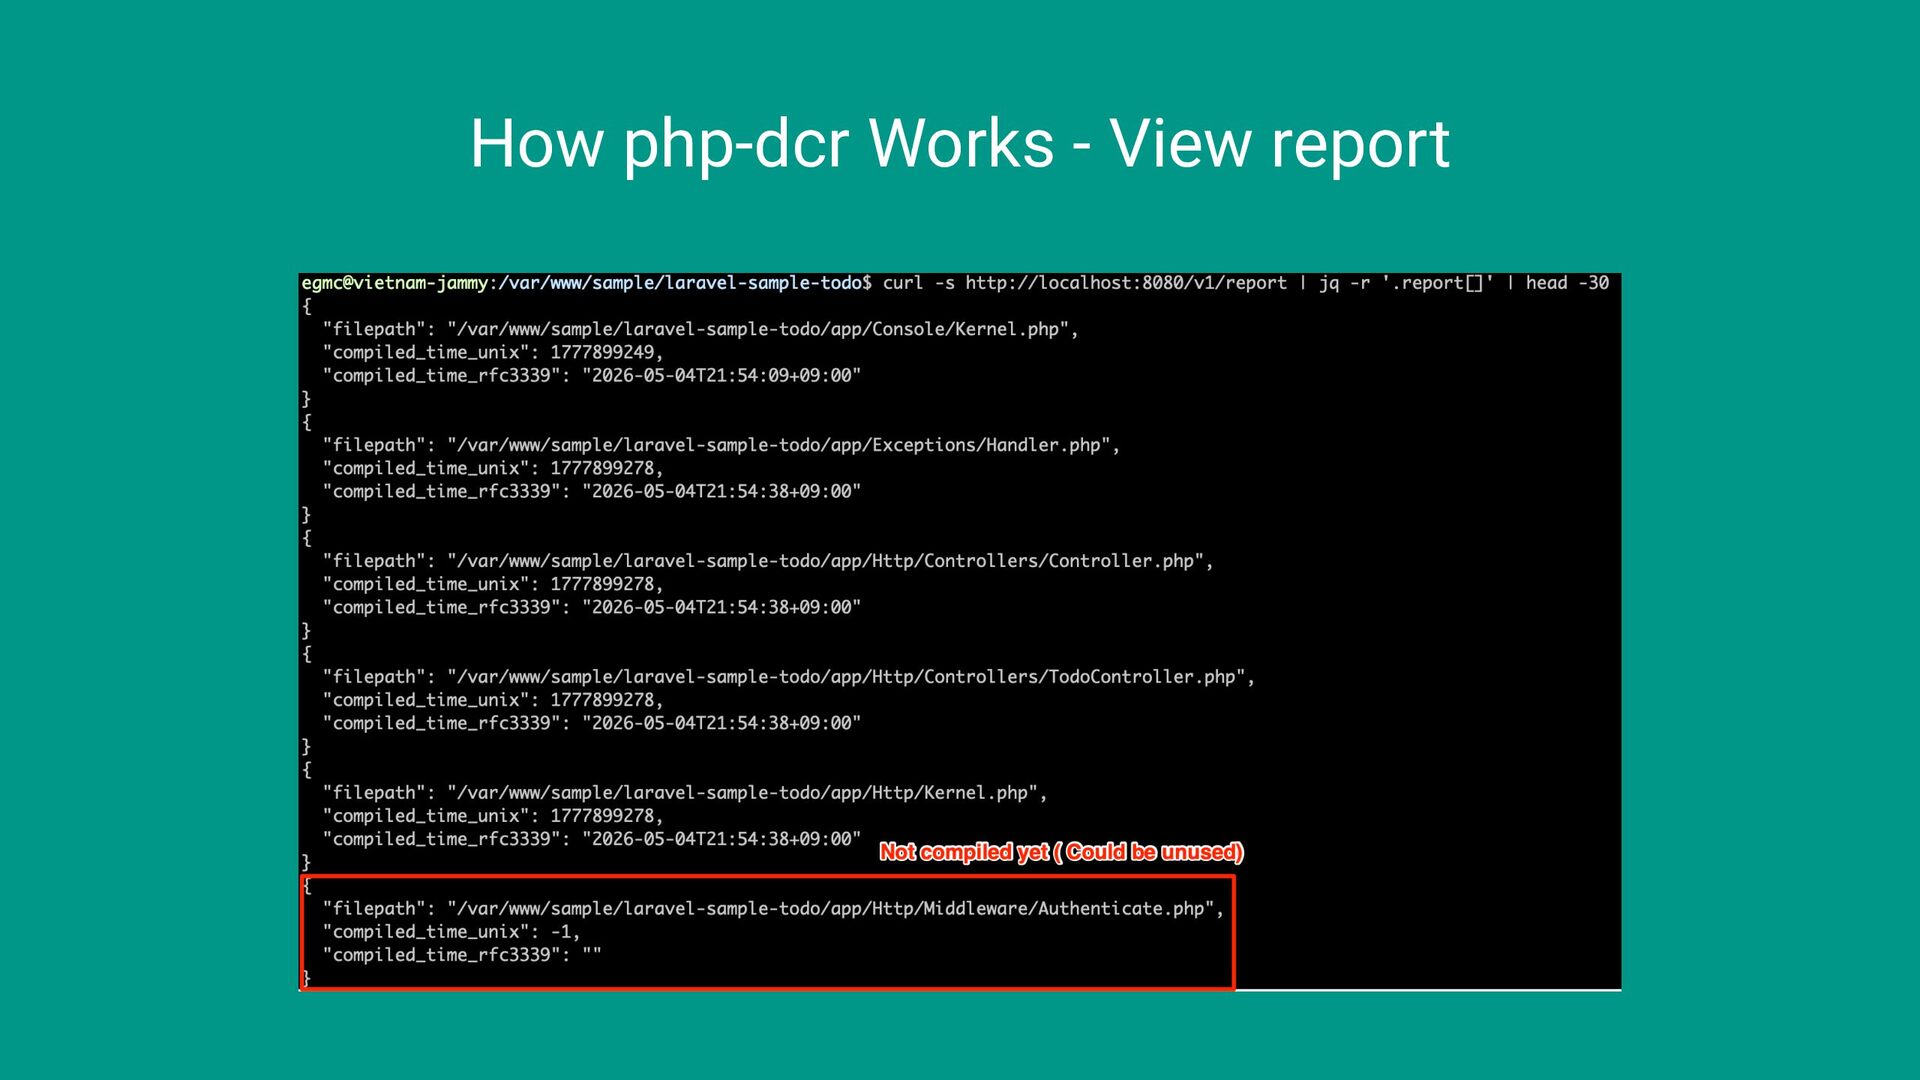
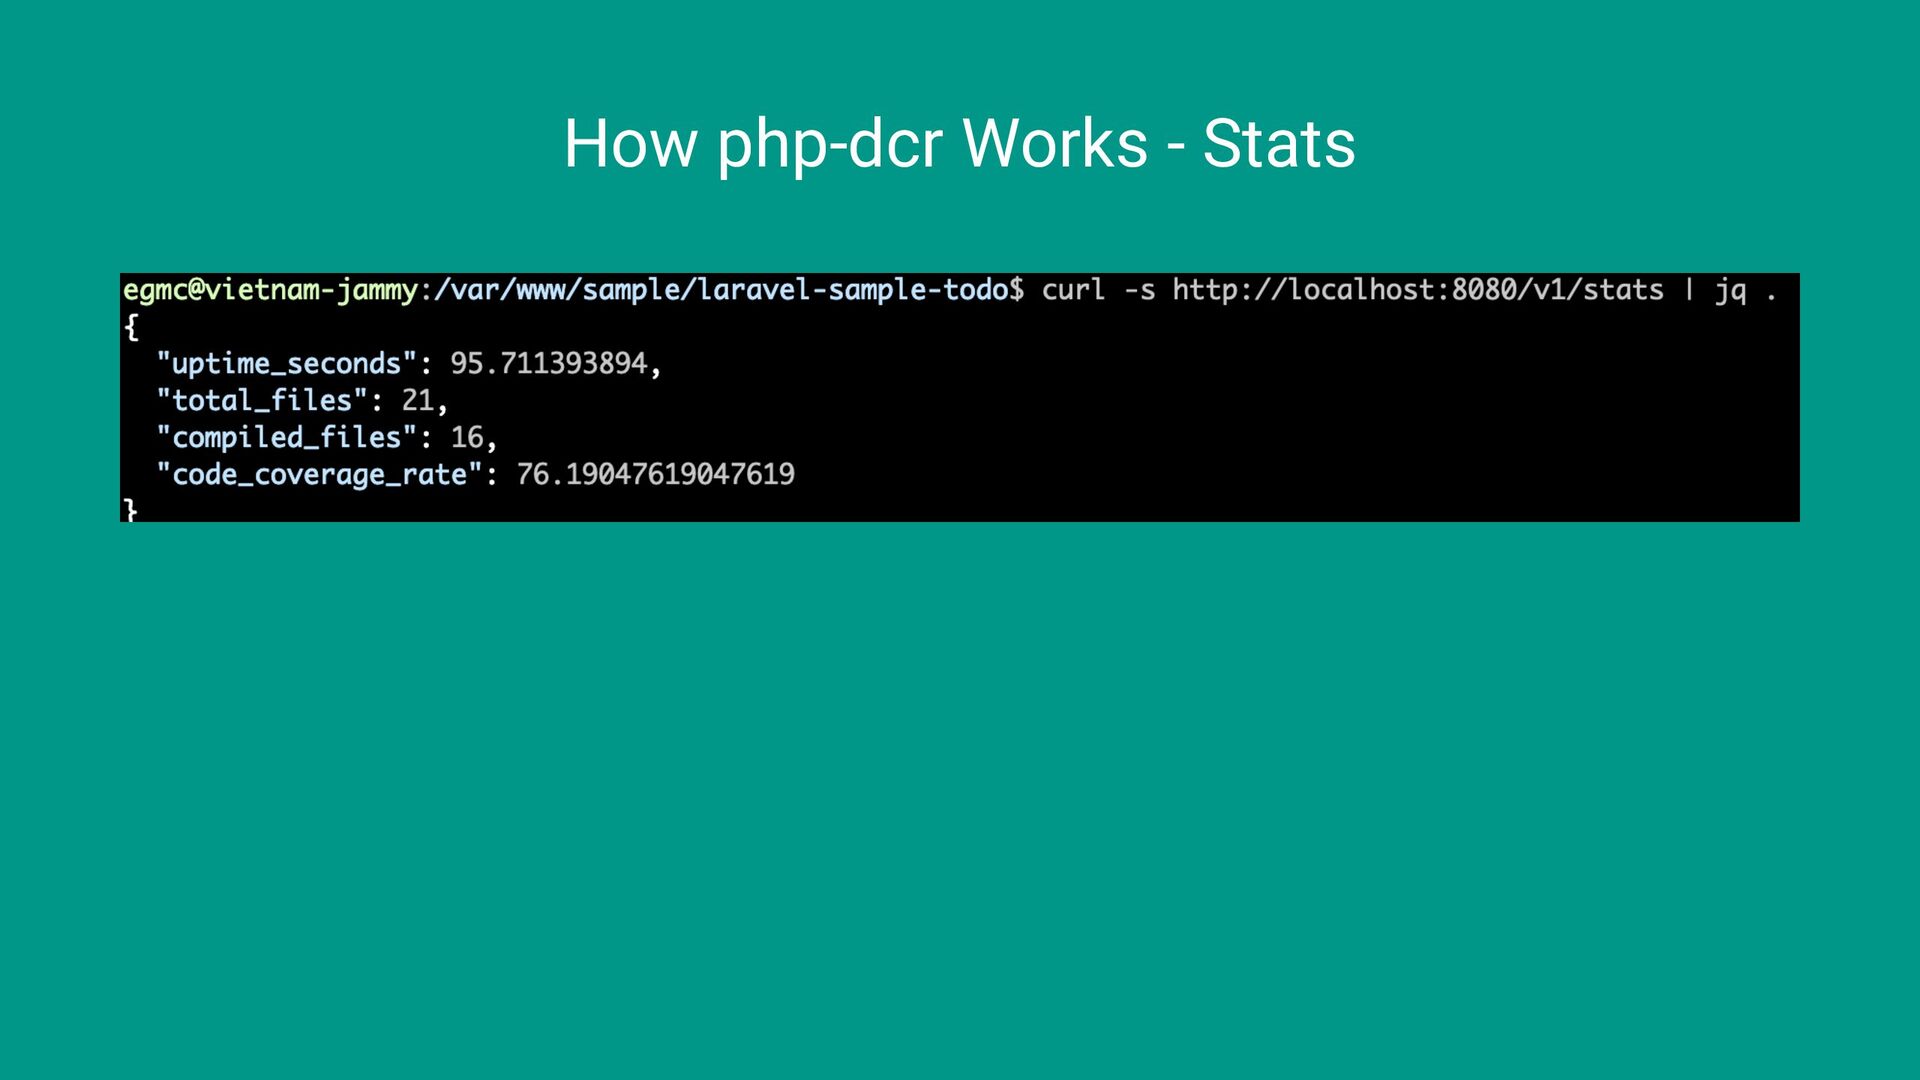
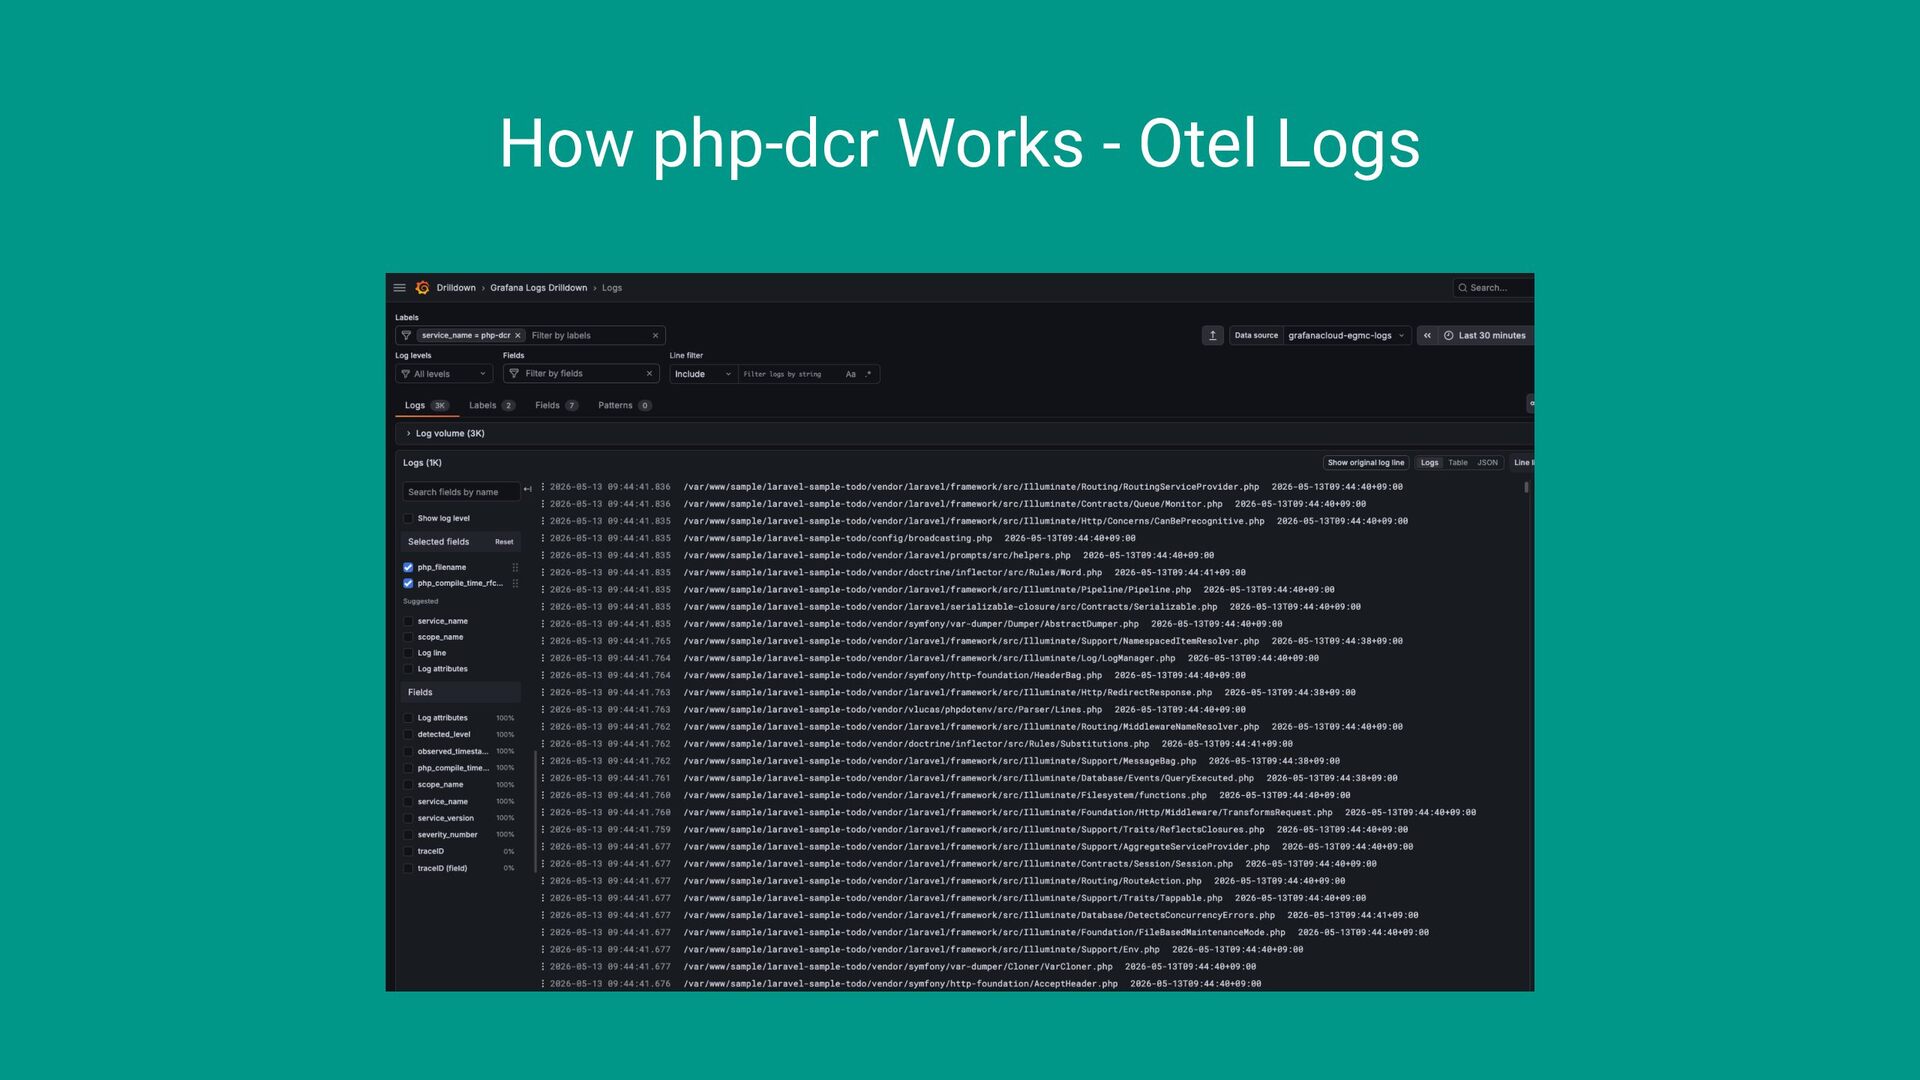
    events • Attach to PHP binaries (cli / apache module / php-fpm) • The BPF program runs when compile events happen, and records compile information • Provide JSON-formatted reports via an HTTP API
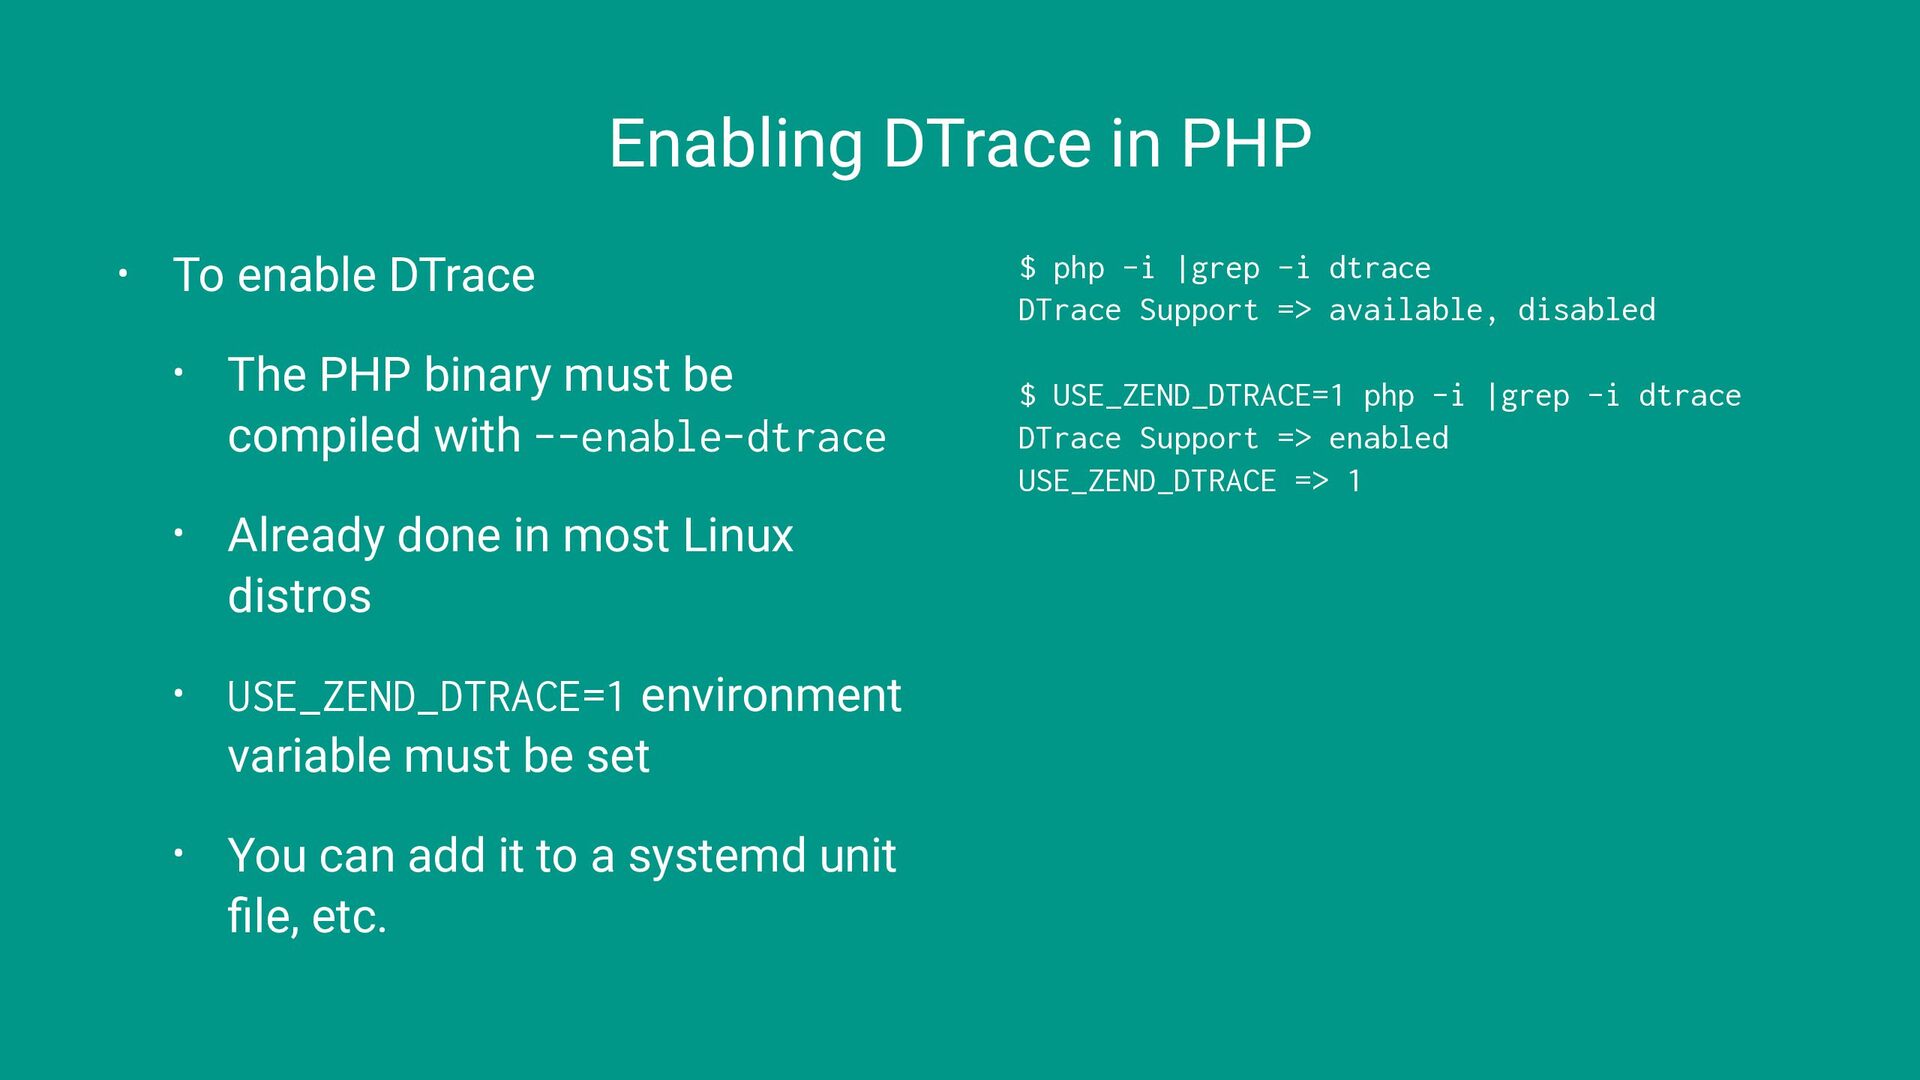
  9. Enabling DTrace in PHP • To enable DTrace • The

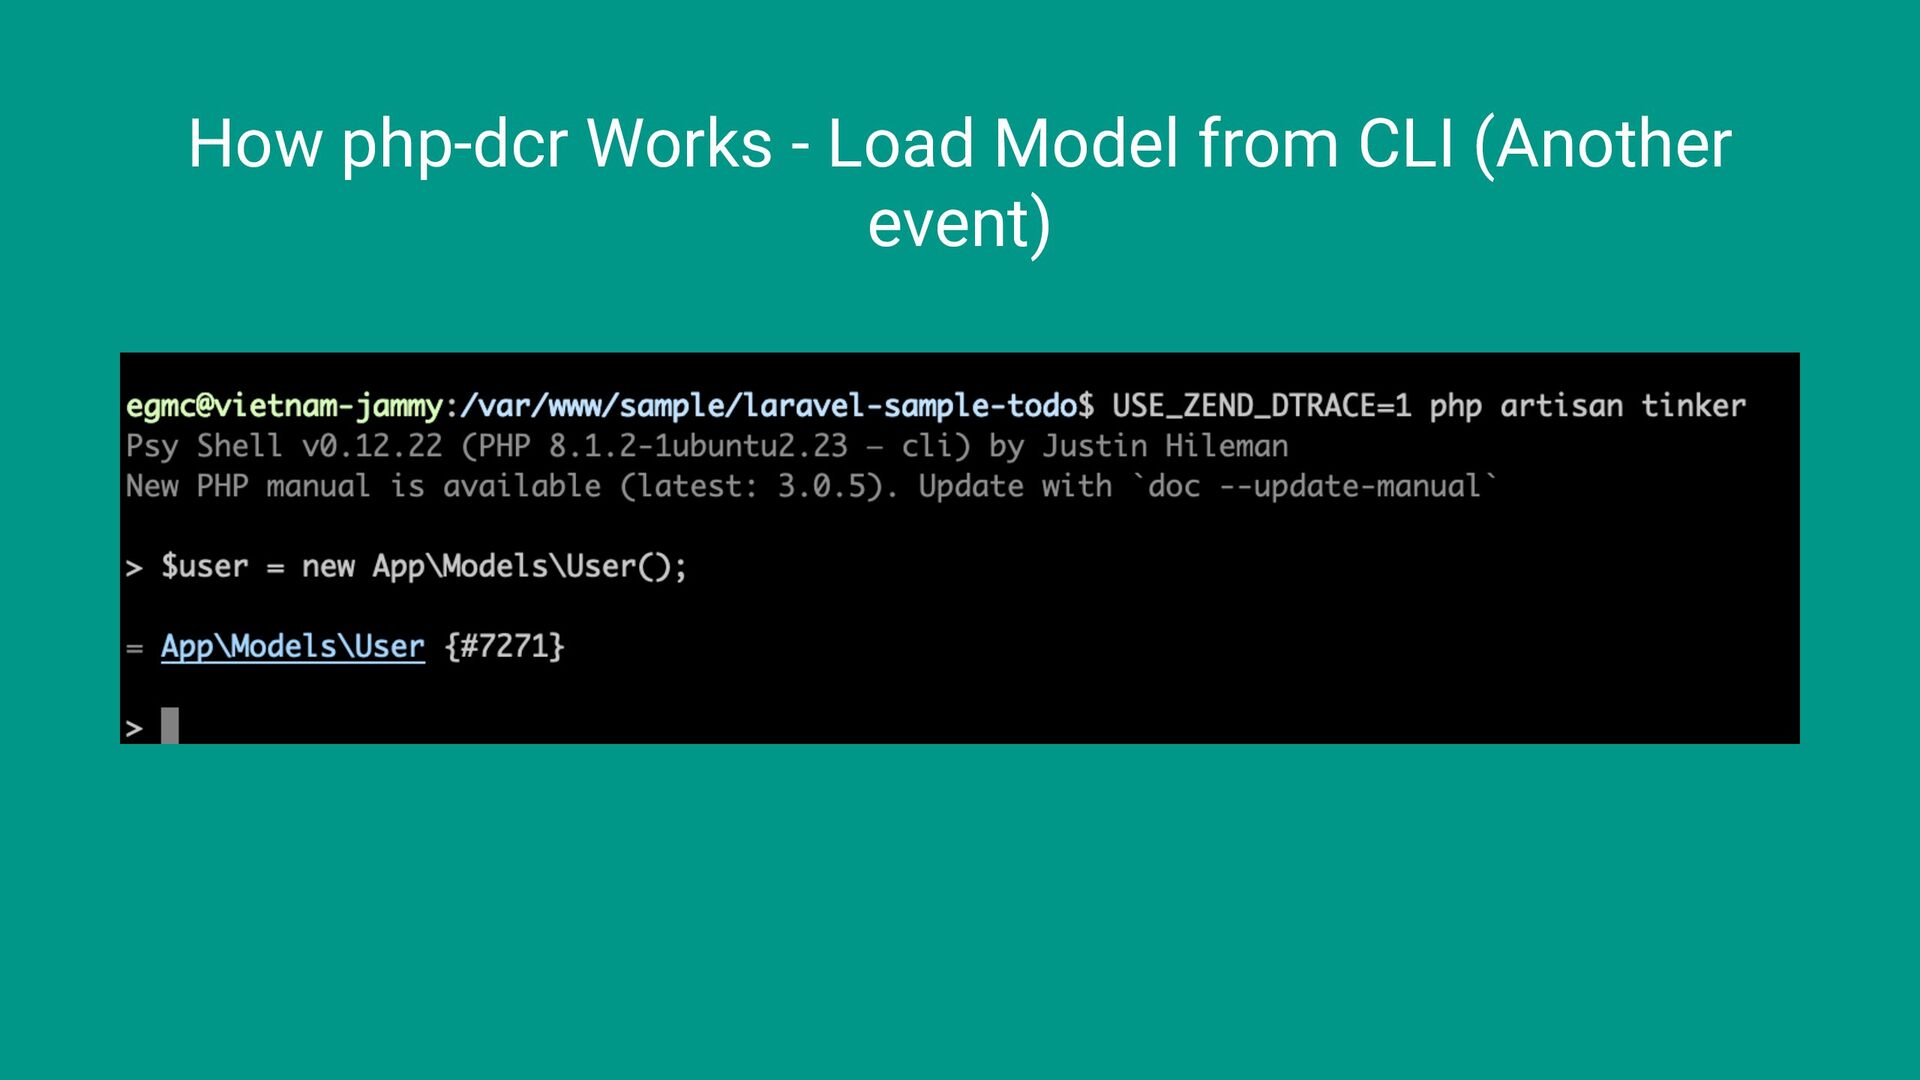
    PHP binary must be compiled with --enable-dtrace • Already done in most Linux distros • USE_ZEND_DTRACE=1 environment variable must be set • You can add it to a systemd unit file, etc. $ php -i |grep -i dtrace DTrace Support => available, disabled $ USE_ZEND_DTRACE=1 php -i |grep -i dtrace DTrace Support => enabled USE_ZEND_DTRACE => 1
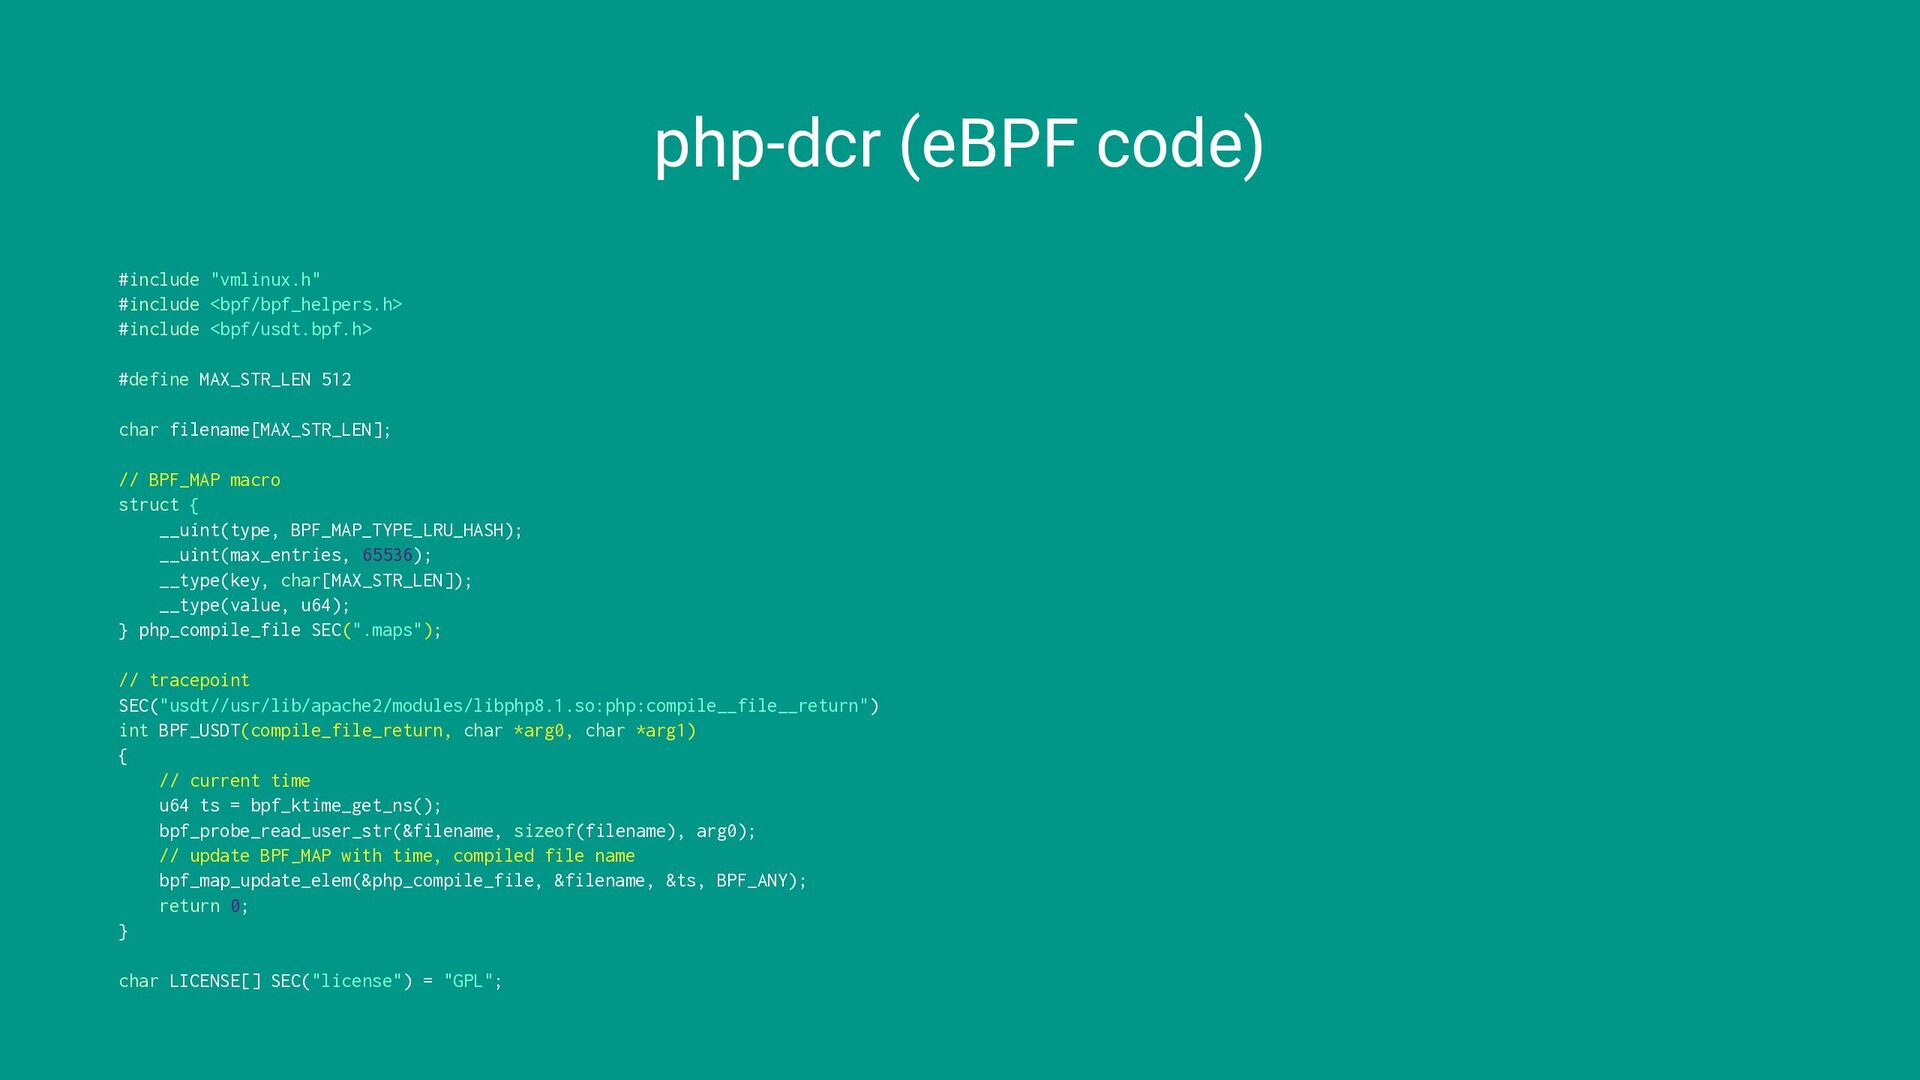
  10. php-dcr (eBPF code) #include "vmlinux.h" #include <bpf/bpf_helpers.h> #include <bpf/usdt.bpf.h> #define

    MAX_STR_LEN 512 char filename[MAX_STR_LEN]; // BPF_MAP macro struct { __uint(type, BPF_MAP_TYPE_LRU_HASH); __uint(max_entries, 65536); __type(key, char[MAX_STR_LEN]); __type(value, u64); } php_compile_file SEC(".maps"); // tracepoint SEC("usdt//usr/lib/apache2/modules/libphp8.1.so:php:compile__file__return") int BPF_USDT(compile_file_return, char *arg0, char *arg1) { // current time u64 ts = bpf_ktime_get_ns(); bpf_probe_read_user_str(&filename, sizeof(filename), arg0); // update BPF_MAP with time, compiled file name bpf_map_update_elem(&php_compile_file, &filename, &ts, BPF_ANY); return 0; } char LICENSE[] SEC("license") = "GPL";
  11. php-dcr Overview (Data Flow) PHP Processes Apache (mod_php) Linux Kernel

    USDT probe php-dcr (Go) eBPF USDT: compile__file__return PHP-FPM PHP CLI USDT probe → Record file path + timestamp BPF map reader BPF Map (polls every 5 seconds) Scan USDT probe HTTP Target directory *.php External client HTTP API :8080 /v1/report, /v1/stats
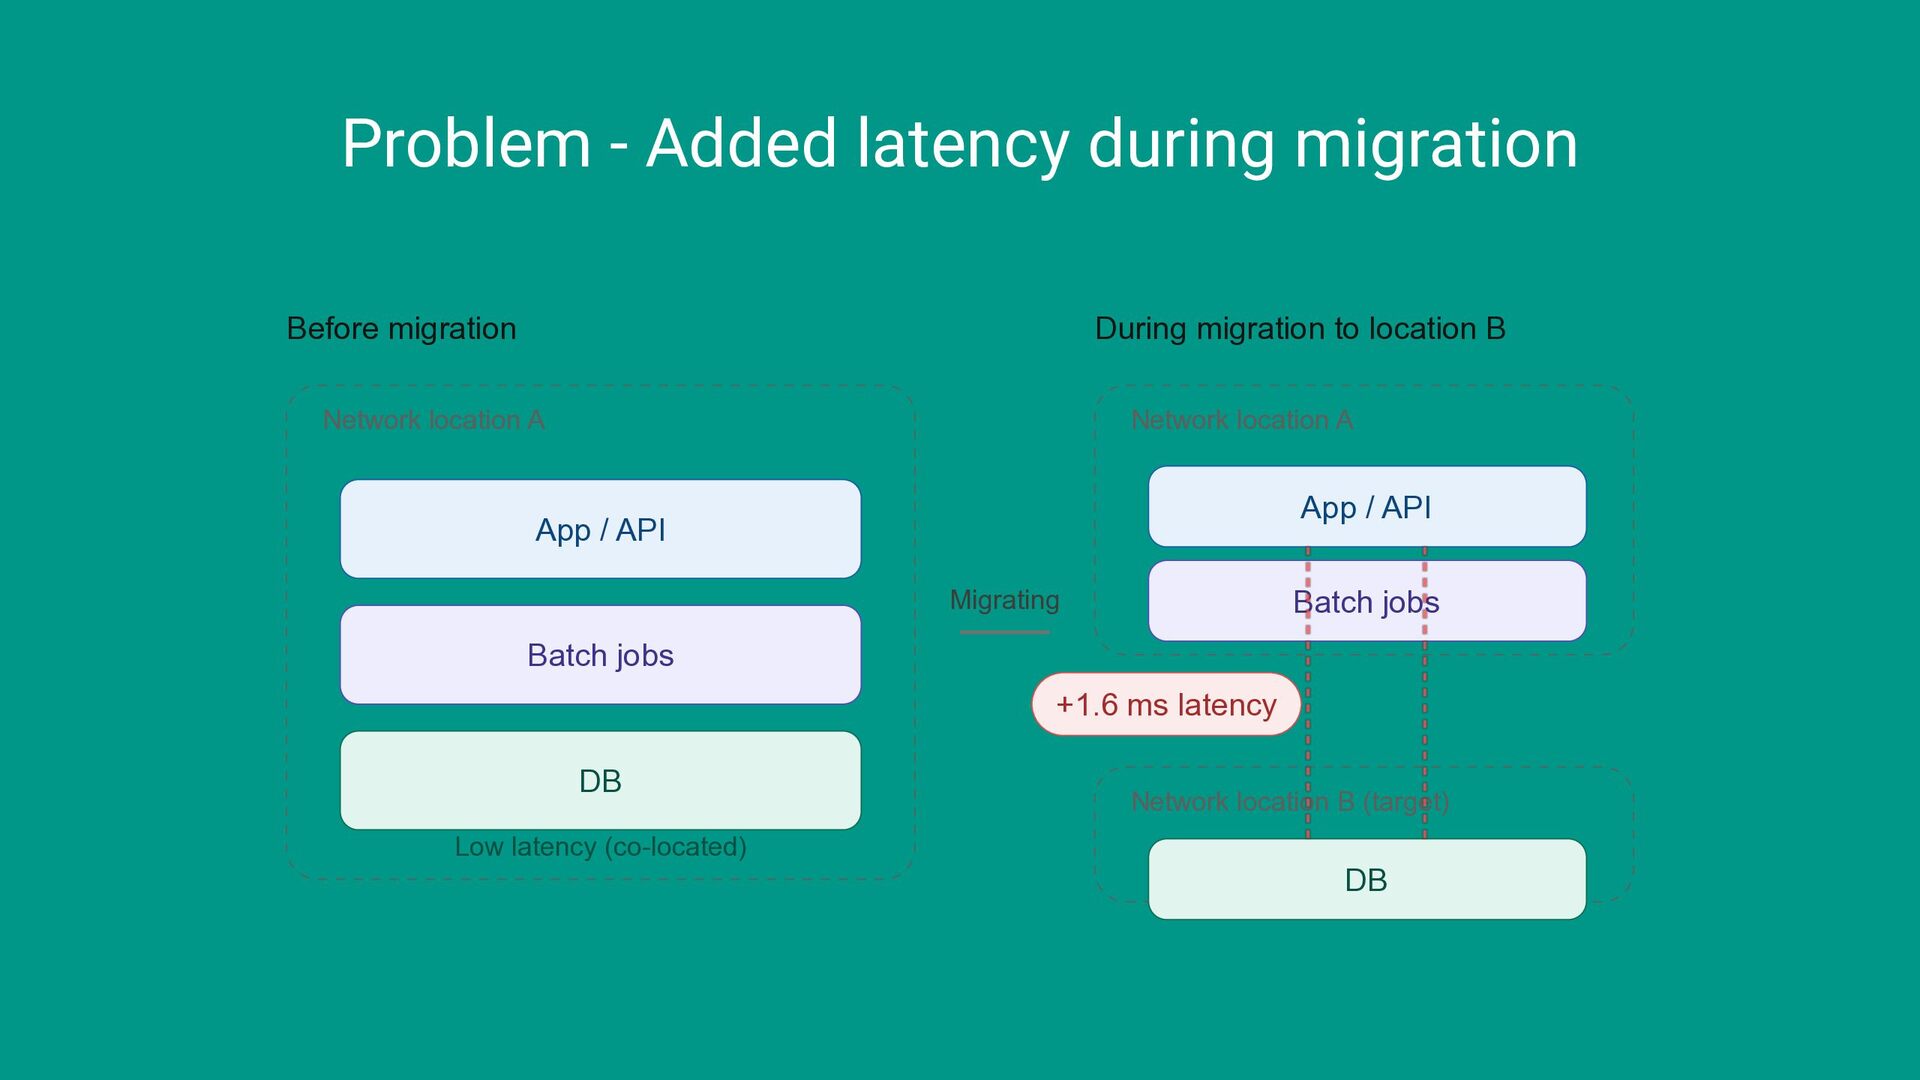
  12. Problem - Added latency during migration Before migration During migration

    to location B Network location A Network location A App / API App / API Batch jobs Migrating Batch jobs +1.6 ms latency DB Network location B (target) Low latency (co-located) DB
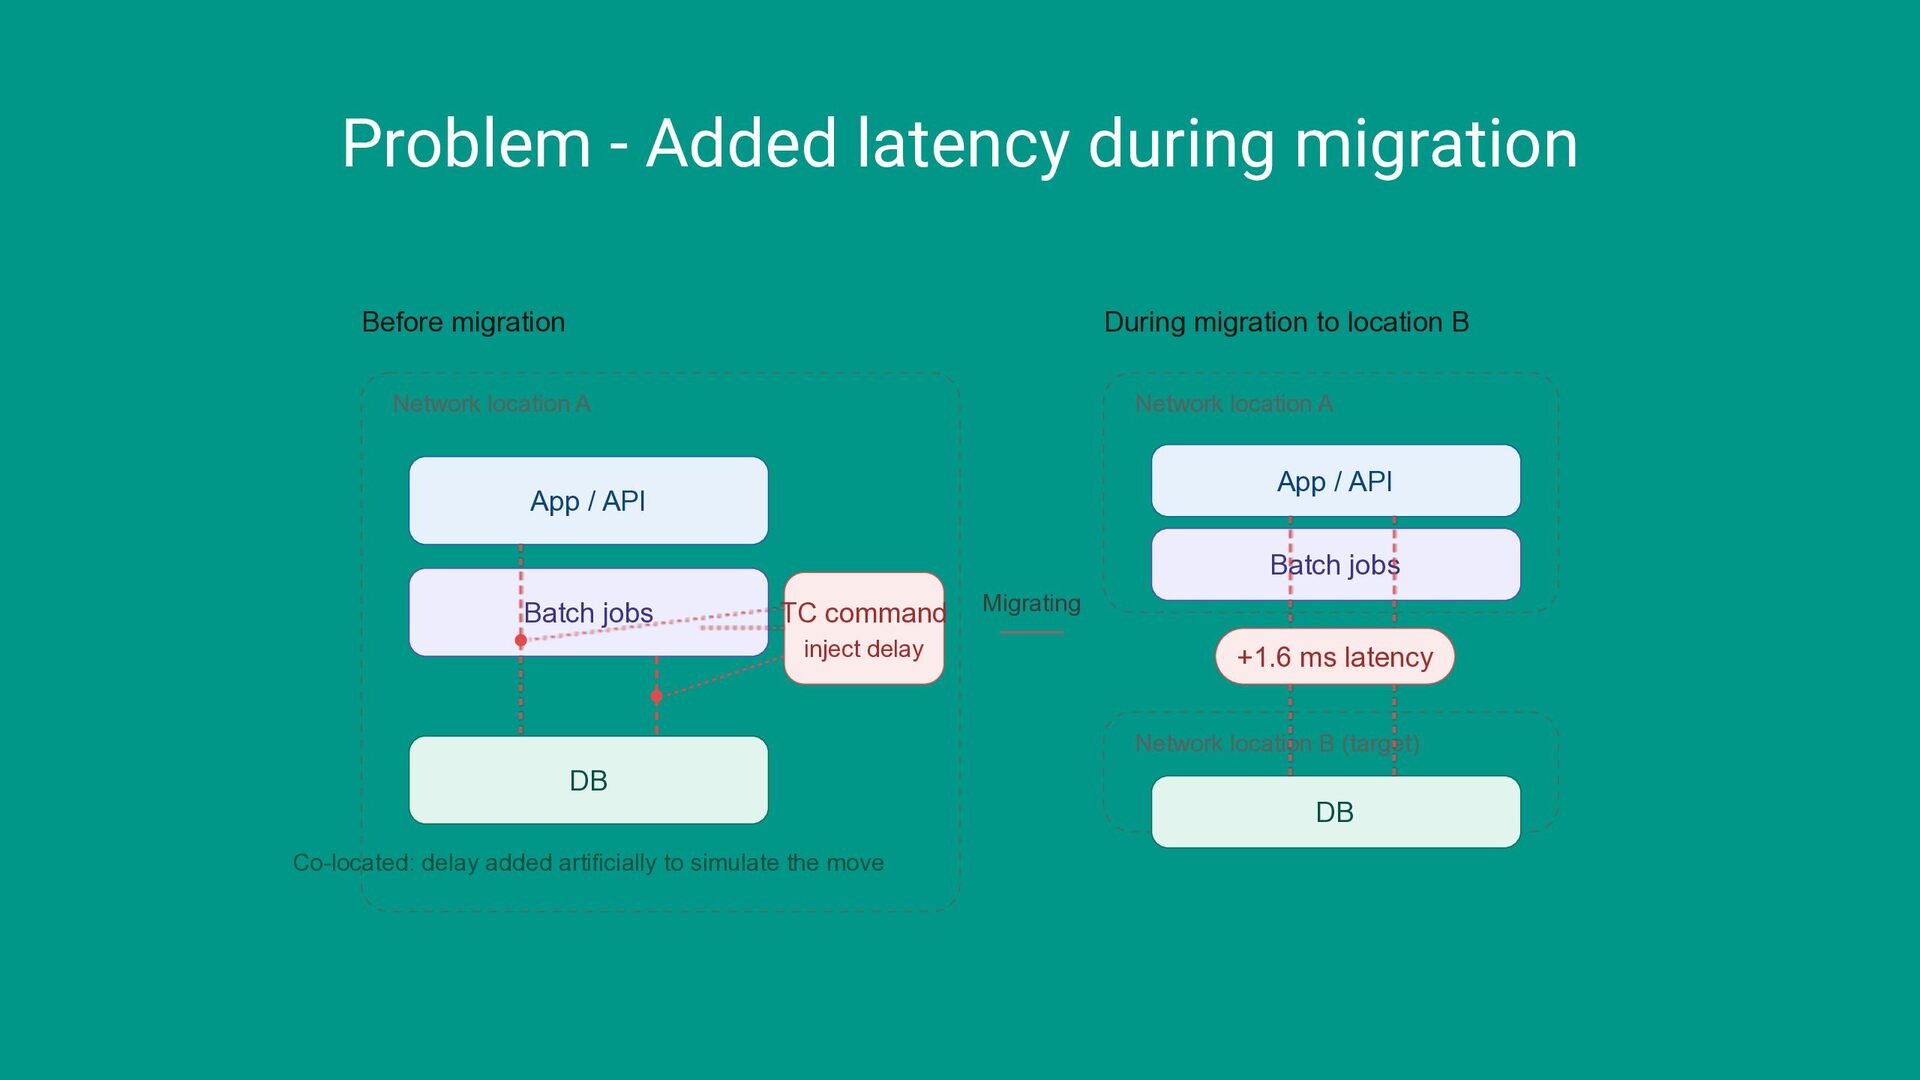
  13. Problem - Added latency during migration Before migration During migration

    to location B Network location A Network location A App / API App / API Batch jobs Batch jobs TC command inject delay Migrating +1.6 ms latency Network location B (target) DB DB Co-located: delay added artificially to simulate the move
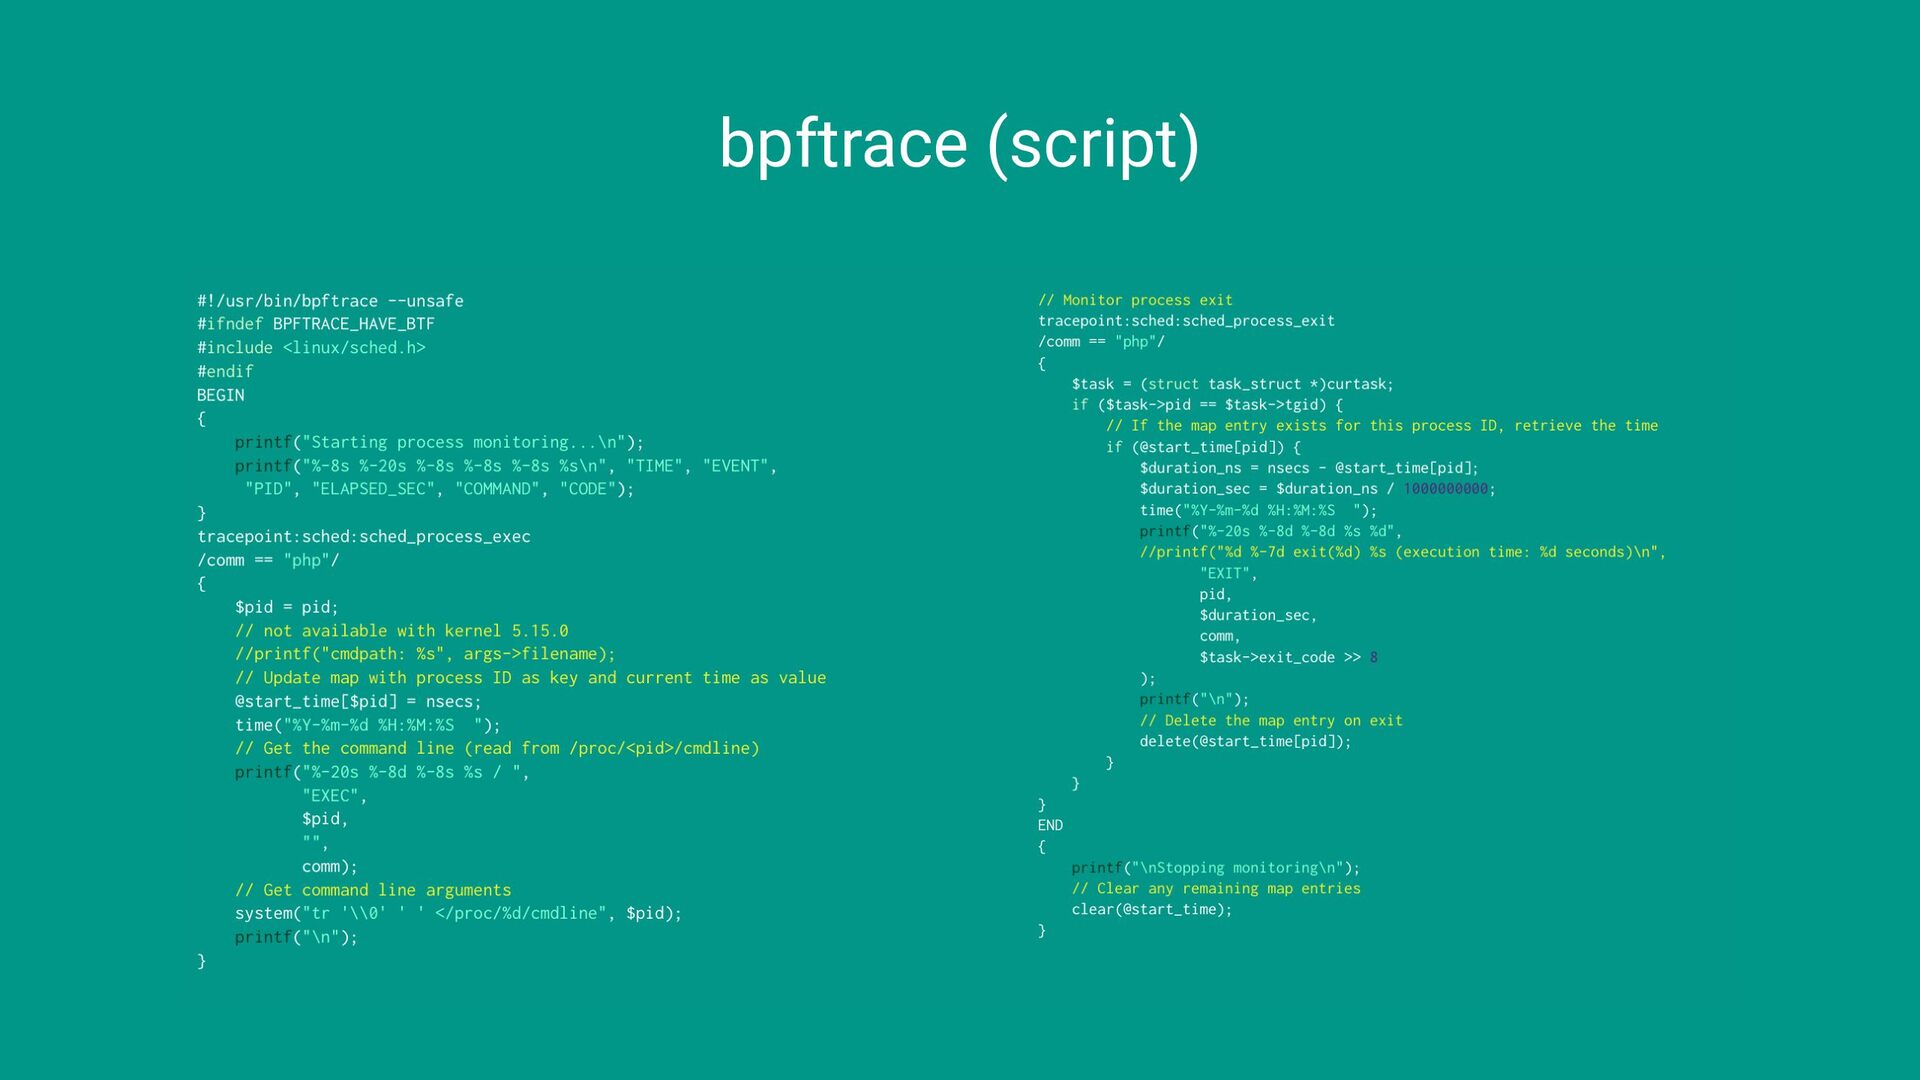
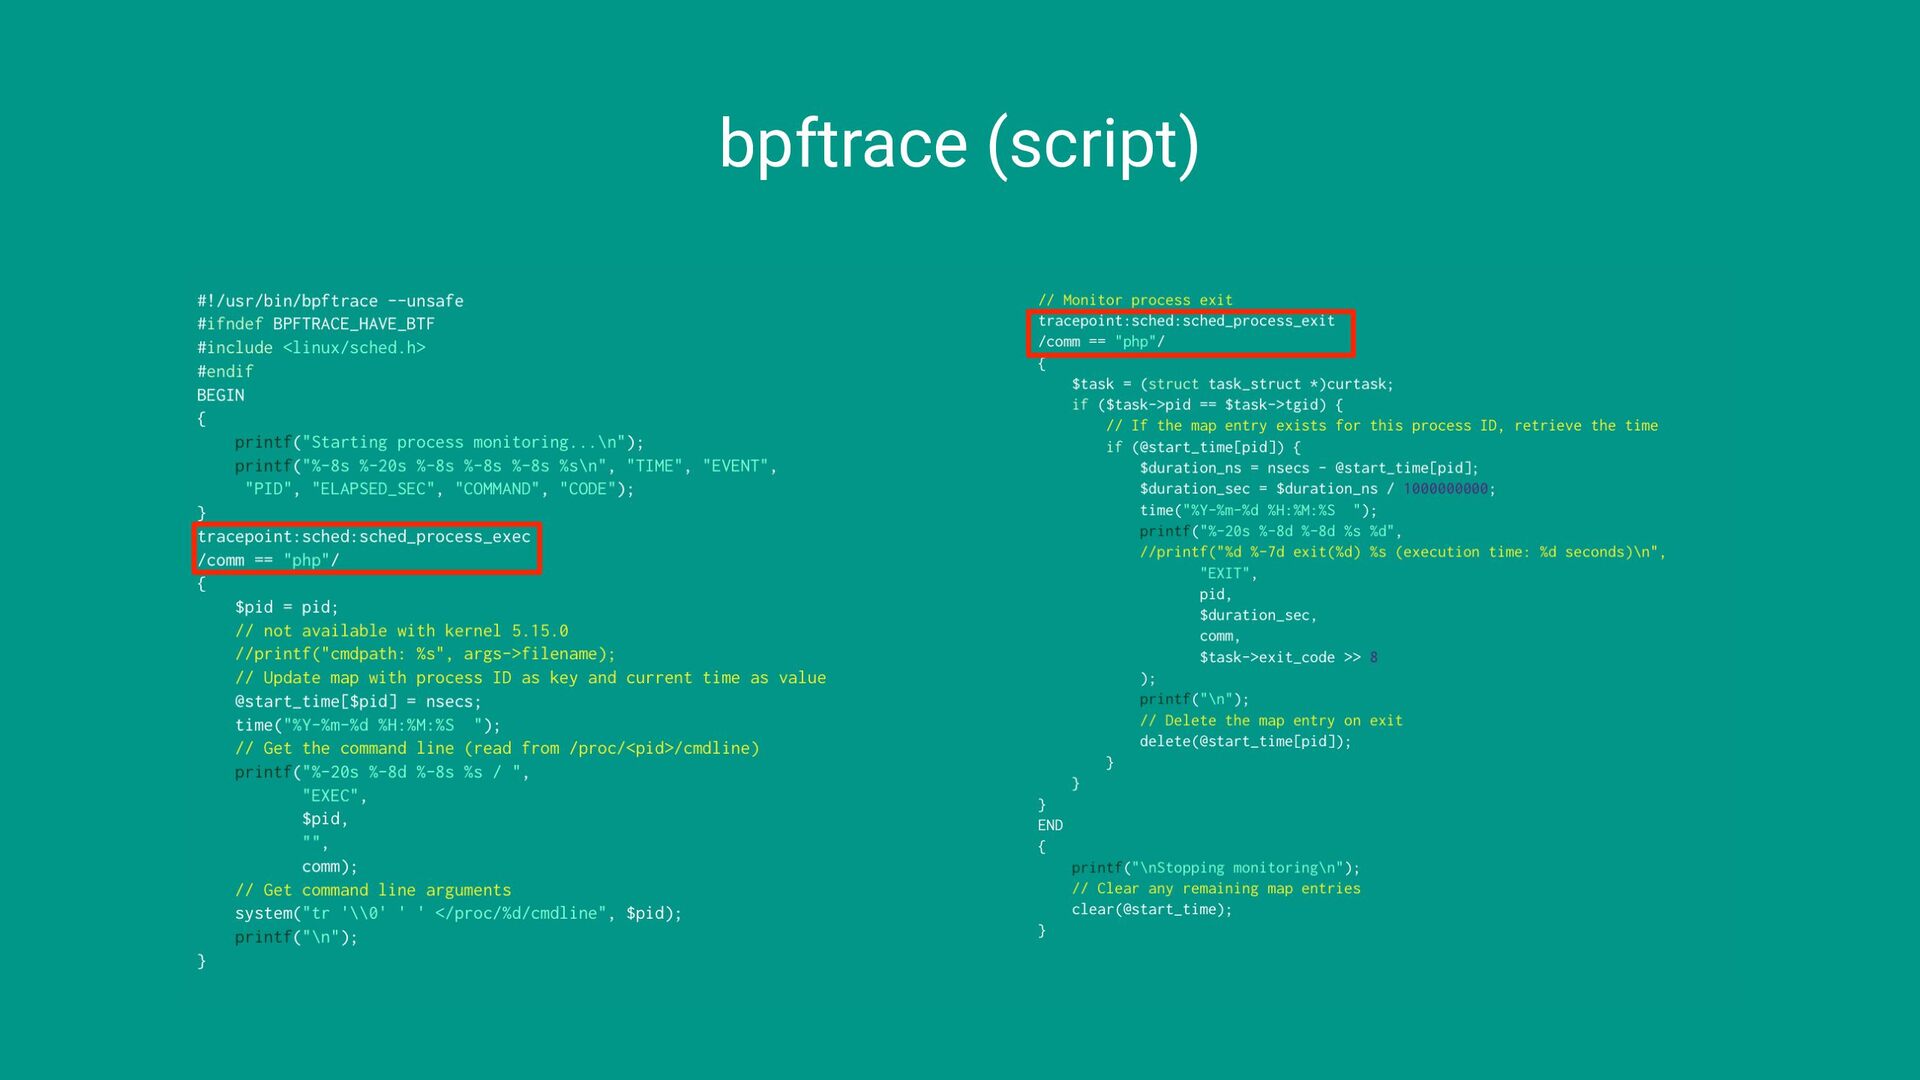
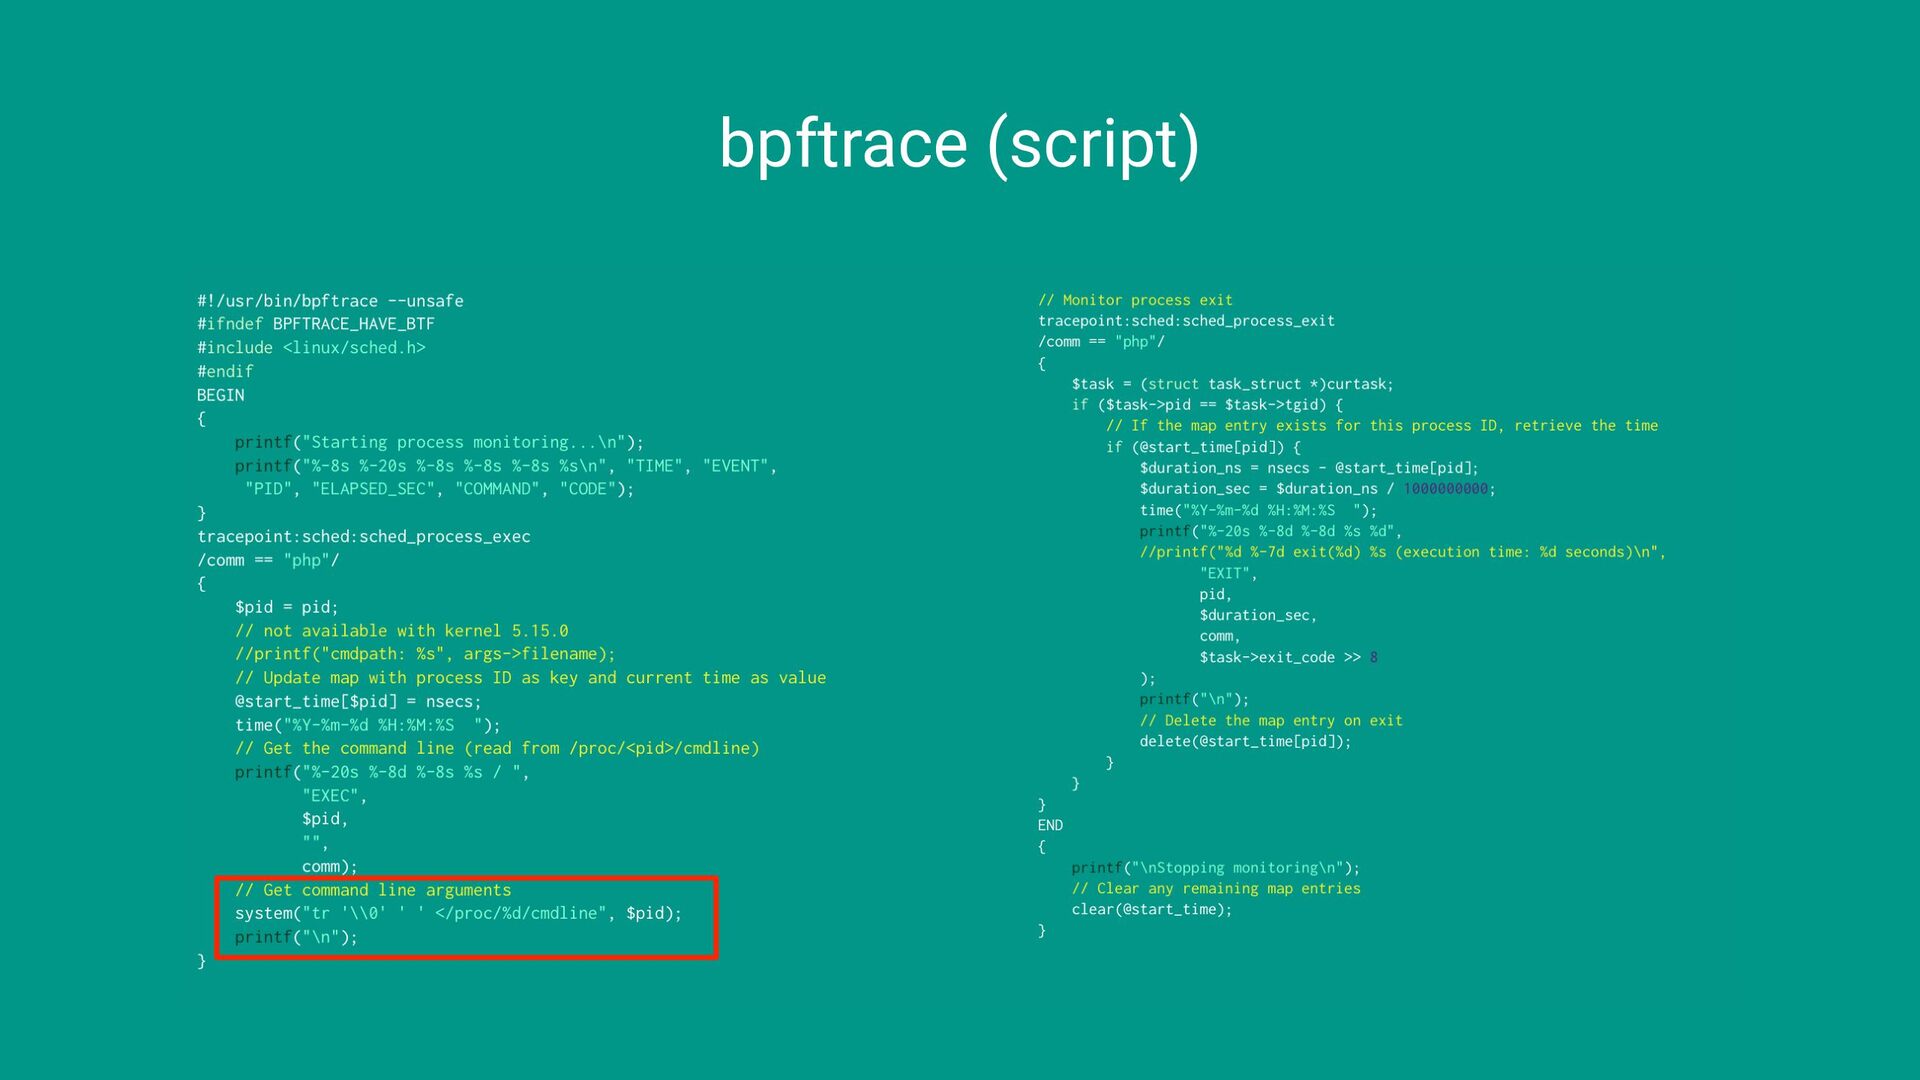
  14. bpftrace • eBPF-based tracing tool with an awk-like language •

    Run as a one-liner or from a script file (.bt) bpftrace is a high-level tracing language for Linux. bpftrace uses LLVM as a backend to compile scripts to eBPF-bytecode and makes use of libbpf and bcc for interacting with the Linux BPF subsystem, as well as existing Linux tracing capabilities: kernel dynamic tracing (kprobes), user-level dynamic tracing (uprobes), tracepoints, etc. The bpftrace language is inspired by awk, C, and predecessor tracers such as DTrace and SystemTap.3 3 https://github.com/bpftrace/bpftrace
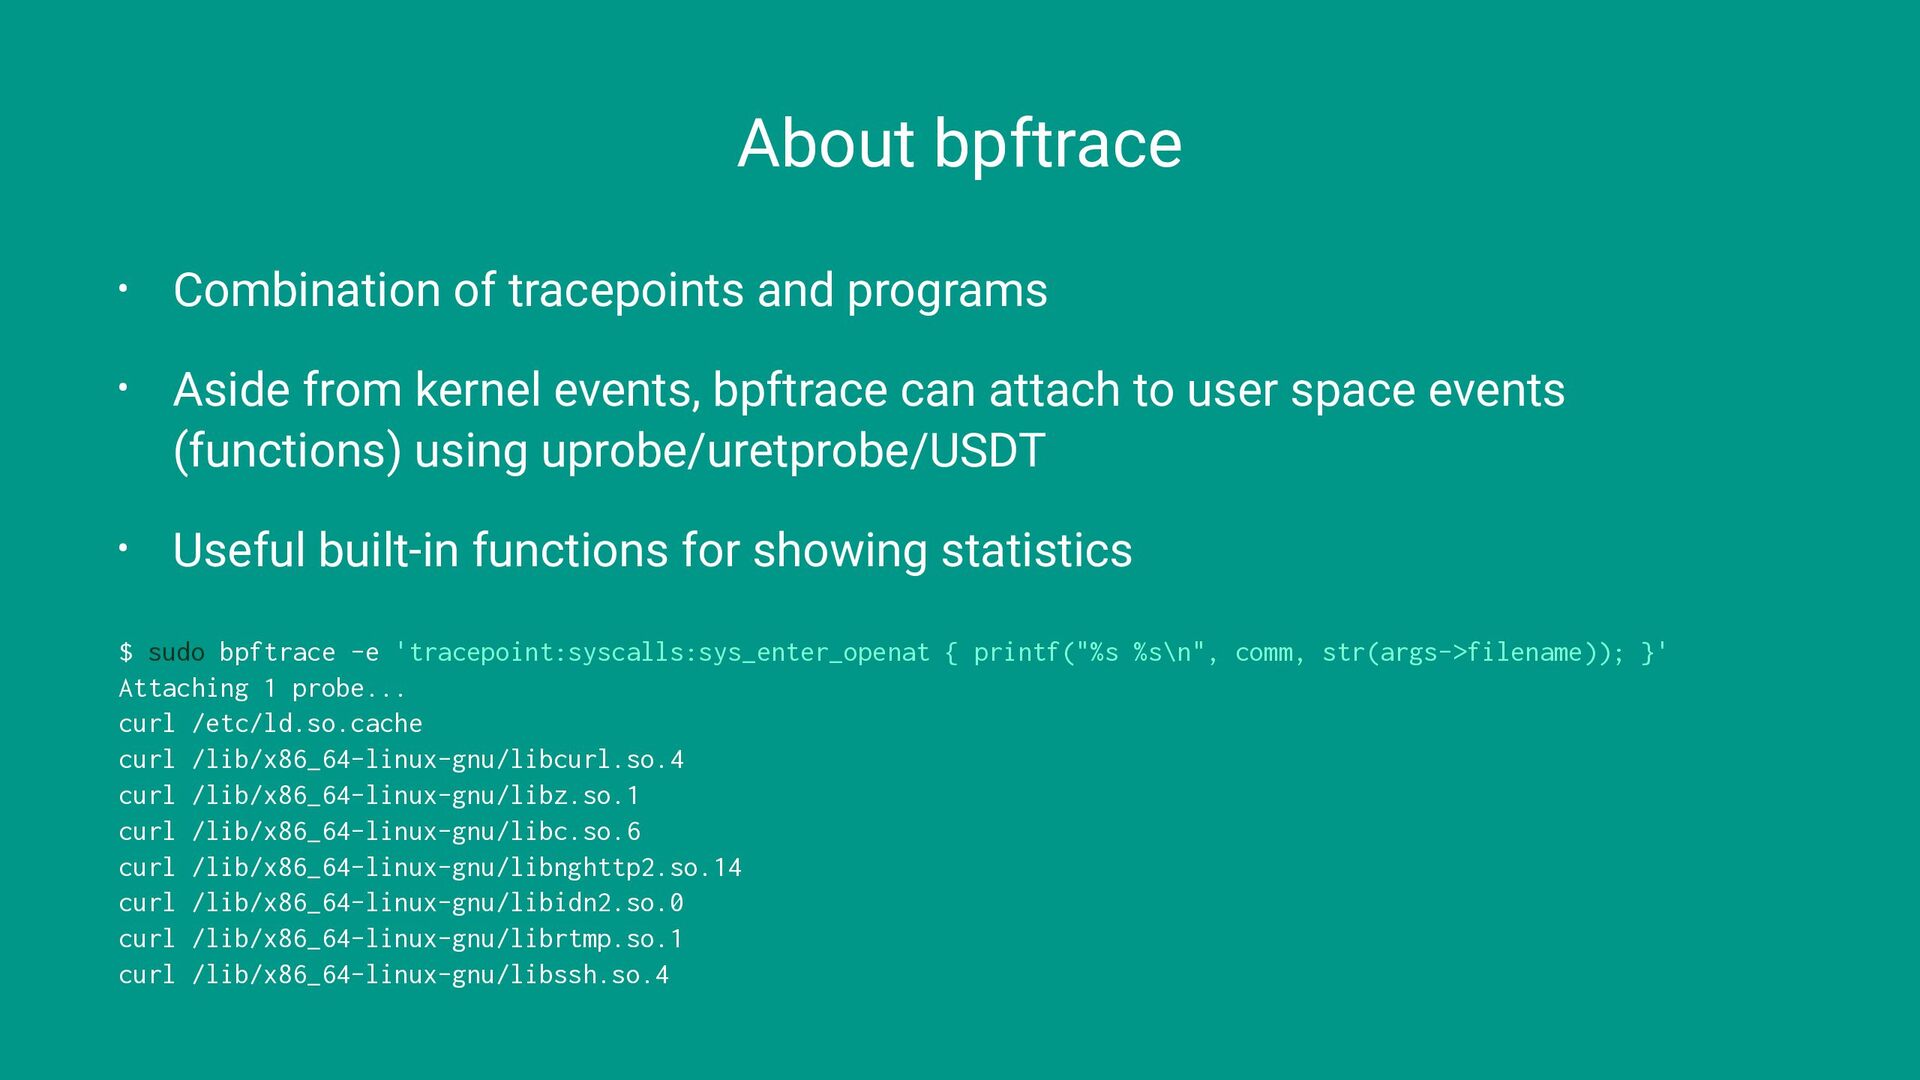
  15. About bpftrace • Combination of tracepoints and programs • Aside

    from kernel events, bpftrace can attach to user space events (functions) using uprobe/uretprobe/USDT • Useful built-in functions for showing statistics $ sudo bpftrace -e 'tracepoint:syscalls:sys_enter_openat { printf("%s %s\n", comm, str(args->filename)); }' Attaching 1 probe... curl /etc/ld.so.cache curl /lib/x86_64-linux-gnu/libcurl.so.4 curl /lib/x86_64-linux-gnu/libz.so.1 curl /lib/x86_64-linux-gnu/libc.so.6 curl /lib/x86_64-linux-gnu/libnghttp2.so.14 curl /lib/x86_64-linux-gnu/libidn2.so.0 curl /lib/x86_64-linux-gnu/librtmp.so.1 curl /lib/x86_64-linux-gnu/libssh.so.4
  16. Recap • eBPF can be used for solving issues in

    the PHP world • bpftrace provides a simple interface as an investigation tool • You can write your own tool with eBPF to solve specific problems
  17. Recap • Now a bpftrace example is part of the

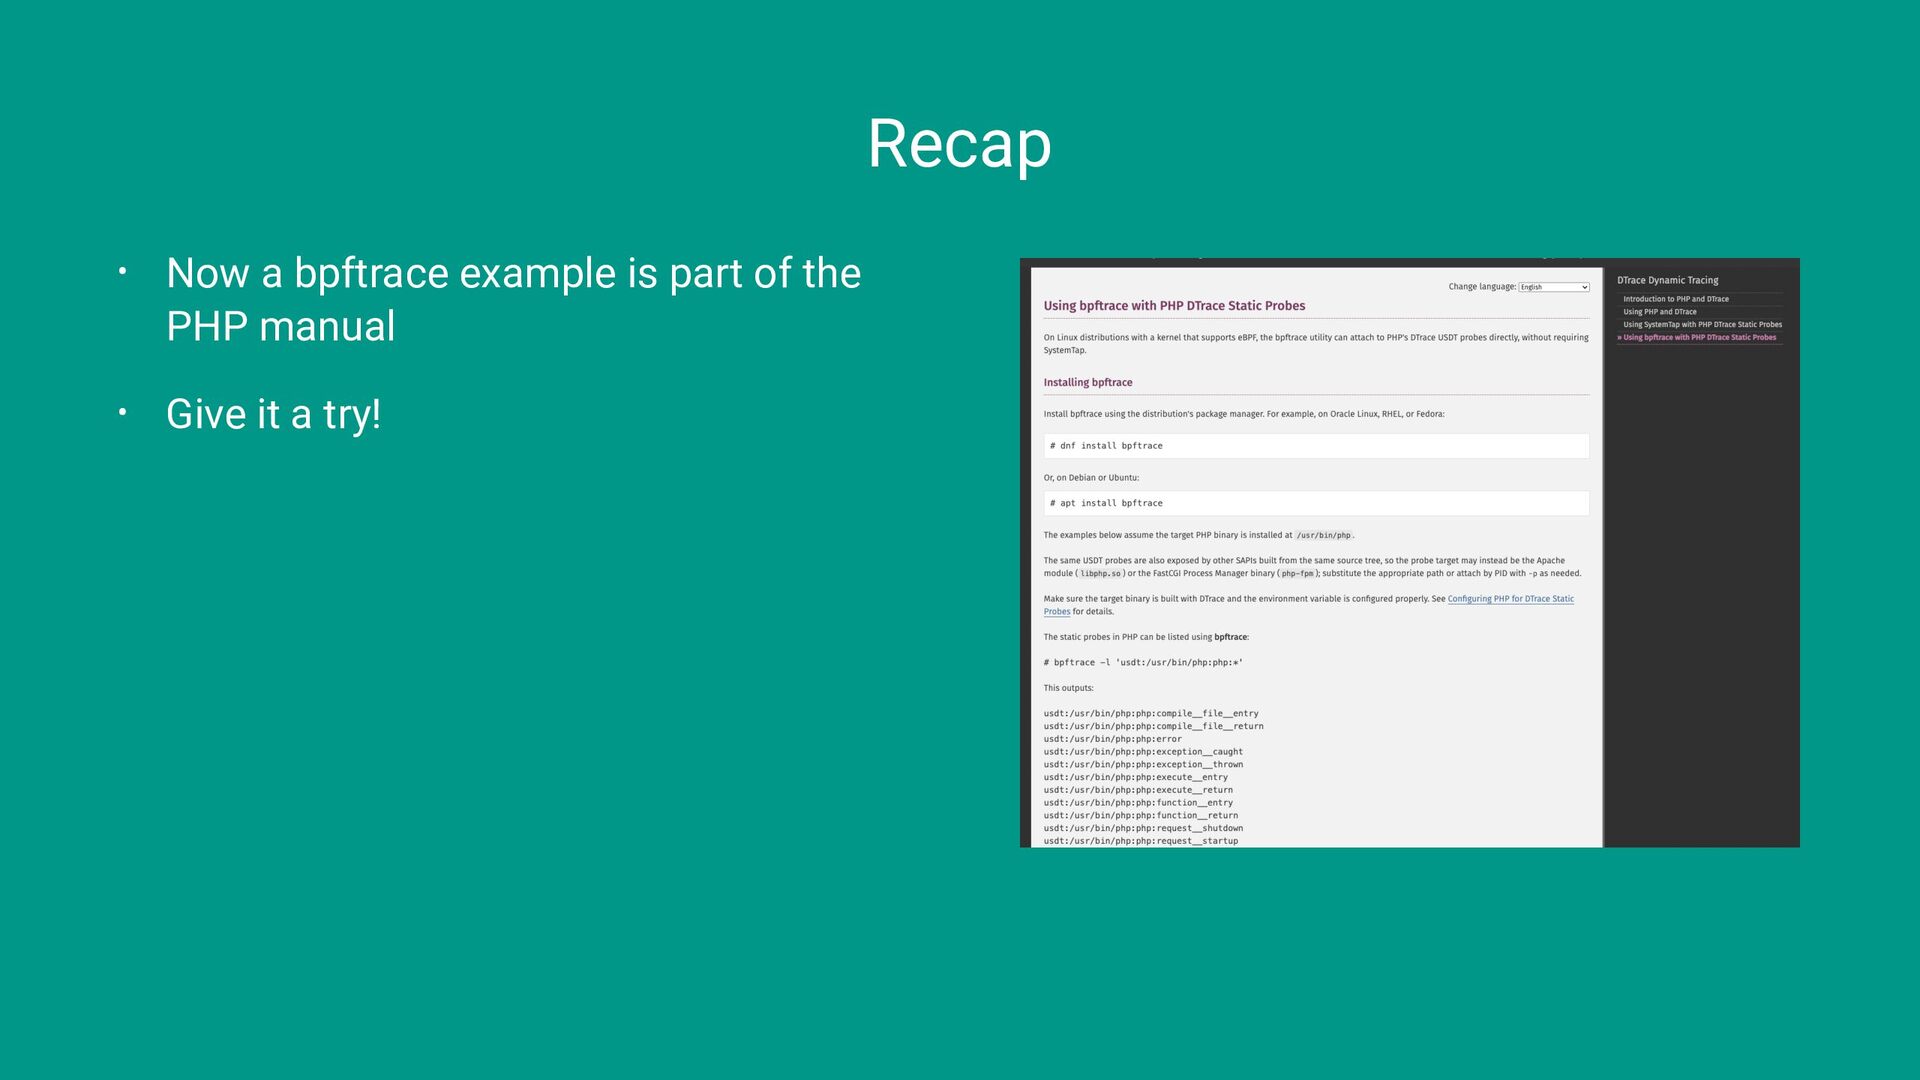
    PHP manual • Give it a try!