Quit Yammer(ing) Away & Start Analyzing Your Log Data!
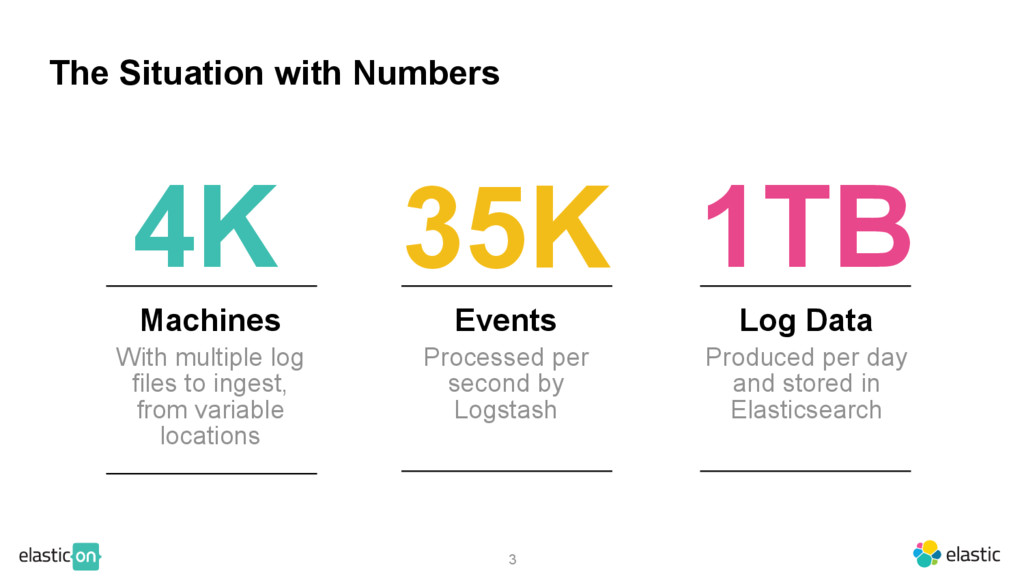
Hear how Yammer ships logs from over 4,000 servers to Elasticsearch, Logstash, and Kibana for production on-call support, monitoring, and analytics, accelerating incident detection and helping to identify trends over time.
Berkeley ‒ Software Engineer at Microsoft ‒ Tech Lead for Log Aggregation at Yammer • About Yammer ‒ Enterprise social network ‒ Global engineering teams committing code ‒ Millions of users WHO ARE YOU???
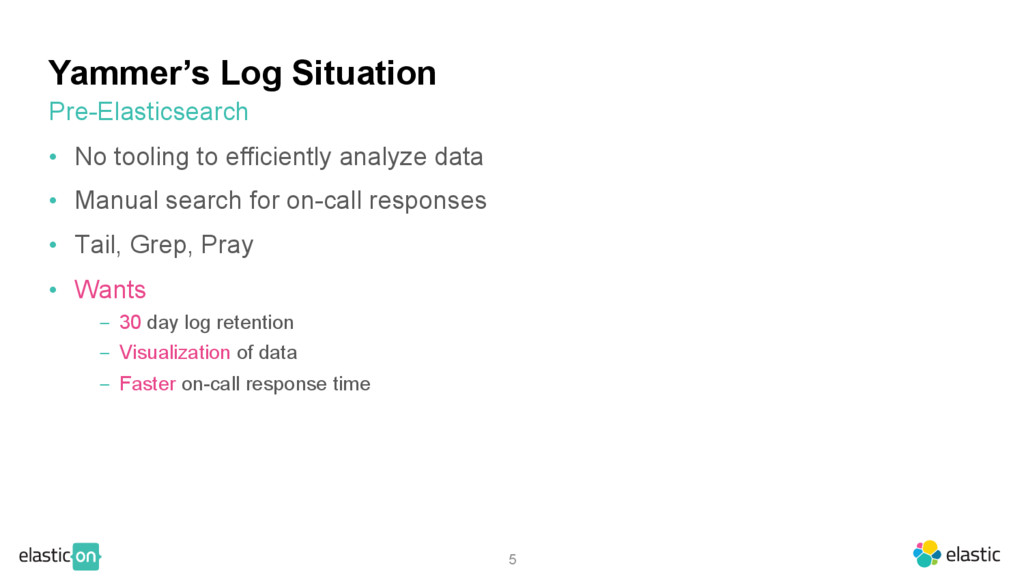
data • Manual search for on-call responses • Tail, Grep, Pray • Wants ‒ 30 day log retention ‒ Visualization of data ‒ Faster on-call response time Pre-Elasticsearch
for log aggregation at Yammer • Demonstrated functionality of Logstash in extracting fields from logs • Demonstrated scalability of ES & effective visualizations in Kibana Attempt and Result
for log aggregation at Yammer • Demonstrated functionality of Logstash in extracting fields from logs • Demonstrated scalability of ES & effective visualizations in Kibana • Poorly received; not well planned out ‒ Improperly scaled (disk space), unaware of size of incoming data ‒ Pipeline held up at many points, resulted in backpressure, long delays Attempt and Result
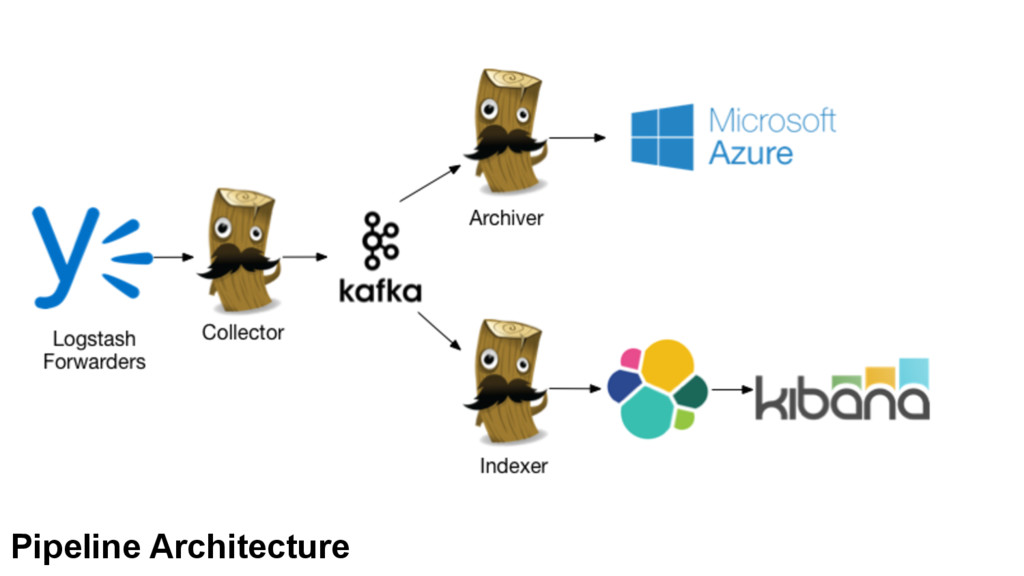
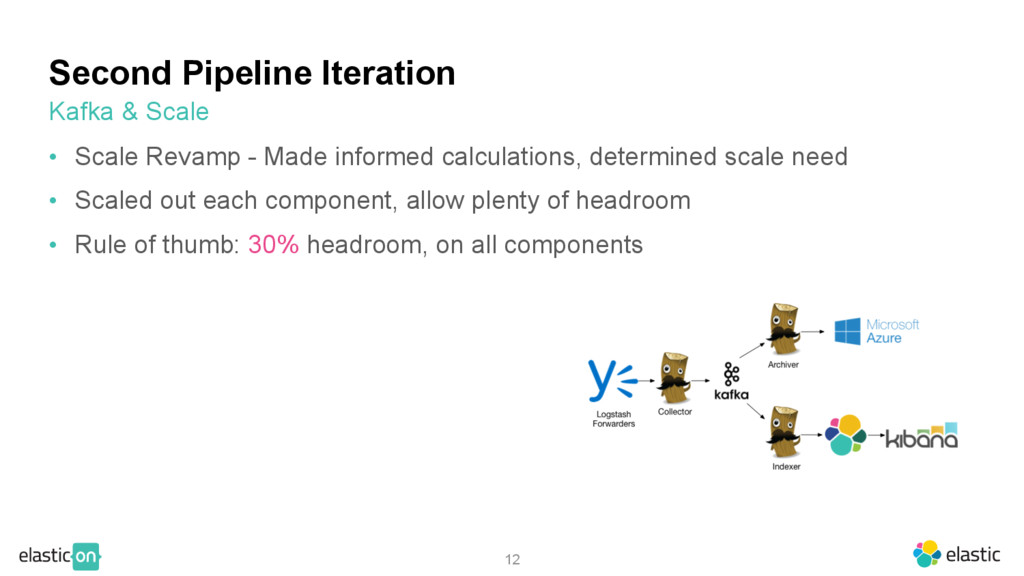
calculations, determined scale need • Scaled out each component, allow plenty of headroom • Rule of thumb: 30% headroom, on all components Kafka & Scale
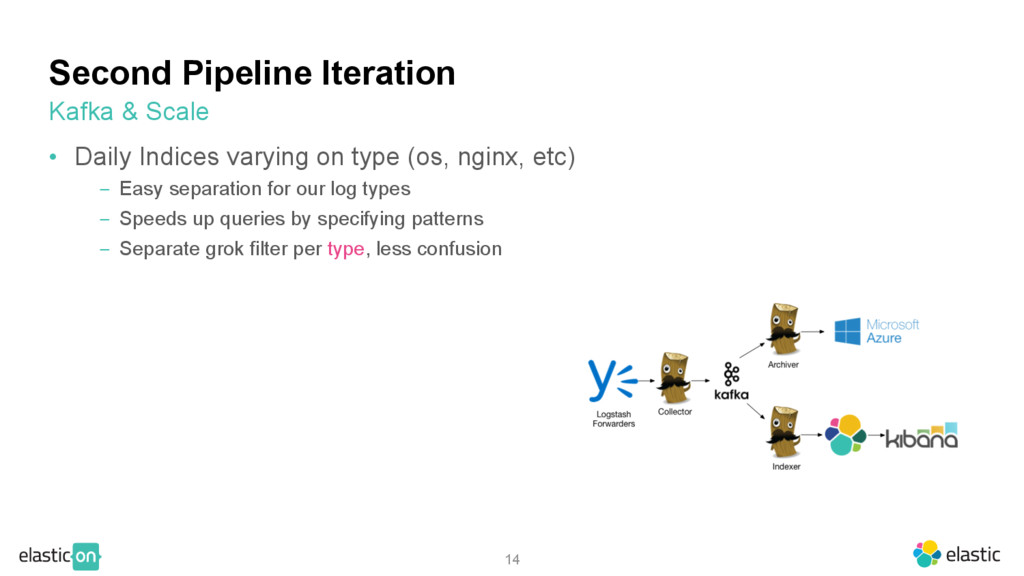
(os, nginx, etc) ‒ Easy separation for our log types ‒ Speeds up queries by specifying patterns ‒ Separate grok filter per type, less confusion Kafka & Scale
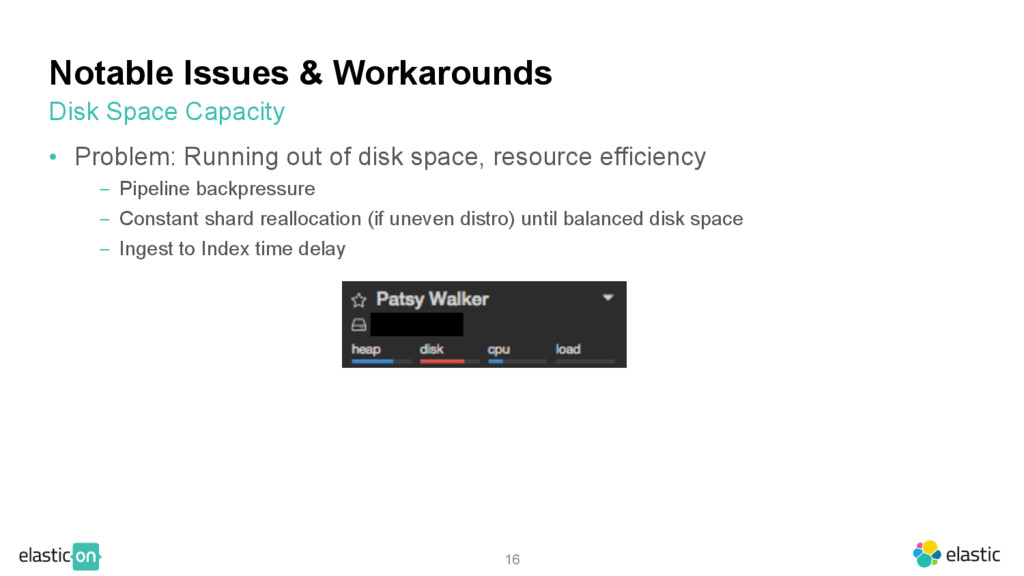
disk space, resource efficiency ‒ Pipeline backpressure ‒ Constant shard reallocation (if uneven distro) until balanced disk space ‒ Ingest to Index time delay Disk Space Capacity
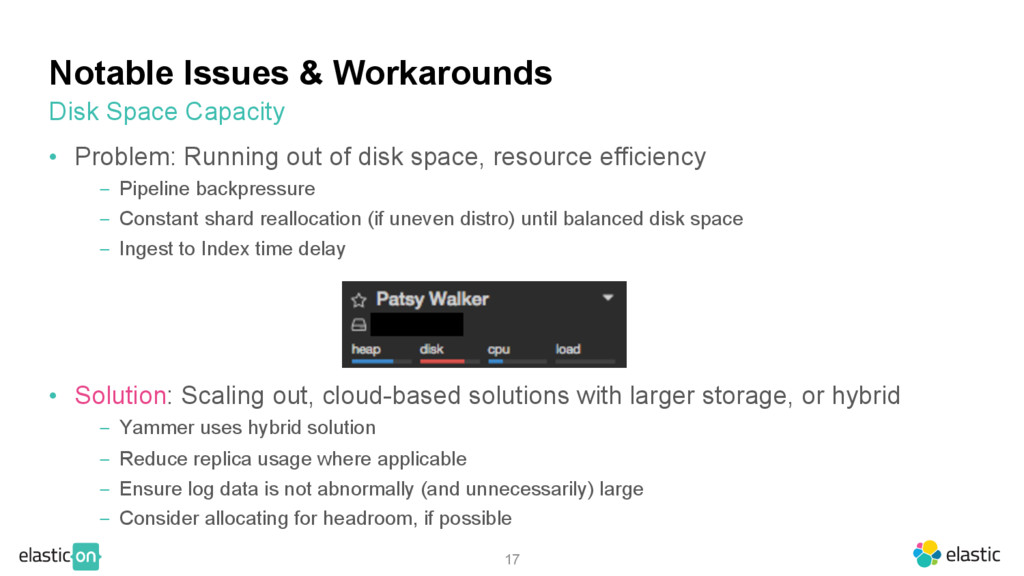
disk space, resource efficiency ‒ Pipeline backpressure ‒ Constant shard reallocation (if uneven distro) until balanced disk space ‒ Ingest to Index time delay • Solution: Scaling out, cloud-based solutions with larger storage, or hybrid ‒ Yammer uses hybrid solution ‒ Reduce replica usage where applicable ‒ Ensure log data is not abnormally (and unnecessarily) large ‒ Consider allocating for headroom, if possible Disk Space Capacity
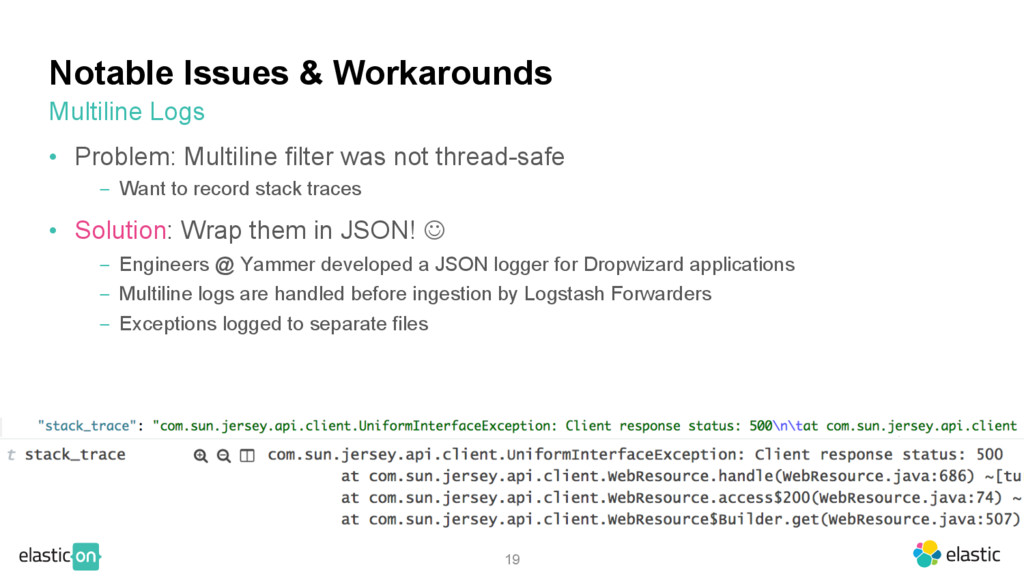
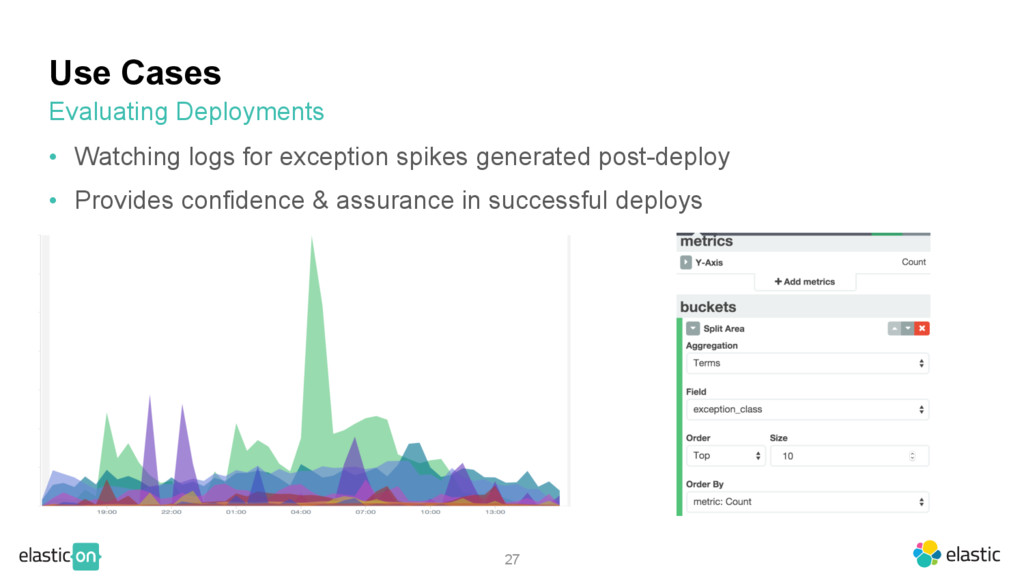
not thread-safe ‒ Want to record stack traces • Solution: Wrap them in JSON! J ‒ Engineers @ Yammer developed a JSON logger for Dropwizard applications ‒ Multiline logs are handled before ingestion by Logstash Forwarders ‒ Exceptions logged to separate files Multiline Logs
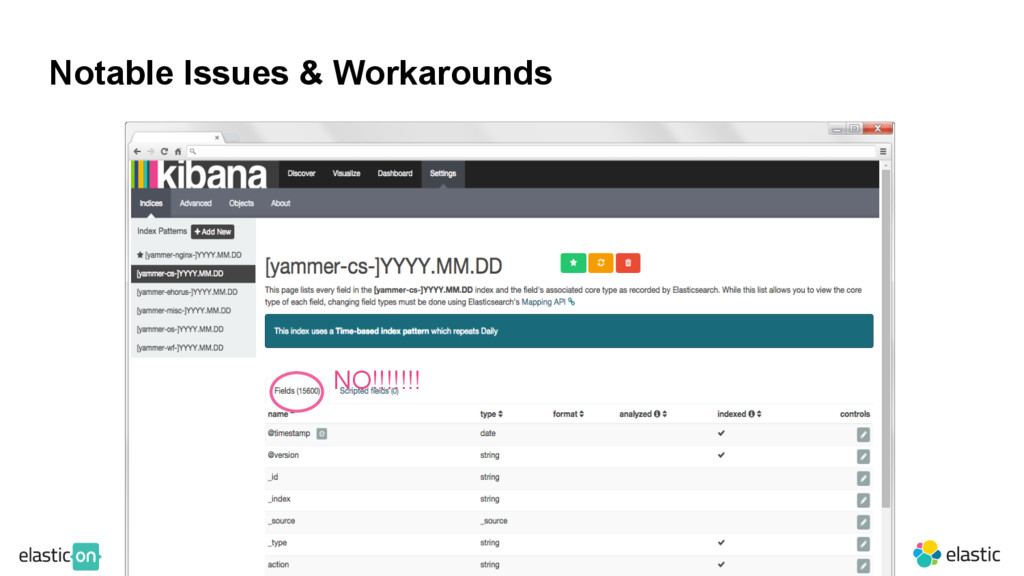
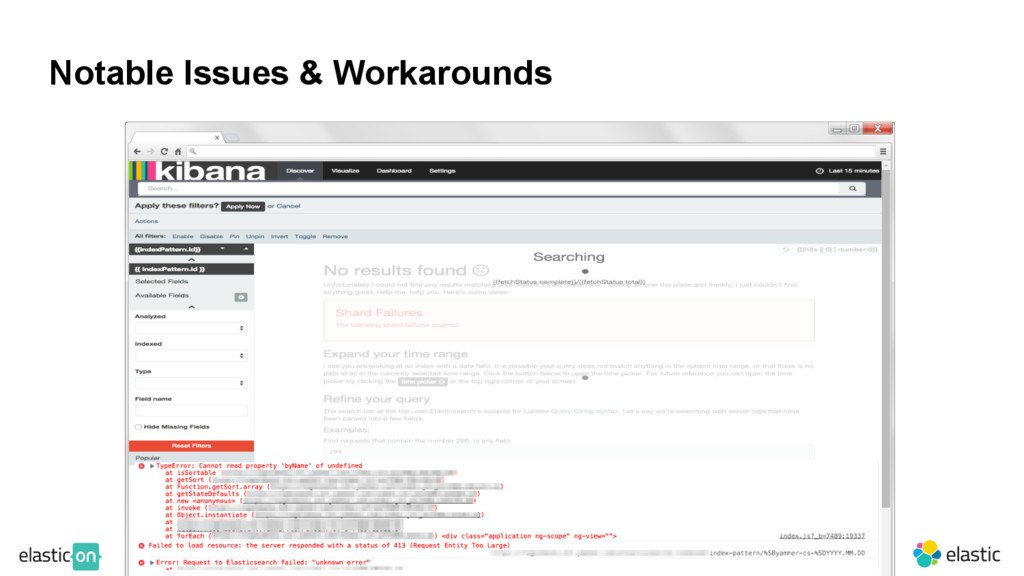
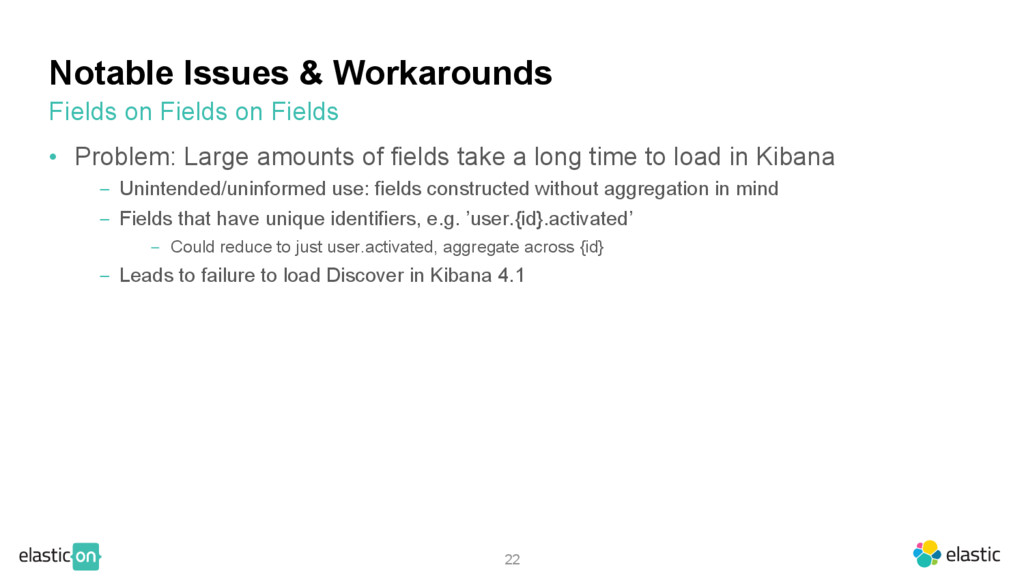
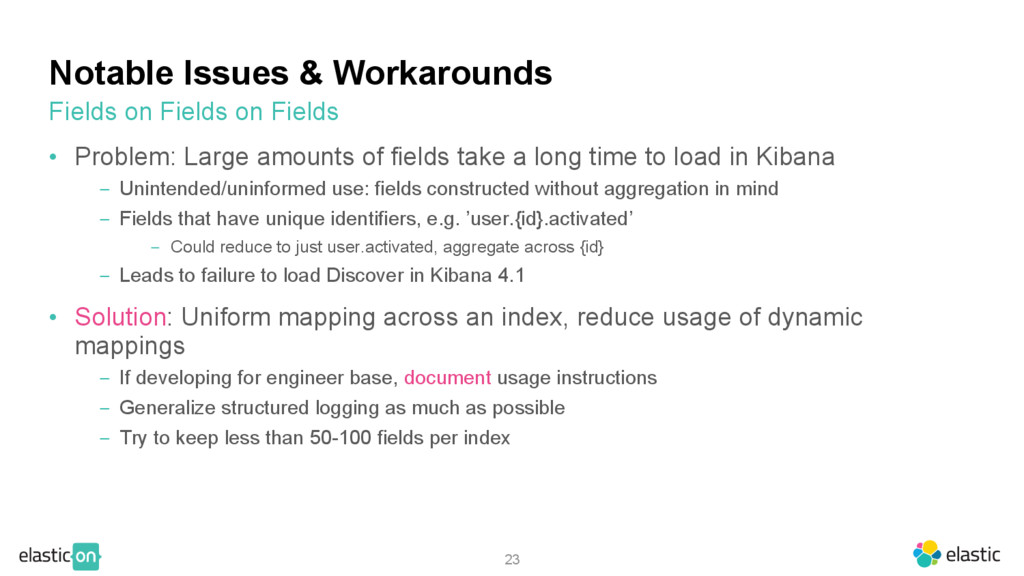
fields take a long time to load in Kibana ‒ Unintended/uninformed use: fields constructed without aggregation in mind ‒ Fields that have unique identifiers, e.g. ’user.{id}.activated’ ‒ Could reduce to just user.activated, aggregate across {id} ‒ Leads to failure to load Discover in Kibana 4.1 Fields on Fields on Fields
fields take a long time to load in Kibana ‒ Unintended/uninformed use: fields constructed without aggregation in mind ‒ Fields that have unique identifiers, e.g. ’user.{id}.activated’ ‒ Could reduce to just user.activated, aggregate across {id} ‒ Leads to failure to load Discover in Kibana 4.1 • Solution: Uniform mapping across an index, reduce usage of dynamic mappings ‒ If developing for engineer base, document usage instructions ‒ Generalize structured logging as much as possible ‒ Try to keep less than 50-100 fields per index Fields on Fields on Fields
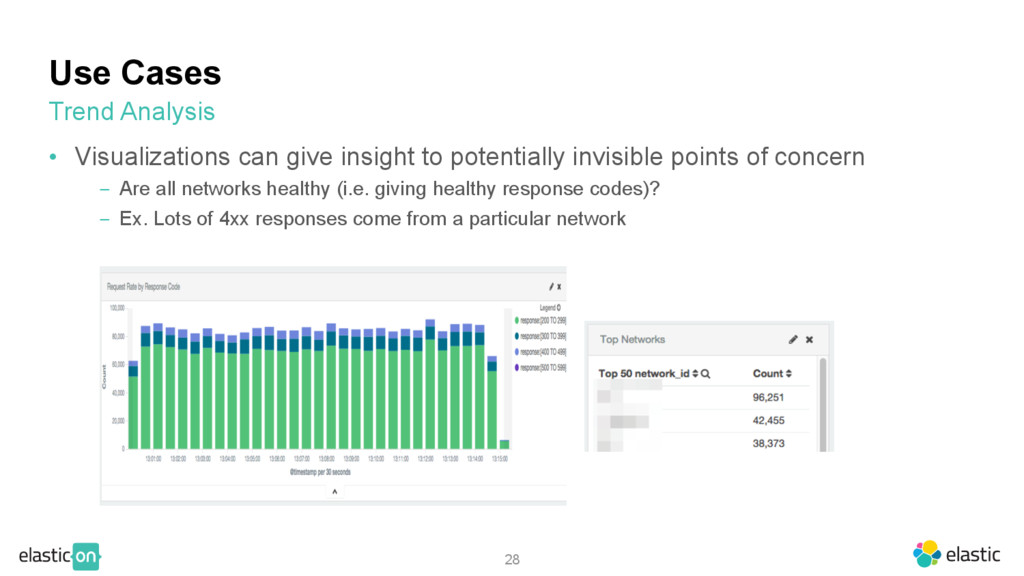
invisible points of concern ‒ Are all networks healthy (i.e. giving healthy response codes)? ‒ Ex. Lots of 4xx responses come from a particular network Trend Analysis
![32 Thanks for listening! Jeffrey Zeng [email protected]](https://files.speakerdeck.com/presentations/ac7da058242d44deb3d3db02fb3324b1/slide_31.jpg)