Upgrade to Pro — share decks privately, control downloads, hide ads and more …

Training: From Ingestion to Analysis – How to Make the Elastic Stack Work for You

Elastic Co
October 19, 2016

Training: From Ingestion to Analysis – How to Make the Elastic Stack Work for You

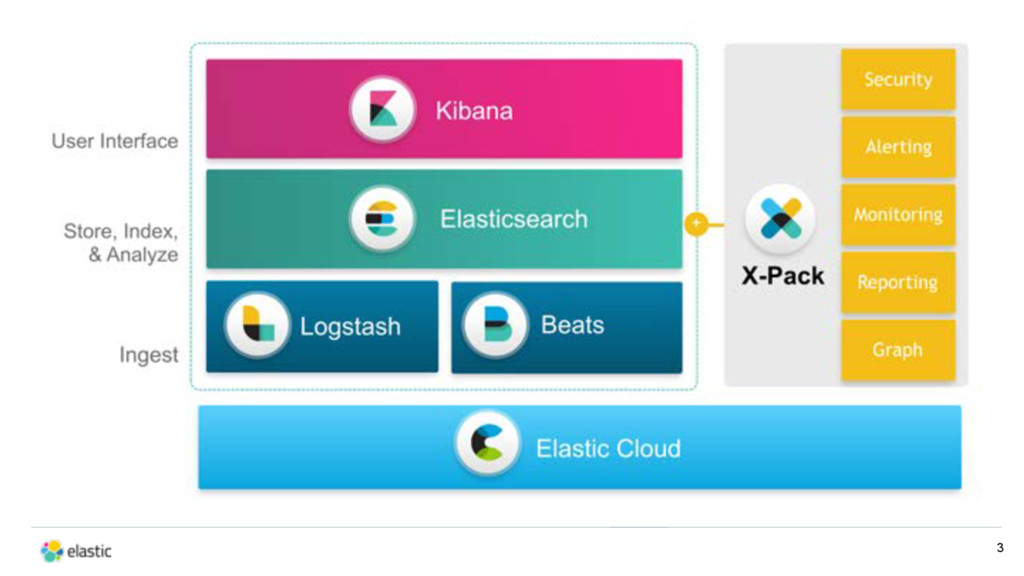
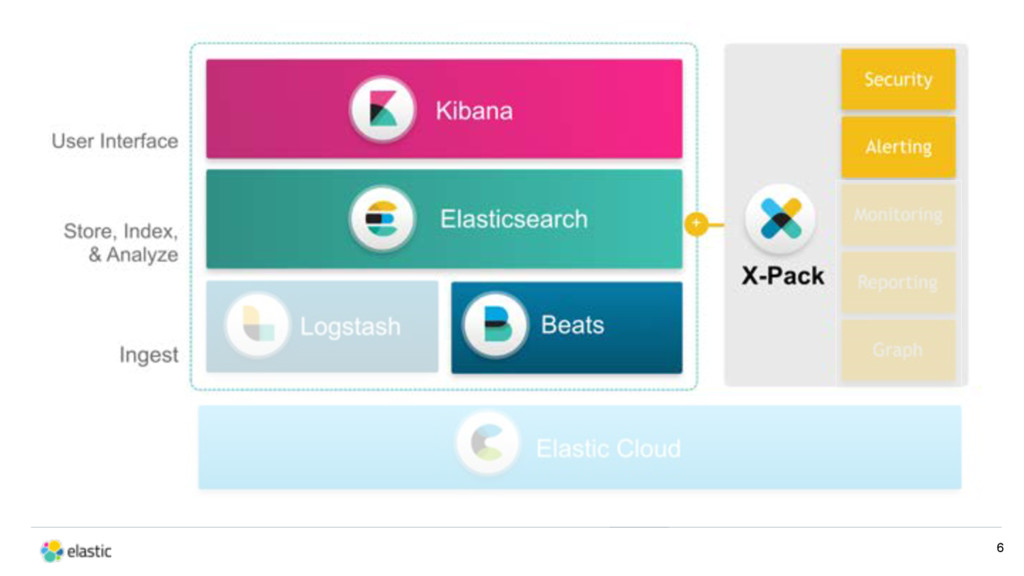
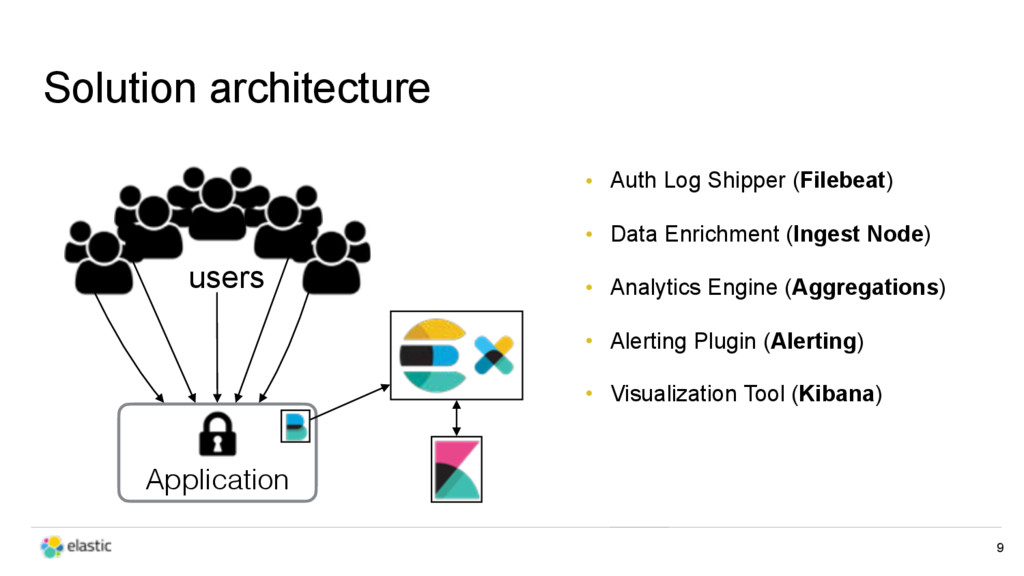
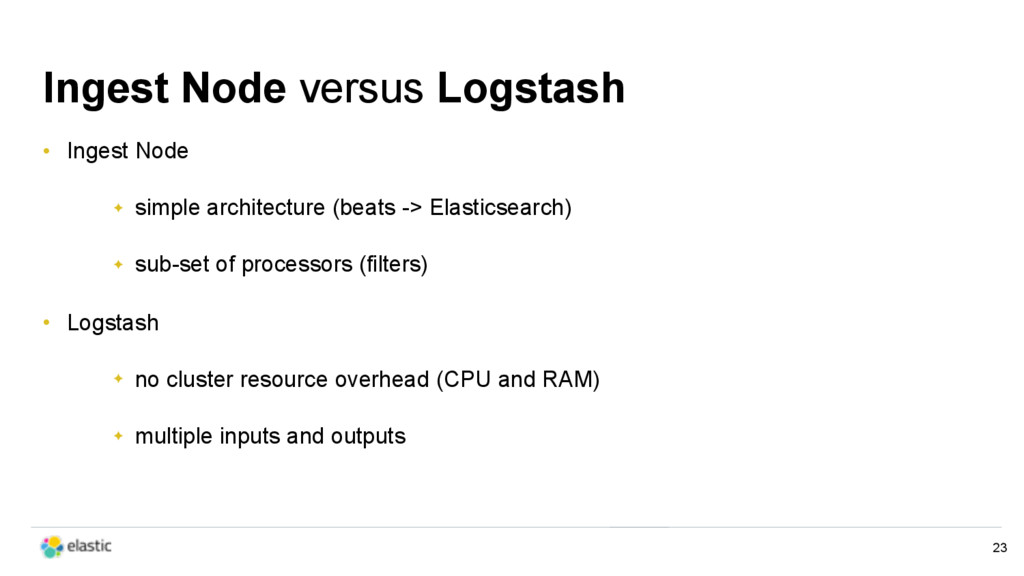
Now that you know the latest features of the Elastic Stack, how do you put them into action? When do you use Beats, when do you use Logstash, and when is ingest node the best way to go? In a combination of slides + live demos, our world-class trainers will go through a step-by-step process on how to architect the Elastic Stack for a few of our most popular use cases.

Elastic Co

October 19, 2016
Tweet

More Decks by Elastic Co

Other Decks in Technology

Transcript

  1. From Ingestion to Analysis
 How to make the Elastic Stack

    work for you Nathan Zamecnik, Education Manager 1 October 19th 2016 Chris Earle, Software Engineer
  2. 3

  3. Detecting intrusion through failed logins • Detecting a login pattern

    which is suspicious: • Website, SSH, Elasticsearch, ... • Alert if a user fails to login more than X times in a row, followed by a successful login. • Products used: Filebeat, Elasticsearch, Kibana • Features used: Ingest Node, Alerting, Pipeline Aggregations, Custom Visualization 5
  4. 6

  5. Solution architecture • Visualization Tool (Kibana) 9 users Application •

    Auth Log Shipper (Filebeat) • Data Enrichment (Ingest Node) • Analytics Engine (Aggregations) • Alerting Plugin (Alerting)
  6. Alerting • Schedule • Query • Condition • Action 10

    How often? Which documents or values? Do they meet the criteria? If yes, what should we do?
  7. Alerting on intrusions • Schedule • Query • Condition •

    Action 11 Every 5 seconds. The number of logins per user_host in the last 5 minutes. Does the user_host have more than 3 failures followed by a success? If yes, create a new document confirming the attack to user_host.
  8. Demo: • SSH login attacks • 1 Linux machine with

    Filebeat collecting auth logs • 1 Elasticsearch host receiving auth logs and executing Alerting • 1 Kibana host to serve visualizations and dashboards • Script that logs in with different users (95% success and 5% failure) • Script that simulates a brute force until success (random number of retries) 12
  9. Indices • auth-yyyy-MM-dd, all login attempts • auth-detection, successful logins

    after X failures (probably an attack) 13 green open auth-detection 1 0 18 0 45.2kb 45.2kb green open auth-2016.09.25 1 0 637 0 227kb 227kb green open auth-2016.09.09 1 0 278 0 101.4kb 101.4kb green open auth-2016.09.21 1 0 147 0 100.4kb 100.4kb green open auth-2016.09.22 1 0 52 0 73kb 73kb green open auth-2016.09.08 1 0 278 0 85.7kb 85.7kb green open auth-2016.09.24 1 0 909 0 300kb 300kb green open auth-2016.09.26 1 0 250 0 135.7kb 135.7kb green open auth-2016.09.28 1 0 14 0 43.2kb 43.2kb green open auth-2016.09.27 1 0 1290 0 358.8kb 358.8kb
  10. Data model tricks • Concatenate fields "user" and "host" into

    a new field "user_host" ✦ Uses more storage but makes aggregations easier to write and faster • Add a new field "threat_score" during ingestion (Ingest Node) based on the login ✦ accepted -> 0, invalid_user -> 1, failed -> 2 ✦ accepted_attack_confirmed -> 4, added by Alerting 16
  11. Data model tricks • Attack overlap ✦ attack documents can

    be generated many times for the same attack (Alerting freq) ✦ we set the attack document timestamp to the successful login timestamp ✦ no duplicates in the visualization ✦ easier than setting the same document id 17
  12. Extra Visualization • Swimlane (https://github.com/prelert/kibana-swimlane-vis) • Created by Prelert, available

    on May 18th 2016 • Installed as a plugin in Kibana and available as a visualization 18
  13. What if the application grows? • From one application server

    to multiple servers: ✦ add one filebeat per application server ✦ alert based on attempts to the same server (current) ✦ alert based on all attempts, regardless of the server (small aggregation change) 20
  14. Scaling the Elastic Stack • Ingest node vs. Logstash •

    Dedicated ingest node • Alerting vs. Cronjob • Alerting frequency: 5 vs. 60 seconds 22
  15. Ingest Node versus Logstash • Ingest Node ✦ simple architecture

    (beats -> Elasticsearch) ✦ sub-set of processors (filters) • Logstash ✦ no cluster resource overhead (CPU and RAM) ✦ multiple inputs and outputs 23
  16. Dedicated Ingest Node? • No performance overhead on data nodes

    • Tightly coupled to Elasticsearch • Centralized configuration • Not as flexible and powerful as Logstash (archiving, e.g. S3) 24
  17. Alerting versus Cronjob • No separate process/system to setup •

    Highly Available • Built-in actions • Execution History • API Driven • Maintained by Elastic 25
  18. Alerting frequency: 5 or 60 seconds • What is your

    hard requirement? • How expensive is the Alerting aggregation? • How many new documents are indexed per execution? • How expensive is the Alerting query? 26
  19. How expensive is the Alerting query? 27 GET auth-*/auth_log/_search {

    "query": { "bool": { "filter": [ { "range": { "@timestamp": { "gte": "now-5m"}}}, { "terms": { "access": [ "accepted", "failed" ]}}, { "exists": { "field": "user_host" }} ] } } }
  20. How expensive is the Alerting query? 28 Range filter for

    the last 5 minutes GET auth-*/auth_log/_search { "range": { "@timestamp": { "gte": "now-5m"}}}, Every shard of every index that starts with auth- But only events in the last five minutes
  21. Query executes in all indices 29 auth-2016-10-01 [now-5m TO now)

    ... auth-2016-10-05 auth-2016-10-06 [now-5m TO now) [now-5m TO now) Query ... There are no matching documents in those indices!
  22. Elasticsearch re-writes it to optimize execution 30 auth-2016-10-01 [now-5m to

    now) ... auth-2016-10-05 auth-2016-10-06 Query ... MatchNoDocsQuery [now-5m TO now) [now-5m TO now)
  23. This is also used in queries from Kibana 31 auth-2016-10-04

    [now-3d TO now) auth-2016-10-05 auth-2016-10-06 Query [now-3d TO now) auth-2016-10-03 [* TO *] [* TO *] [now-3d TO now) These can be cached
  24. What if you have too many indices? • 1 year

    of data with 1 index per day • One should not go into 365 indices if only 2 are needed • Better ways to solve: ✦ Aliases ๏ create an alias pointing to the last two days ✦ Date math support in index names ๏ /<auth-{now/d-1d}>,<auth-{now/d}>/_search 32
  25. Alerting on known threats • Detect when a desktop/server connects

    to a known threat • Alert on current and retrospective events as threat list is updated • Products used: Packetbeat, Logstash, Elasticsearch, Kibana • Features: Alerting, Aggregations, Percolator, Elasticsearch filter for Logstash 35
  26. 36

  27. Percolator • "Search Reversed" ✦ stores queries and verifies if

    a given document matches any stored query • Used to classify a request as threat or not 39 { "bytes_in": 78, "type": "http", "client_port": 33626, "path": "/", "threat_analyzed_values": "212.65.21.132, www.alieninvasion.com", ...} [ "threat_1", "threat_3", ... ]
  28. Demo: • SSH login attacks • 1 Linux machine with

    Packetbeat collecting tcp requests • 1 Logstash host receiving Packetbeat info, enriching and sending to Elasticsearch • 1 Elasticsearch host receiving requests and executing Alerting • 1 Kibana host to serve visualizations and dashboards • Scripts that access a known and a new threat 40
  29. Indices • threats-yyyy-MM-dd, all known threats as percolate queries •

    packetbeat-yyyy-MM-dd, requests to hosts 41 green open threats-2016.08.09 1 0 15 0 40kb 40kb green open threats-2016.07.30 1 0 50 0 49.1kb 49.1kb green open threats-2016.07.05 1 0 25 0 39.7kb 39.7kb green open threats-2016.08.07 1 0 34 0 46.4kb 46.4kb green open threats-2016.07.04 1 0 30 0 43.3kb 43.3kb green open packetbeat-2016.09.28 1 0 16 0 69.1kb 69.1kb green open packetbeat-2016.09.25 1 0 8 0 28.1kb 28.1kb green open packetbeat-2016.09.21 1 0 87 0 73.7kb 73.7kb green open packetbeat-2016.10.02 1 0 134 0 149.4kb 149.4kb
  30. Alerting on new threats • Schedule • Query • Condition

    • Action 44 Every 60 seconds. All new threats in the last 60 seconds. Is there a threat? If yes, update_by_query old matching requests.
  31. Elasticsearch filter for Logstash • Allows Elasticsearch queries during Logstash

    filtering • Enhanced for this training: ✦ https://github.com/logstash-plugins/logstash-filter-elasticsearch/pull/42 • Allows the use of percolators to classify documents before indexing 45
  32. Percolator strategies • Percolator indices in the main Elasticsearch cluster

    ✦ one single cluster to manage ✦ scales on its own • Percolator indices in a dedicated cluster in Logstash machines ✦ local lookups ✦ scales with Logstash 46
  33. IPv6 • Multi-dimensional points ✦ uses a 1-dimensional kd-tree data

    structure ✦ index and search speedup, and more space-efficient • All IP addresses are now represented as a 128-bits IPv6 address ✦ IPv4s will be translated to an IPv4-mapped IPv6s at index time and converted back ✦ https://www.elastic.co/blog/indexing-ipv6-addresses-in-elasticsearch 47
  34. Except where otherwise noted, this work is licensed under http://creativecommons.org/licenses/by-nd/4.0/

    Creative Commons and the double C in a circle are registered trademarks of Creative Commons in the United States and other countries. Third party marks and brands are the property of their respective holders.