Upgrade to Pro
— share decks privately, control downloads, hide ads and more …
Speaker Deck
Features
Speaker Deck
PRO
Sign in
Sign up for free
Search
Search
Profiling for JVM
Search
Sponsored
·
Ship Features Fearlessly
Turn features on and off without deploys. Used by thousands of Ruby developers.
→
Kengo TODA
October 16, 2012
Technology
290
2
Share
Embed
Copy iframe code
Copy JS code
Copy link
Start on current slide
Profiling for JVM
Simple introduction about how to judge the reason why your Java program is slow
Kengo TODA
October 16, 2012
More Decks by Kengo TODA
See All by Kengo TODA
Kotlin 開発のツラミを爆破した話! / Explode the difficulty of Kotlin dev!
eller86
0
160
生成AI 業務応用向けガイドライン 斜め読み / Overview of Generative AI Business Application Guidelines
eller86
0
200
KotlinユーザのためのJSpecify入門 / JSpecify 101 for Kotlin Devs
eller86
0
2k
JavaとGroovyで書かれたGradleプラグインをKotlinで書き直した話 / Converted a Gradle plugin from Groovy&Java to Kotlin
eller86
0
1.9k
ヒューマンスキル / The Humanskills
eller86
0
770
医療機関向けシステムの信頼性 / Reliability of systems for medical institutions
eller86
0
530
Server-side Kotlinを使うスタートアップでどんなDetektルールが育ったか / Detekt rules made in start-up working with Server-side Kotlin
eller86
0
1.7k
Java開発者向けのKotlin Gradleビルドスクリプト入門 / Gradle Build Script in Kotlin 101
eller86
1
2.2k
Goodbye JSR305, Hello JSpecify!
eller86
2
5.6k
Other Decks in Technology
See All in Technology
Gen3R: 3D Scene Generation Meets Feed-Forward Reconstruction
spatial_ai_network
0
100
[2026-07-15] AI Ready なはずだったアーキテクチャと、見えてきた課題・次に目指す状態
wxyzzz
4
2.2k
ゼロをイチにする仕事が終わったあと
smasato
0
330
Zoom2Youtube.Claude
kawaguti
PRO
3
490
型は壁、Rustでもバグを直すな、表現できなくせよ
nwiizo
13
2k
DatabricksにおけるMCPソリューション
taka_aki
1
200
Empower GenAI with Agile - あなたのアジャイルが生成AIのバフになる仕組み
hageyahhoo
1
160
Amazon EVS で VCF 9.0 / 9.1 のサポート開始まとめ
mtoyoda
0
290
生成AIの活用/high_school2026
okana2ki
0
120
人を動かすのは時間ではなく、納得感 〜新任EMが入社3ヶ月、組織を2回変えた話〜
kakehashi
PRO
3
200
クラウド上のデータ復旧で見落としがちな制約: 医療系 SaaS の BCP 設計から得た教訓
kakehashi
PRO
0
3.2k
Oracle Exadata Database Service on Cloud@Customer X11M (ExaDB-C@C) サービス概要
oracle4engineer
PRO
2
8.4k
Featured
See All Featured
Conquering PDFs: document understanding beyond plain text
inesmontani
PRO
4
2.9k
Dominate Local Search Results - an insider guide to GBP, reviews, and Local SEO
greggifford
PRO
0
210
JavaScript: Past, Present, and Future - NDC Porto 2020
reverentgeek
52
6k
Typedesign – Prime Four
hannesfritz
42
3.1k
The State of eCommerce SEO: How to Win in Today's Products SERPs - #SEOweek
aleyda
2
11k
BBQ
matthewcrist
89
10k
Music & Morning Musume
bryan
47
7.3k
No one is an island. Learnings from fostering a developers community.
thoeni
21
3.8k
Collaborative Software Design: How to facilitate domain modelling decisions
baasie
1
260
Public Speaking Without Barfing On Your Shoes - THAT 2023
reverentgeek
1
460
A Tale of Four Properties
chriscoyier
163
24k
16th Malabo Montpellier Forum Presentation
akademiya2063
PRO
0
180
Transcript
PROFILING FOR JVM How to verify your hypothesis - @eller86
1
Agenda Process to detect the cause of performance problem What
is “profiling”? Tools to profile 2
Process to detect the cause of performance problem Make hypothesis
from experience and knowledge Get Servlet’s log from middle ware like Jetty Read source code, do debugging, do profiling 3
What is “profiling”? where? why? GC storm algorithm CPU Other
reading code heap dump I/O Lock? Waiting other system? I/O GC Other thread dump IZQPUIFTJT WFSJpDBUJPO 4
Tools to profile jmap jstack jstat VisualVM 5
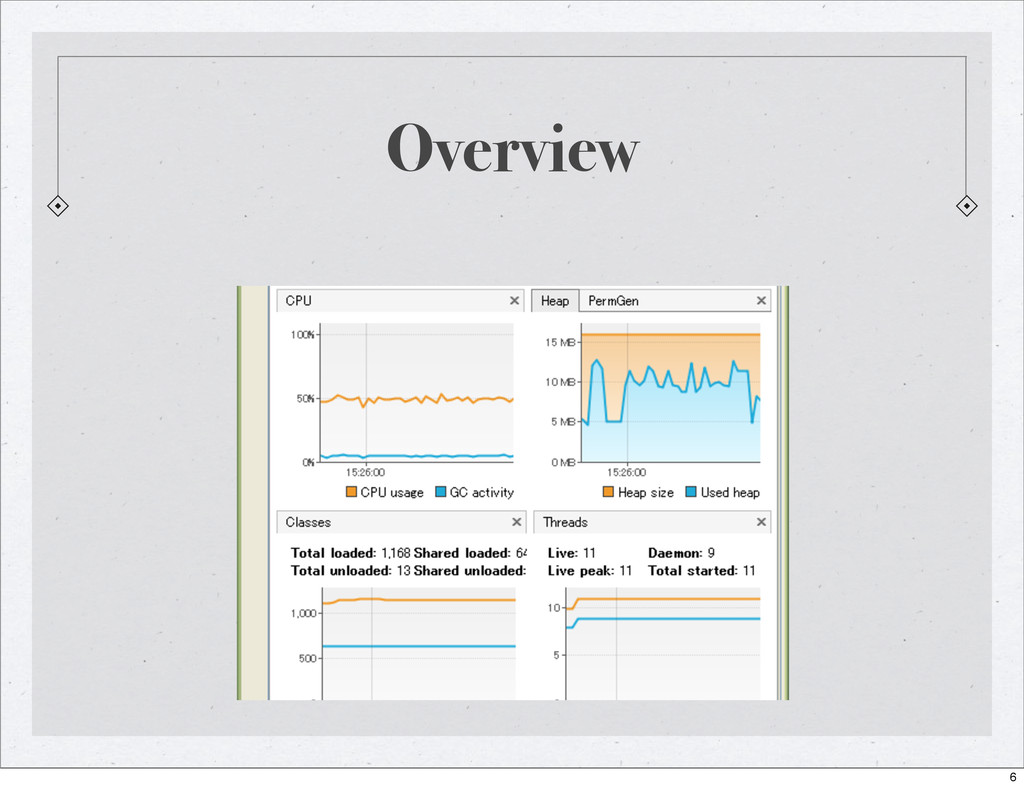
Overview 6
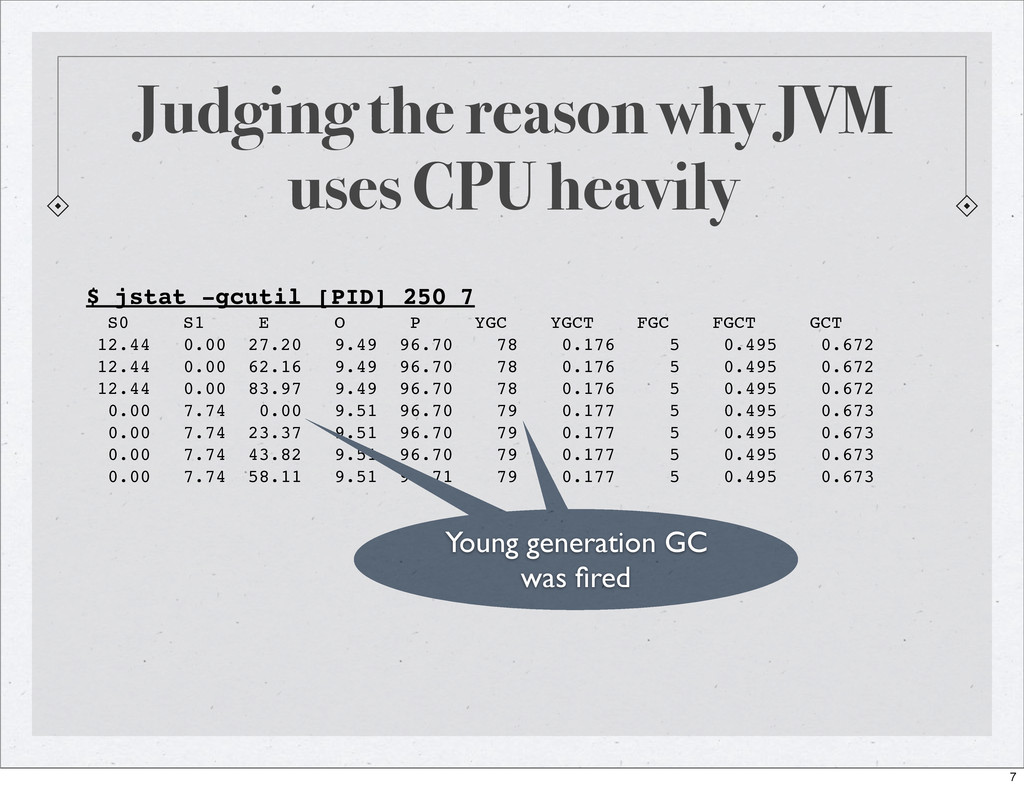
Judging the reason why JVM uses CPU heavily $ jstat
-gcutil [PID] 250 7 S0 S1 E O P YGC YGCT FGC FGCT GCT 12.44 0.00 27.20 9.49 96.70 78 0.176 5 0.495 0.672 12.44 0.00 62.16 9.49 96.70 78 0.176 5 0.495 0.672 12.44 0.00 83.97 9.49 96.70 78 0.176 5 0.495 0.672 0.00 7.74 0.00 9.51 96.70 79 0.177 5 0.495 0.673 0.00 7.74 23.37 9.51 96.70 79 0.177 5 0.495 0.673 0.00 7.74 43.82 9.51 96.70 79 0.177 5 0.495 0.673 0.00 7.74 58.11 9.51 96.71 79 0.177 5 0.495 0.673 GC was fired Young generation GC was fired 7
Detecting method which costs too much time 8
How to read method name Foo.x() means “method x of
Foo class” Foo$Bar.x() means “method x of Bar class, and Bar is inner class of Foo” Foo.<init> means “constructor of Foo class” Foo.<clinit> means “static initializer of Foo class” 9
Taking thread dump $ jstack -l [PID] > thread-dump.txt 10
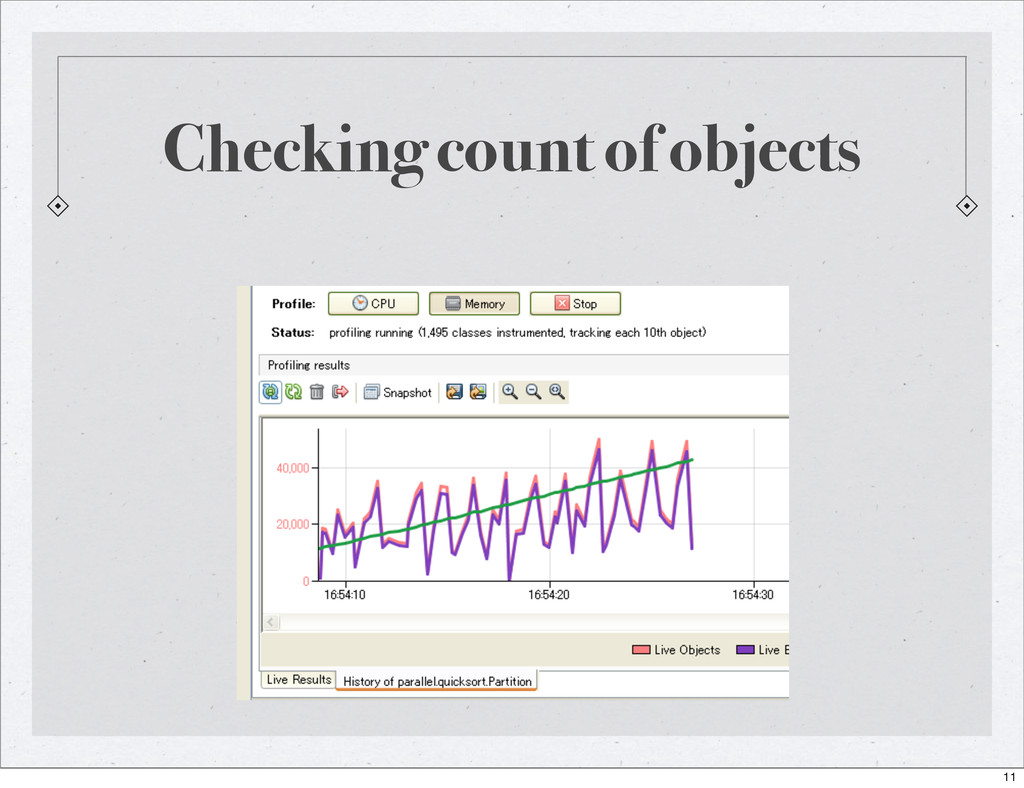
Checking count of objects 11
Taking heap dump $ jmap -dump:format=b,file=dump.dat [PID] 12
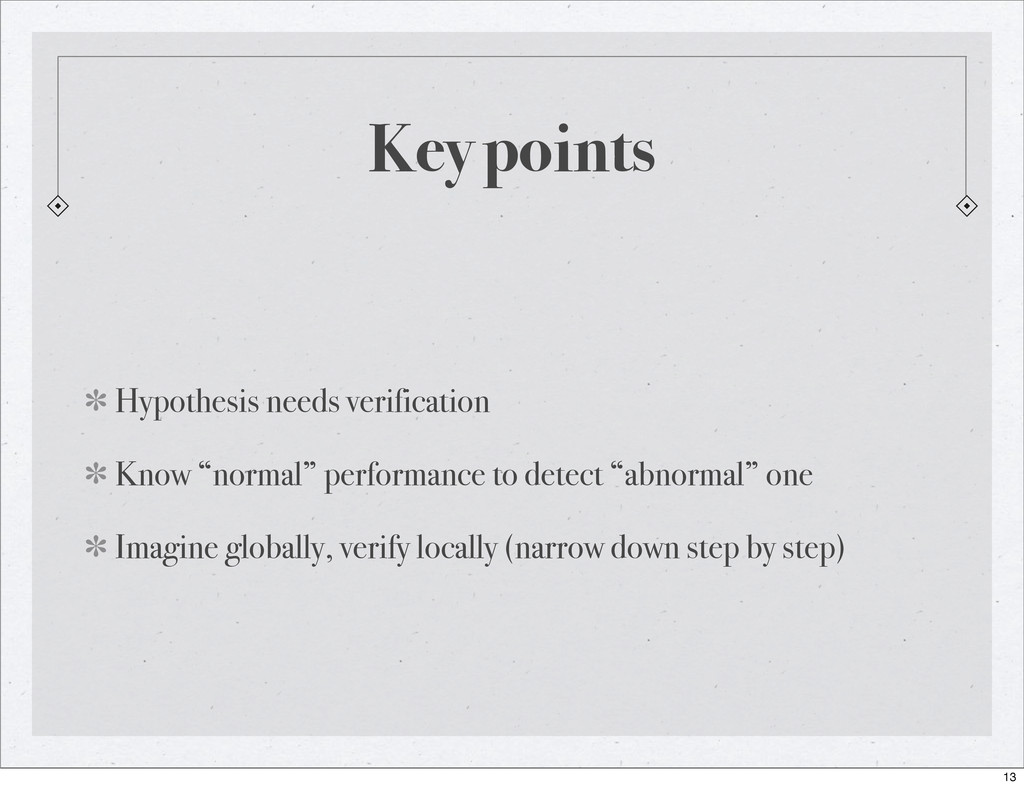
Key points Hypothesis needs verification Know “normal” performance to detect
“abnormal” one Imagine globally, verify locally (narrow down step by step) 13
Reference JDK tools and utilities Browsing heap dump VisualVM Diagnosis
documentation @ developerWorks My gist about JVM profiling, blog article and another article 14
![Taking thread dump $ jstack -l [PID] > thread-dump.txt 10](https://files.speakerdeck.com/presentations/507d7ff6e7912c0002056829/slide_9.jpg)
![Taking heap dump $ jmap -dump:format=b,file=dump.dat [PID] 12](https://files.speakerdeck.com/presentations/507d7ff6e7912c0002056829/slide_11.jpg)