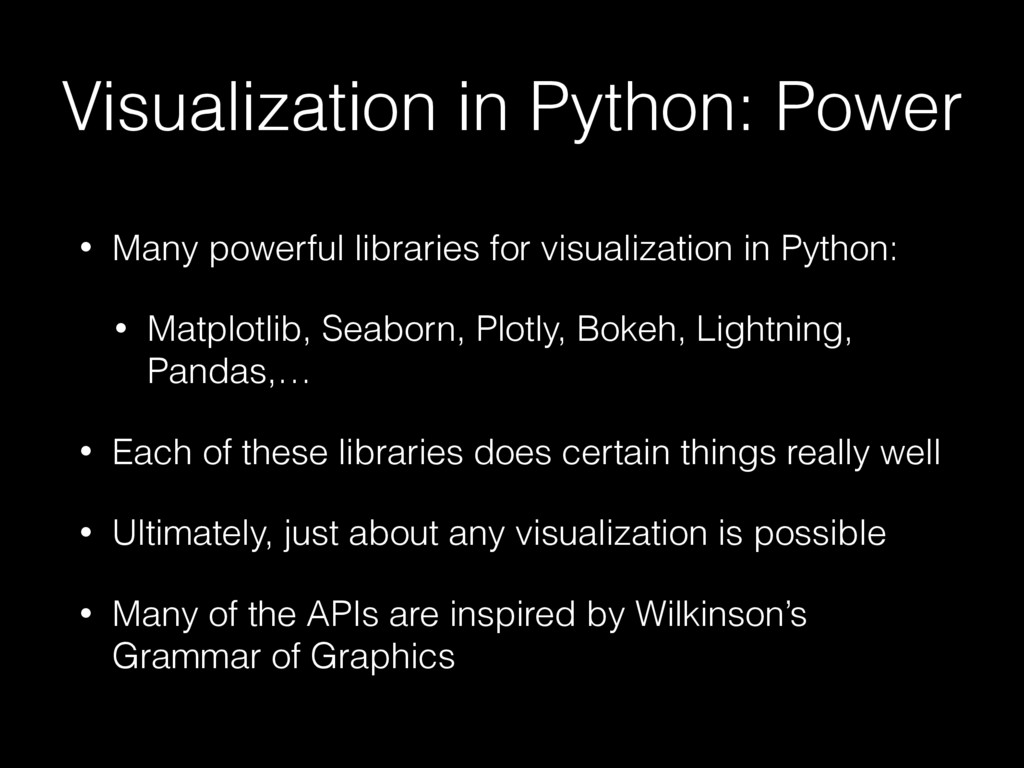
in Python: • Matplotlib, Seaborn, Plotly, Bokeh, Lightning, Pandas,… • Each of these libraries does certain things really well • Ultimately, just about any visualization is possible • Many of the APIs are inspired by Wilkinson’s Grammar of Graphics
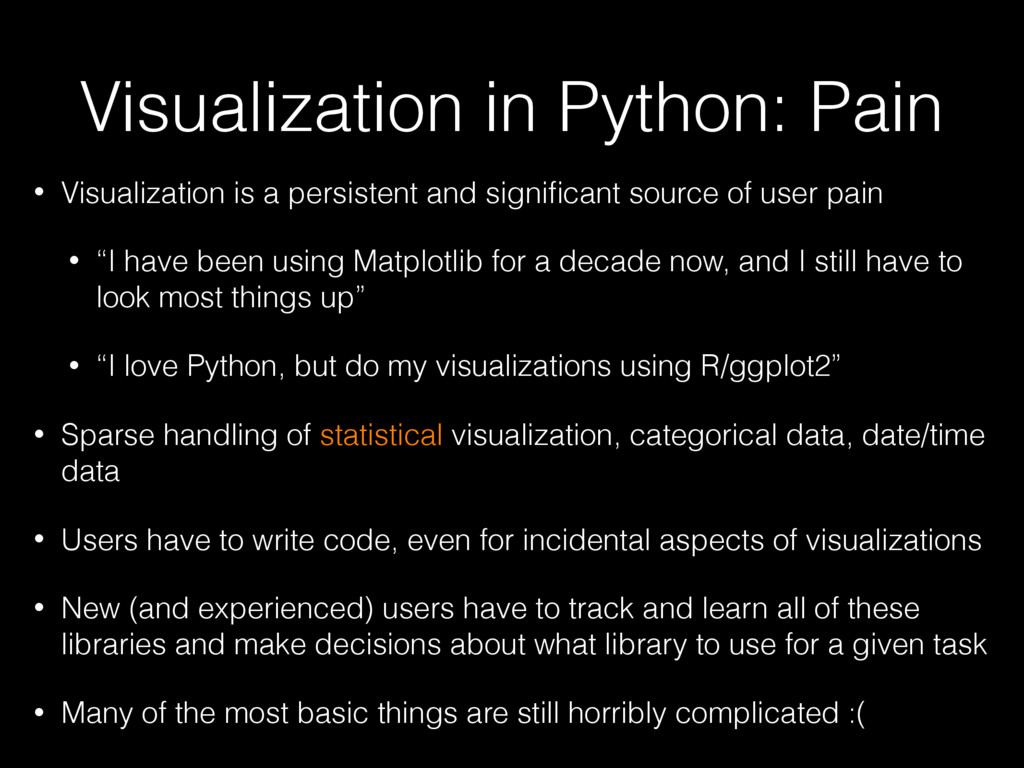
significant source of user pain • “I have been using Matplotlib for a decade now, and I still have to look most things up” • “I love Python, but do my visualizations using R/ggplot2” • Sparse handling of statistical visualization, categorical data, date/time data • Users have to write code, even for incidental aspects of visualizations • New (and experienced) users have to track and learn all of these libraries and make decisions about what library to use for a given task • Many of the most basic things are still horribly complicated :(
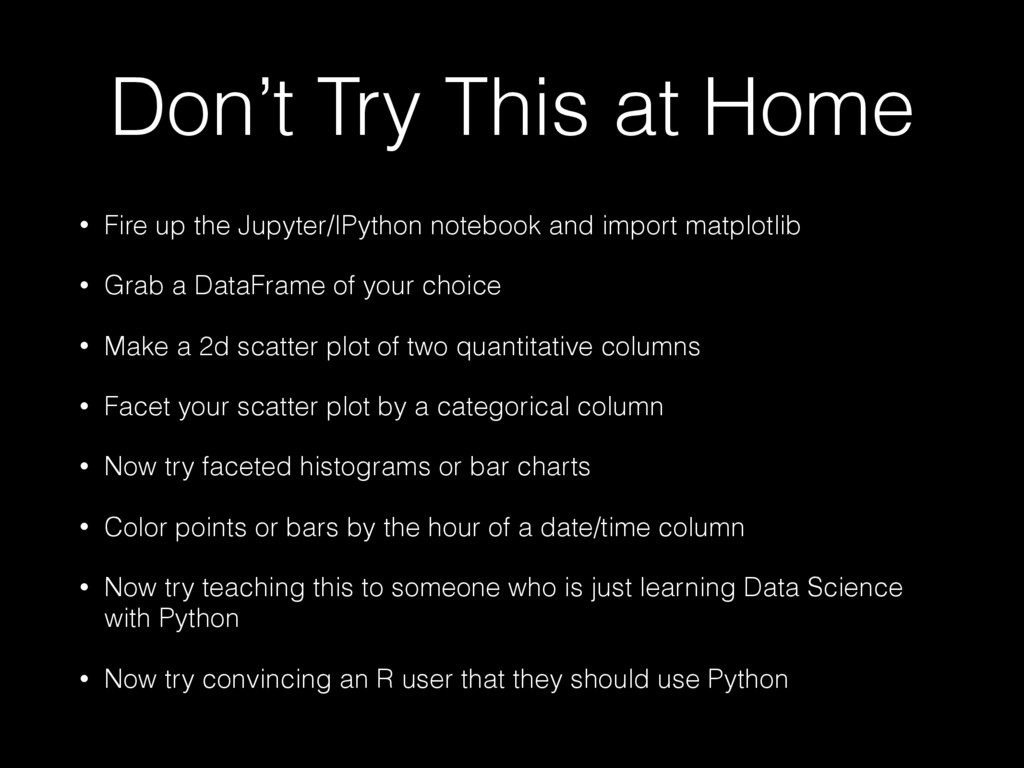
notebook and import matplotlib • Grab a DataFrame of your choice • Make a 2d scatter plot of two quantitative columns • Facet your scatter plot by a categorical column • Now try faceted histograms or bar charts • Color points or bars by the hour of a date/time column • Now try teaching this to someone who is just learning Data Science with Python • Now try convincing an R user that they should use Python
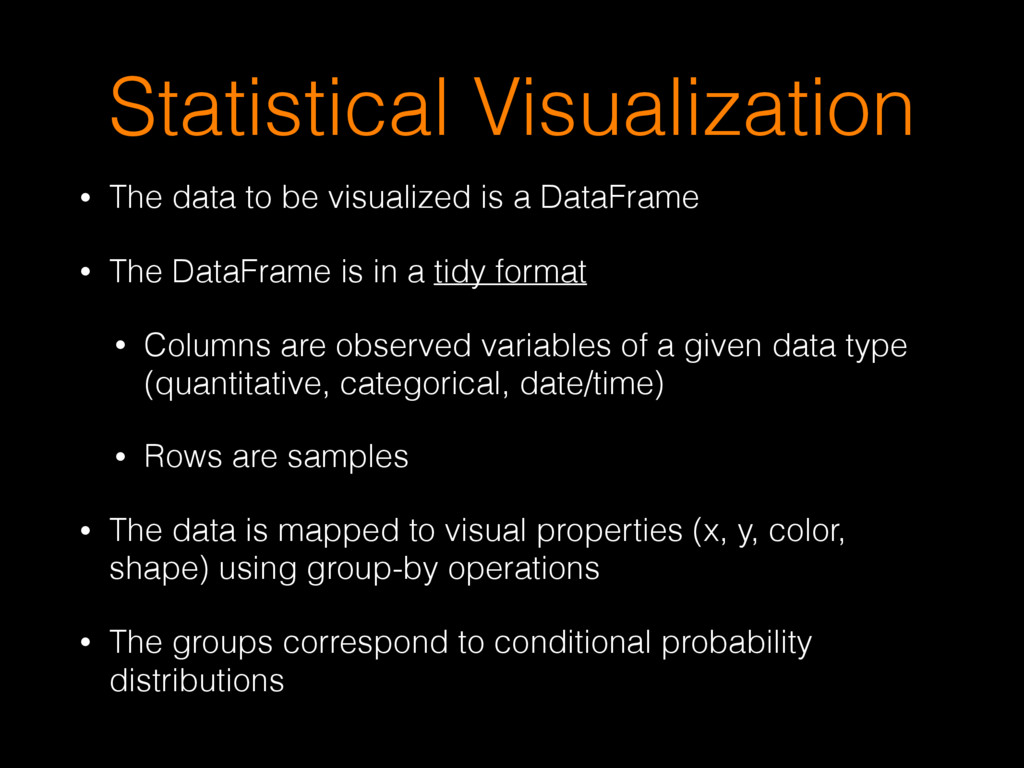
DataFrame • The DataFrame is in a tidy format • Columns are observed variables of a given data type (quantitative, categorical, date/time) • Rows are samples • The data is mapped to visual properties (x, y, color, shape) using group-by operations • The groups correspond to conditional probability distributions
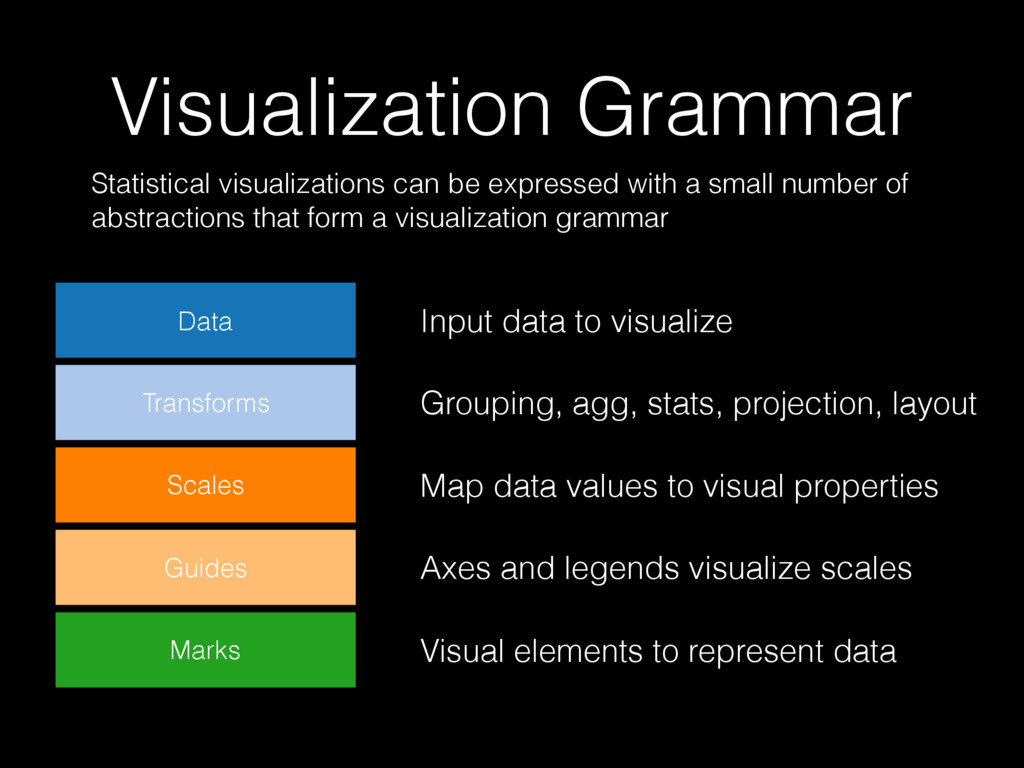
visualize Grouping, agg, stats, projection, layout Map data values to visual properties Axes and legends visualize scales Visual elements to represent data Statistical visualizations can be expressed with a small number of abstractions that form a visualization grammar
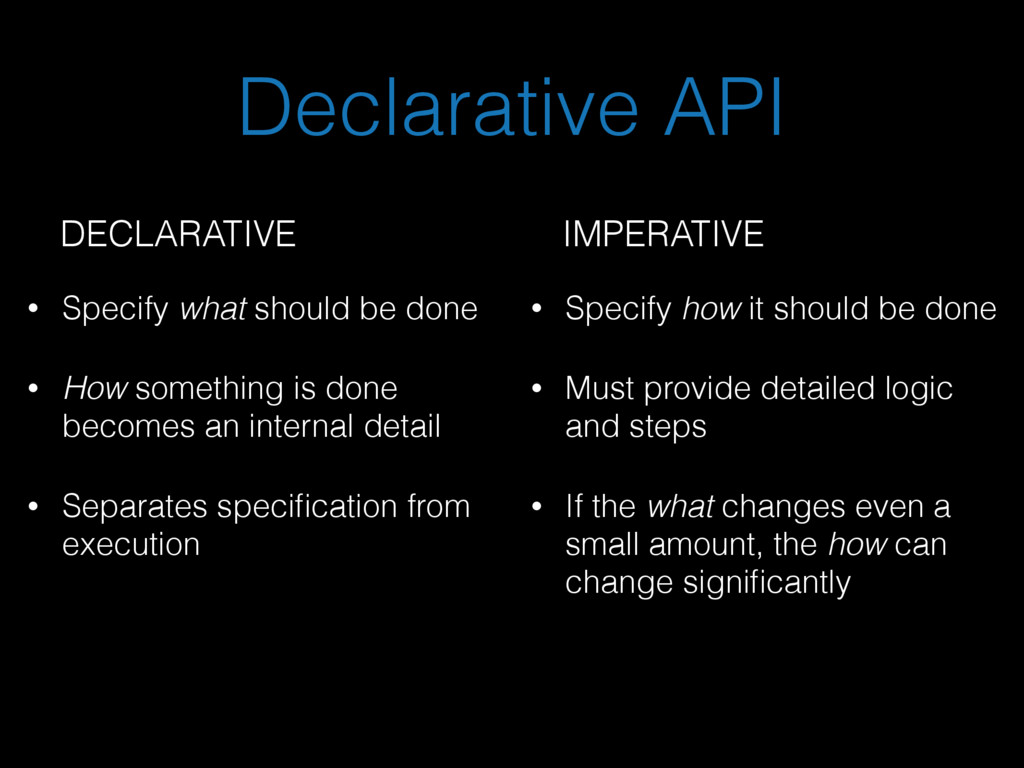
something is done becomes an internal detail • Separates specification from execution • Specify how it should be done • Must provide detailed logic and steps • If the what changes even a small amount, the how can change significantly DECLARATIVE IMPERATIVE
is usually closer to the user’s end goal than the how question • Most often users don’t care how something gets done • Users have to write less code • Fewer abstractions, lower cognitive load • Natural serialization format (JSON) for sharing, portability • Possible to auto-generate APIs, code, examples, tests • Much easier to support multiple languages (JS, Python, R, Scala, Julia, etc.) • Performance: responsibility of implementation, not user
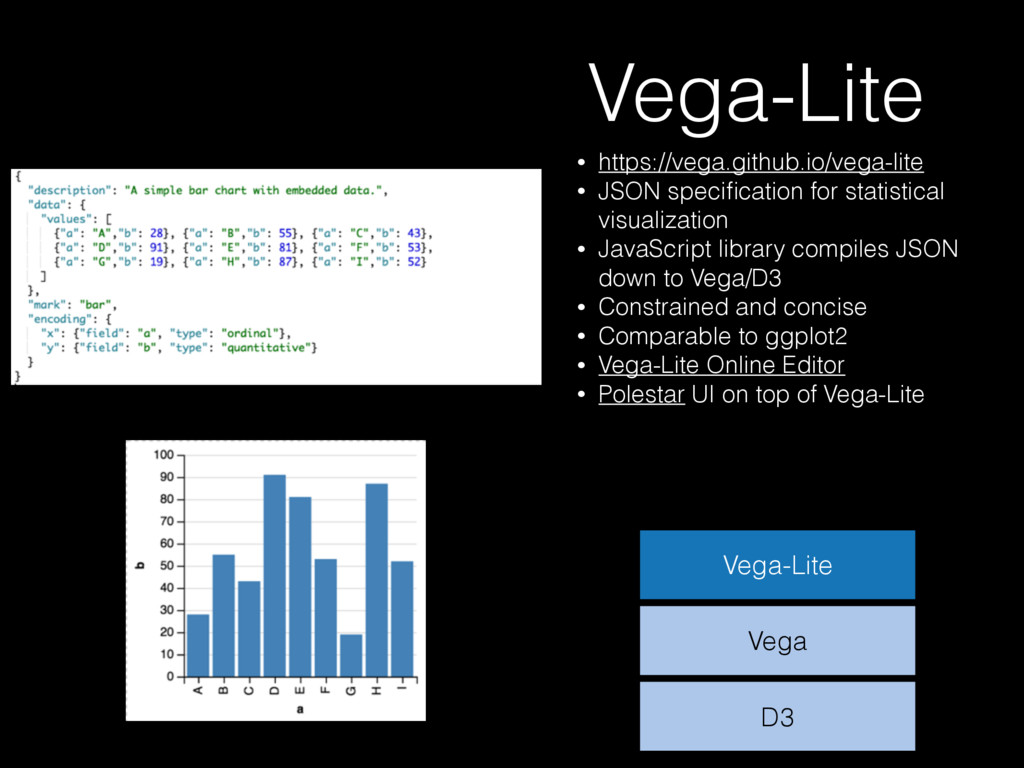
statistical visualization • JavaScript library compiles JSON down to Vega/D3 • Constrained and concise • Comparable to ggplot2 • Vega-Lite Online Editor • Polestar UI on top of Vega-Lite
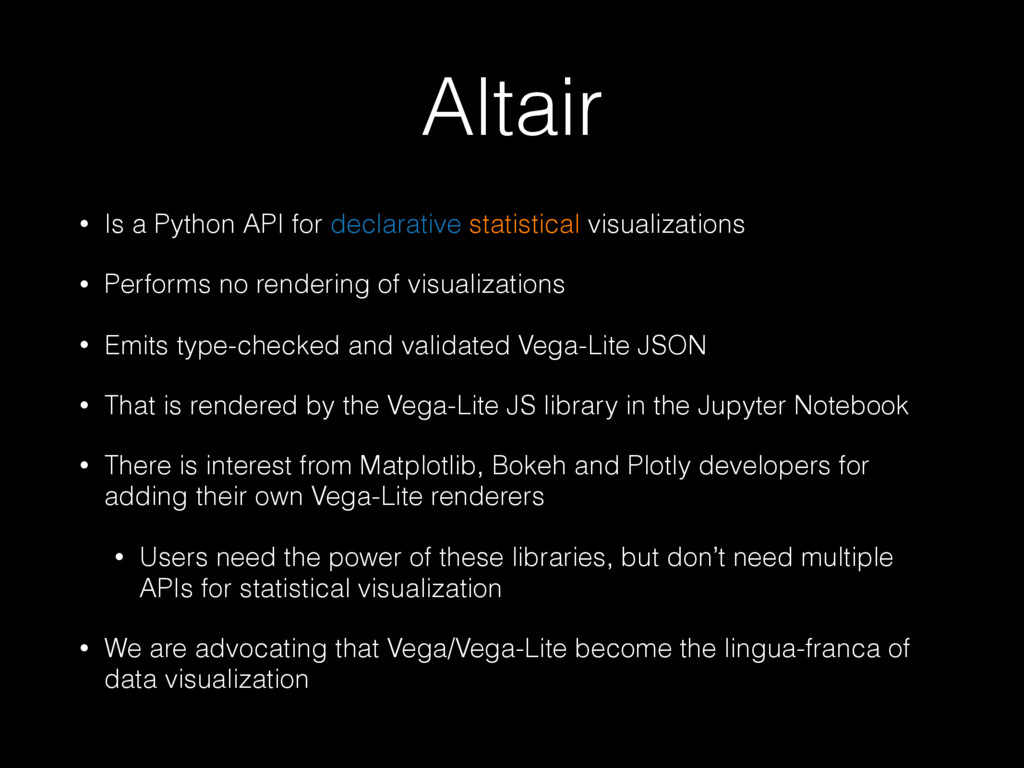
• Performs no rendering of visualizations • Emits type-checked and validated Vega-Lite JSON • That is rendered by the Vega-Lite JS library in the Jupyter Notebook • There is interest from Matplotlib, Bokeh and Plotly developers for adding their own Vega-Lite renderers • Users need the power of these libraries, but don’t need multiple APIs for statistical visualization • We are advocating that Vega/Vega-Lite become the lingua-franca of data visualization
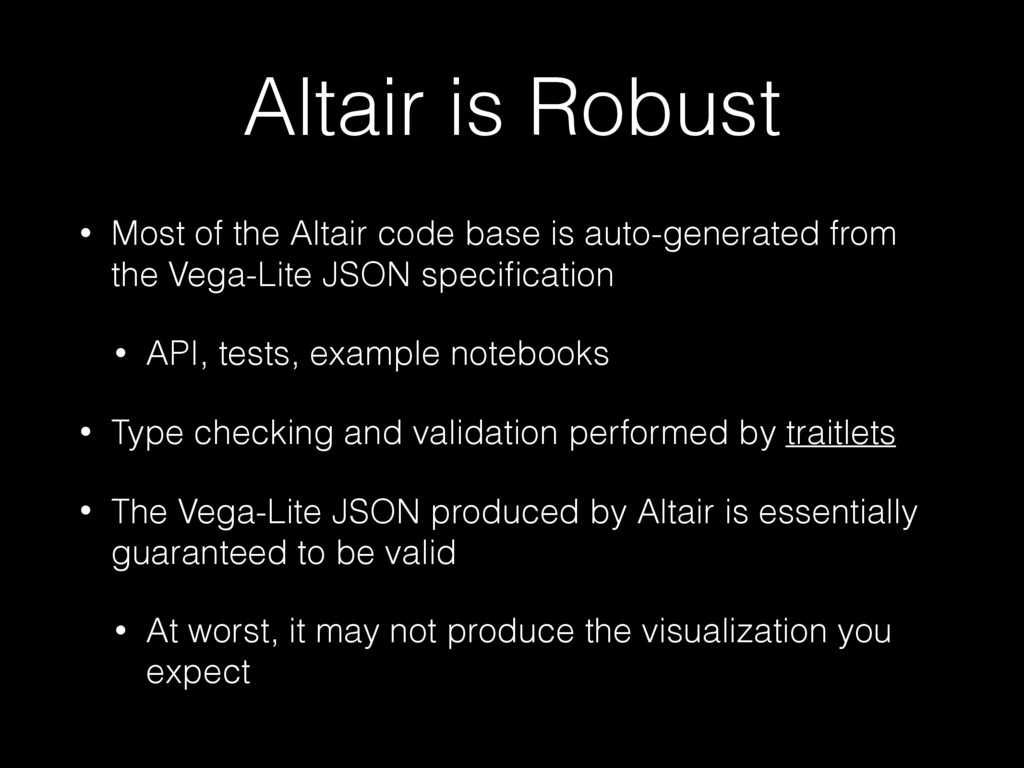
is auto-generated from the Vega-Lite JSON specification • API, tests, example notebooks • Type checking and validation performed by traitlets • The Vega-Lite JSON produced by Altair is essentially guaranteed to be valid • At worst, it may not produce the visualization you expect
• Type-checked attributes • Thin layer of convenience methods • Method chaining and operators (+, +=) • Intelligent heuristics, such as type inference, to reduce the amount of code needed • Shorthand notation for specifying columns, data types and aggregation • Flat is better than nested: subtle API changes to flatten the highly nested Vega-Lite API • Extensive documentation and over 70 examples
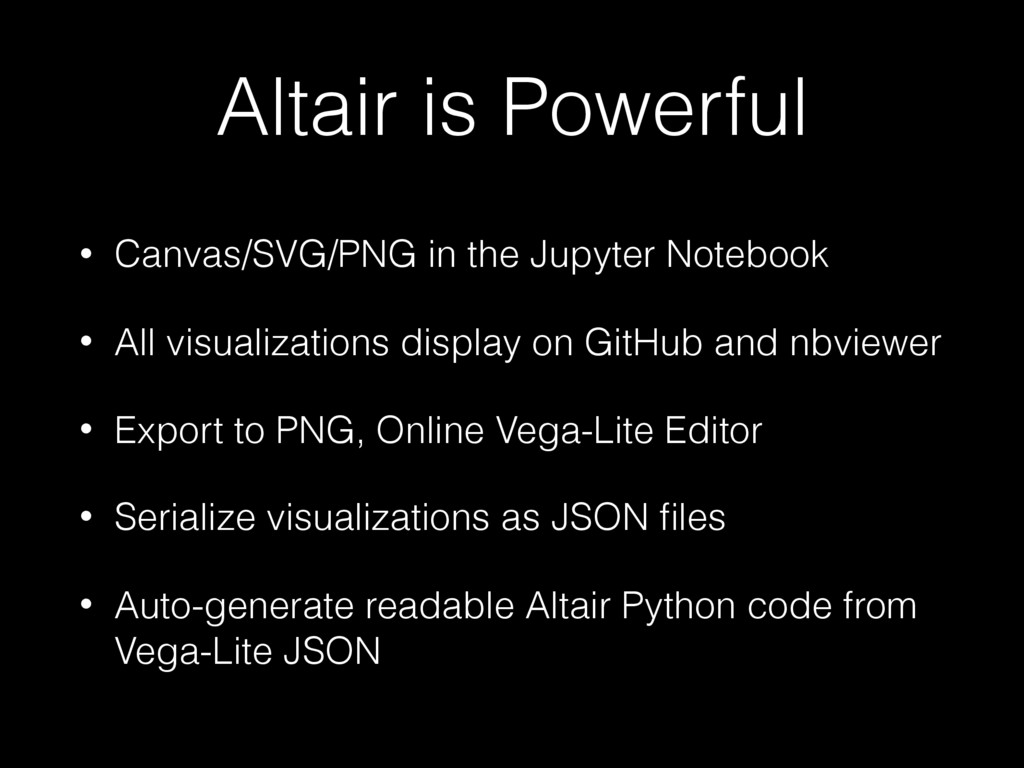
All visualizations display on GitHub and nbviewer • Export to PNG, Online Vega-Lite Editor • Serialize visualizations as JSON files • Auto-generate readable Altair Python code from Vega-Lite JSON
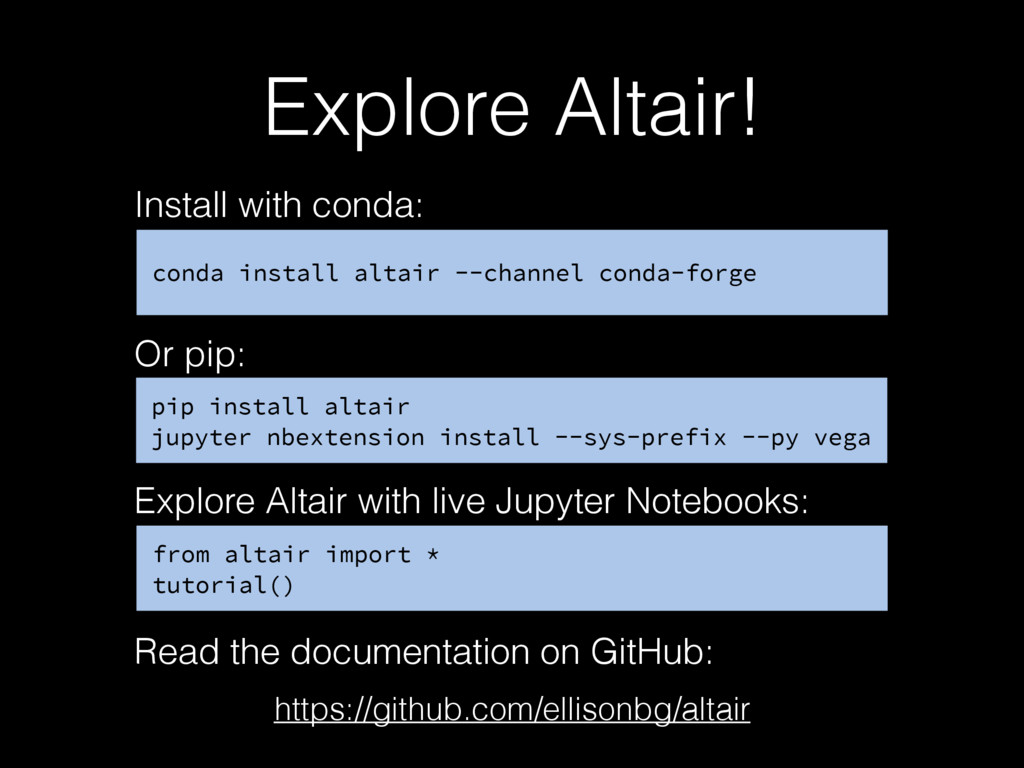
conda: pip install altair jupyter nbextension install --sys-prefix --py vega Or pip: from altair import * tutorial() Explore Altair with live Jupyter Notebooks: Read the documentation on GitHub:
creating an Altair implementation for your language, please get in touch. Most of the hard work is done! Special thanks to Jeff Heer and members of his Interactive Data Lab at UW: Dominik Moritz, Arvind Satyanarayan