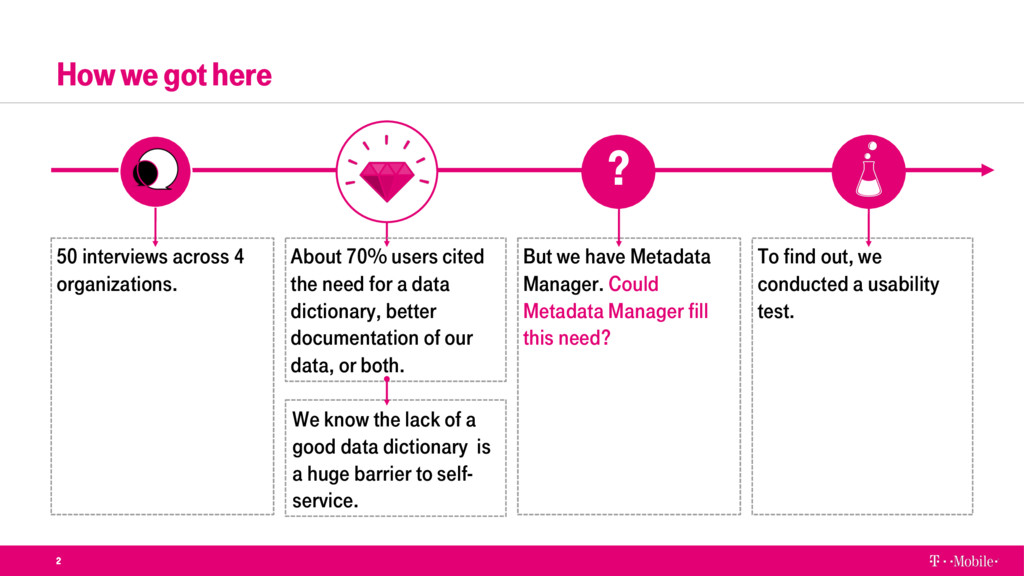
About 70% users cited the need for a data dictionary, better documentation of our data, or both. But we have Metadata Manager. Could Metadata Manager fill this need? To find out, we conducted a usability test. ? We know the lack of a good data dictionary is a huge barrier to self- service.
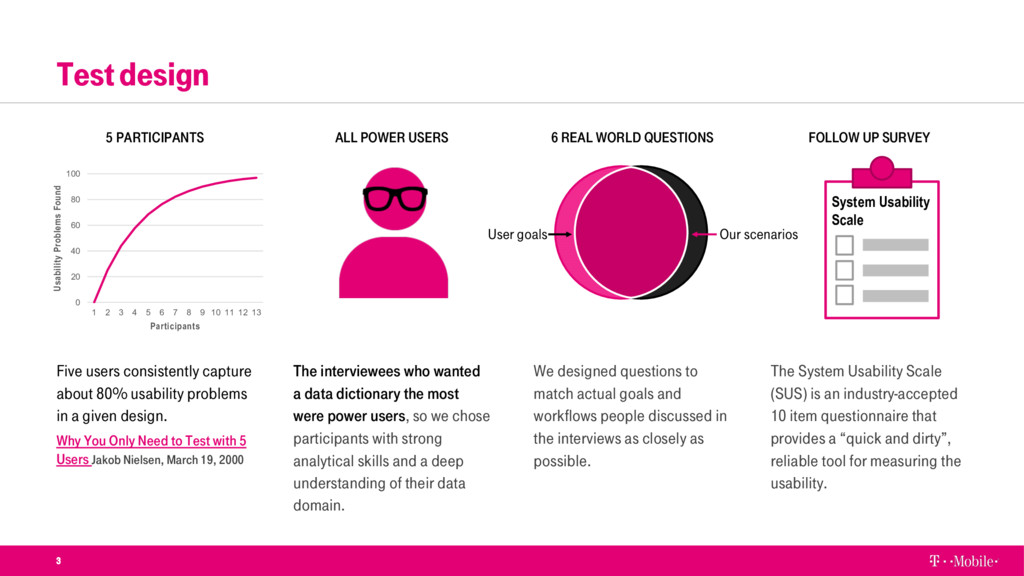
problems in a given design. Why You Only Need to Test with 5 Users Jakob Nielsen, March 19, 2000 The interviewees who wanted a data dictionary the most were power users, so we chose participants with strong analytical skills and a deep understanding of their data domain. We designed questions to match actual goals and workflows people discussed in the interviews as closely as possible. The System Usability Scale (SUS) is an industry-accepted 10 item questionnaire that provides a “quick and dirty”, reliable tool for measuring the usability. 5 PARTICIPANTS ALL POWER USERS 6 REAL WORLD QUESTIONS FOLLOW UP SURVEY 0 20 40 60 80 100 1 2 3 4 5 6 7 8 9 10 11 12 13 Usability Problems Found Participants User goals Our scenarios System Usability Scale
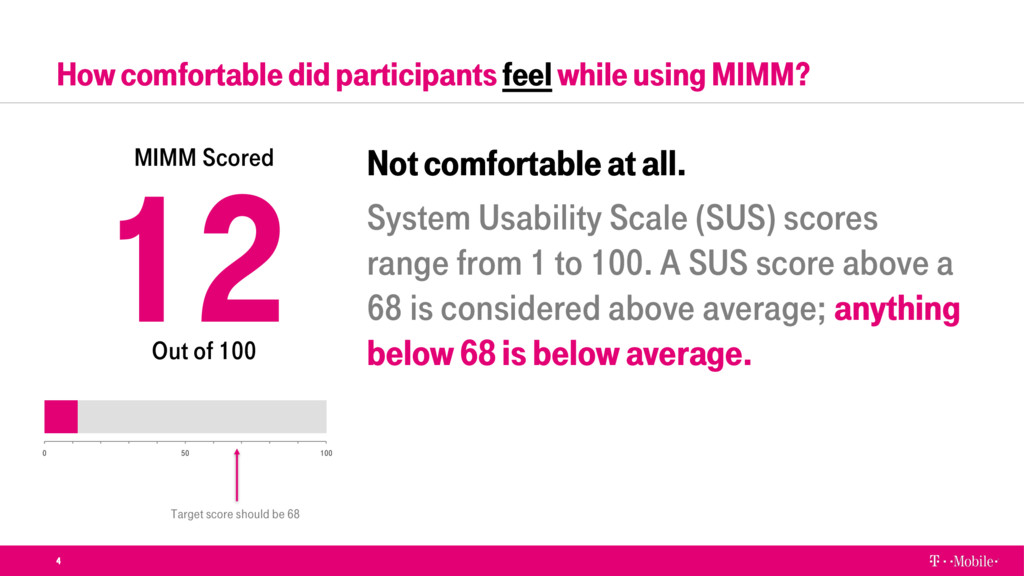
comfortable at all. System Usability Scale (SUS) scores range from 1 to 100. A SUS score above a 68 is considered above average; anything below 68 is below average. 0 50 100 Out of 100 MIMM Scored Target score should be 68
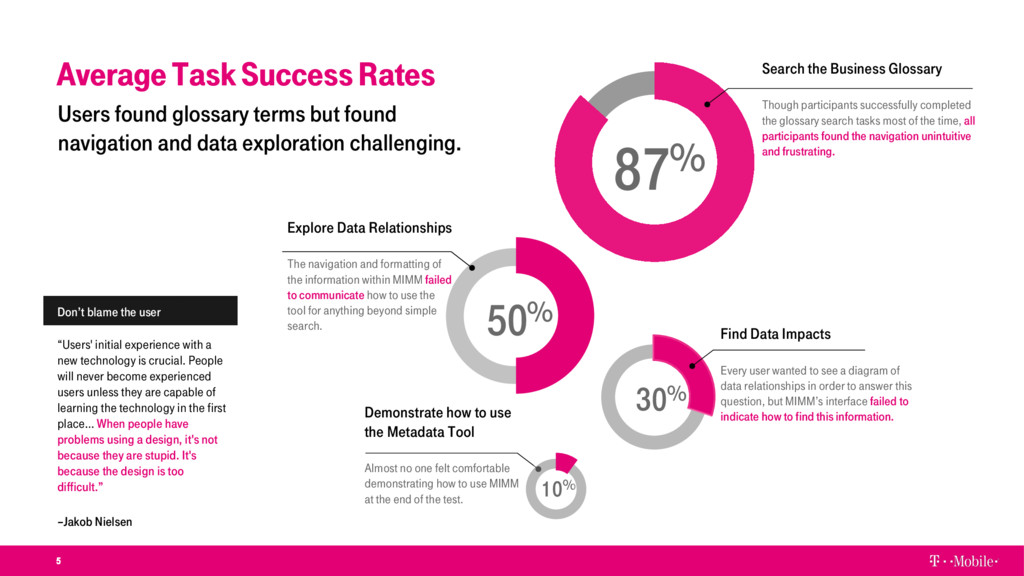
technology is crucial. People will never become experienced users unless they are capable of learning the technology in the first place… When people have problems using a design, it's not because they are stupid. It's because the design is too difficult.” –Jakob Nielsen 87% 30% Don’t blame the user 5 50% Demonstrate how to use the Metadata Tool Almost no one felt comfortable demonstrating how to use MIMM at the end of the test. 10% Explore Data Relationships The navigation and formatting of the information within MIMM failed to communicate how to use the tool for anything beyond simple search. Find Data Impacts Every user wanted to see a diagram of data relationships in order to answer this question, but MIMM’s interface failed to indicate how to find this information. Search the Business Glossary Though participants successfully completed the glossary search tasks most of the time, all participants found the navigation unintuitive and frustrating. Users found glossary terms but found navigation and data exploration challenging.
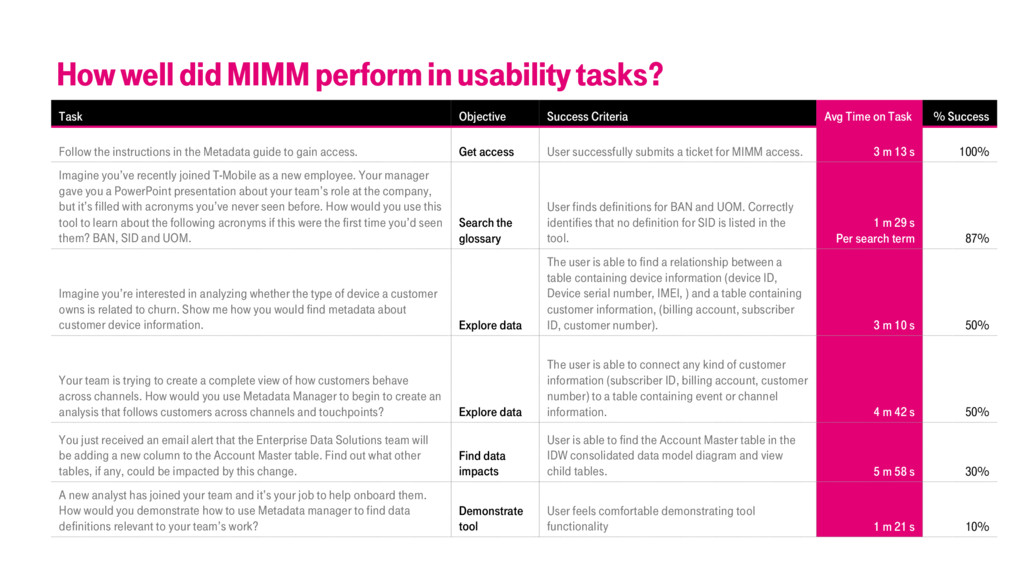
tables 6 Task Objective Success Criteria Avg Time on Task % Success Follow the instructions in the Metadata guide to gain access. Get access User successfully submits a ticket for MIMM access. 3 m 13 s 100% Imagine you’ve recently joined T-Mobile as a new employee. Your manager gave you a PowerPoint presentation about your team’s role at the company, but it’s filled with acronyms you’ve never seen before. How would you use this tool to learn about the following acronyms if this were the first time you’d seen them? BAN, SID and UOM. Search the glossary User finds definitions for BAN and UOM. Correctly identifies that no definition for SID is listed in the tool. 1 m 29 s Per search term 87% Imagine you’re interested in analyzing whether the type of device a customer owns is related to churn. Show me how you would find metadata about customer device information. Explore data The user is able to find a relationship between a table containing device information (device ID, Device serial number, IMEI, ) and a table containing customer information, (billing account, subscriber ID, customer number). 3 m 10 s 50% Your team is trying to create a complete view of how customers behave across channels. How would you use Metadata Manager to begin to create an analysis that follows customers across channels and touchpoints? Explore data The user is able to connect any kind of customer information (subscriber ID, billing account, customer number) to a table containing event or channel information. 4 m 42 s 50% You just received an email alert that the Enterprise Data Solutions team will be adding a new column to the Account Master table. Find out what other tables, if any, could be impacted by this change. Find data impacts User is able to find the Account Master table in the IDW consolidated data model diagram and view child tables. 5 m 58 s 30% A new analyst has joined your team and it’s your job to help onboard them. How would you demonstrate how to use Metadata manager to find data definitions relevant to your team’s work? Demonstrate tool User feels comfortable demonstrating tool functionality 1 m 21 s 10%
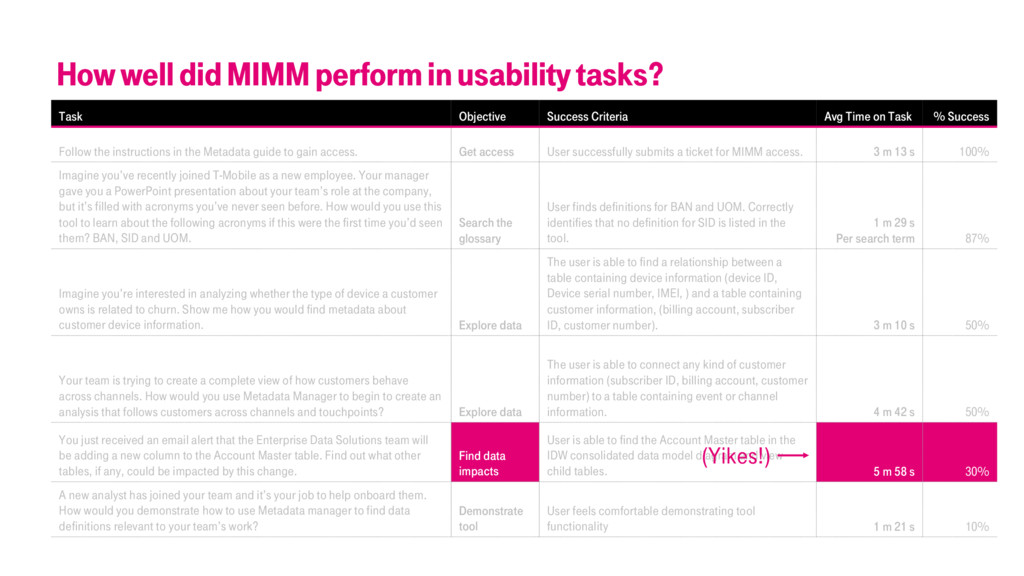
tables 7 Task Objective Success Criteria Avg Time on Task % Success Follow the instructions in the Metadata guide to gain access. Get access User successfully submits a ticket for MIMM access. 3 m 13 s 100% Imagine you’ve recently joined T-Mobile as a new employee. Your manager gave you a PowerPoint presentation about your team’s role at the company, but it’s filled with acronyms you’ve never seen before. How would you use this tool to learn about the following acronyms if this were the first time you’d seen them? BAN, SID and UOM. Search the glossary User finds definitions for BAN and UOM. Correctly identifies that no definition for SID is listed in the tool. 1 m 29 s Per search term 87% Imagine you’re interested in analyzing whether the type of device a customer owns is related to churn. Show me how you would find metadata about customer device information. Explore data The user is able to find a relationship between a table containing device information (device ID, Device serial number, IMEI, ) and a table containing customer information, (billing account, subscriber ID, customer number). 3 m 10 s 50% Your team is trying to create a complete view of how customers behave across channels. How would you use Metadata Manager to begin to create an analysis that follows customers across channels and touchpoints? Explore data The user is able to connect any kind of customer information (subscriber ID, billing account, customer number) to a table containing event or channel information. 4 m 42 s 50% You just received an email alert that the Enterprise Data Solutions team will be adding a new column to the Account Master table. Find out what other tables, if any, could be impacted by this change. Find data impacts User is able to find the Account Master table in the IDW consolidated data model diagram and view child tables. 5 m 58 s 30% A new analyst has joined your team and it’s your job to help onboard them. How would you demonstrate how to use Metadata manager to find data definitions relevant to your team’s work? Demonstrate tool User feels comfortable demonstrating tool functionality 1 m 21 s 10% (Yikes!)
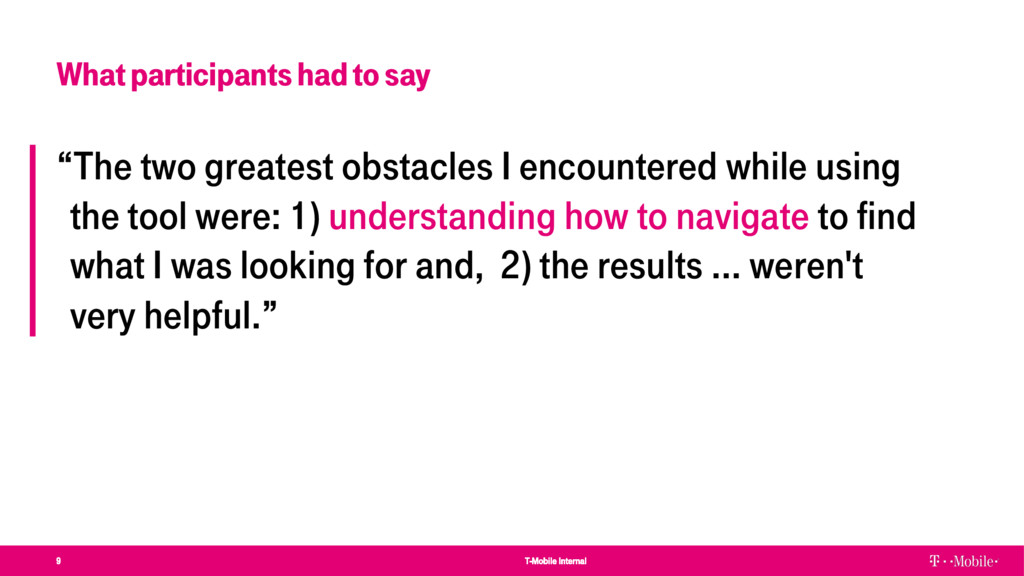
greatest obstacles I encountered while using the tool were: 1) understanding how to navigate to find what I was looking for and, 2) the results … weren't very helpful.”
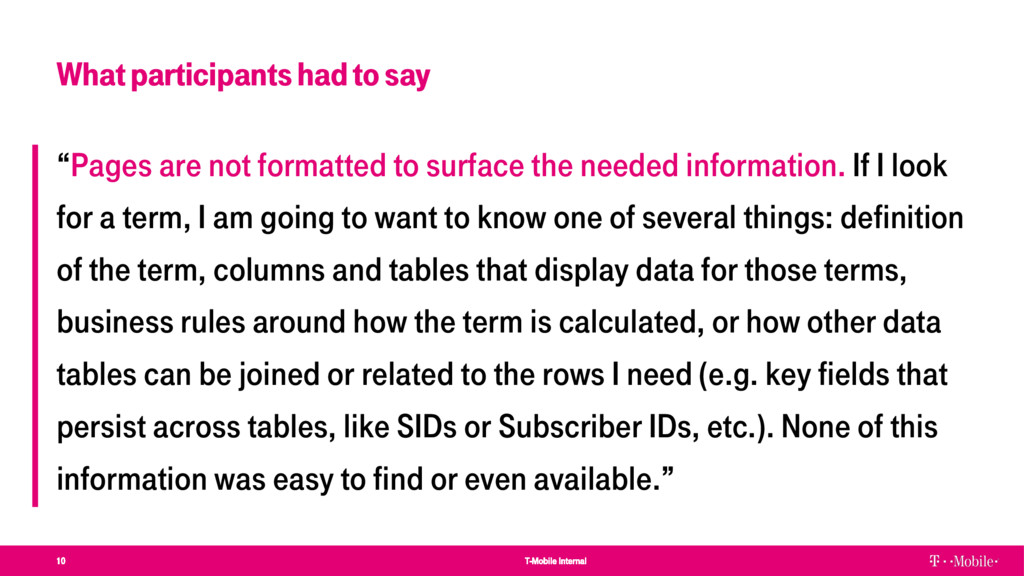
not formatted to surface the needed information. If I look for a term, I am going to want to know one of several things: definition of the term, columns and tables that display data for those terms, business rules around how the term is calculated, or how other data tables can be joined or related to the rows I need (e.g. key fields that persist across tables, like SIDs or Subscriber IDs, etc.). None of this information was easy to find or even available.”
kind of a runaround. This is the sort of thing that would discourage me from even wanting to start here. At this point I’d be screaming at actual humans to try to figure out what’s going on rather than going through this.”
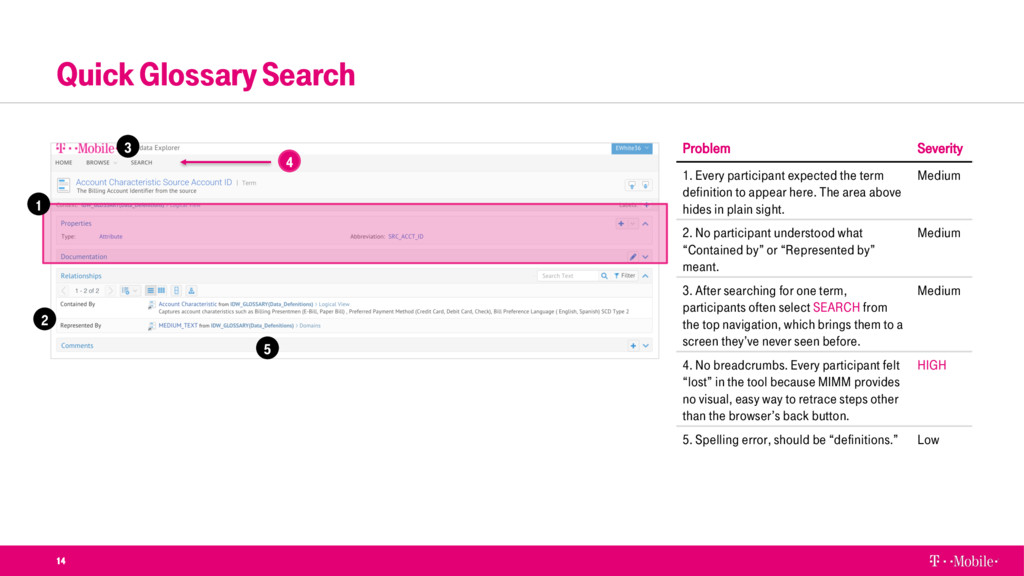
the term definition to appear here. The area above hides in plain sight. Medium 2. No participant understood what “Contained by” or “Represented by” meant. Medium 3. After searching for one term, participants often select SEARCH from the top navigation, which brings them to a screen they’ve never seen before. Medium 4. No breadcrumbs. Every participant felt “lost” in the tool because MIMM provides no visual, easy way to retrace steps other than the browser’s back button. HIGH 5. Spelling error, should be “definitions.” Low 1 2 3 5 4
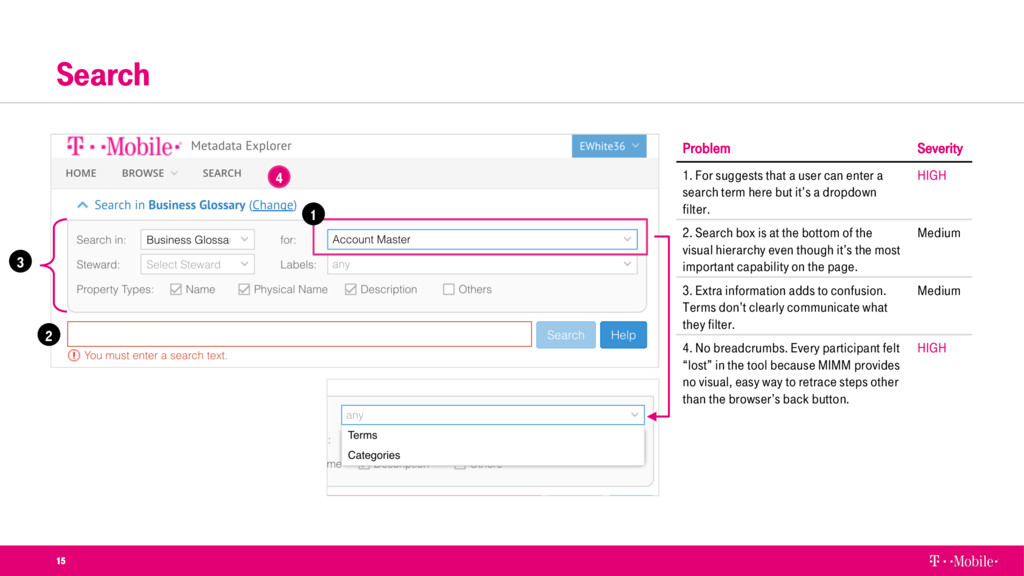
can enter a search term here but it’s a dropdown filter. HIGH 2. Search box is at the bottom of the visual hierarchy even though it’s the most important capability on the page. Medium 3. Extra information adds to confusion. Terms don’t clearly communicate what they filter. Medium 4. No breadcrumbs. Every participant felt “lost” in the tool because MIMM provides no visual, easy way to retrace steps other than the browser’s back button. HIGH 1 2 3 4
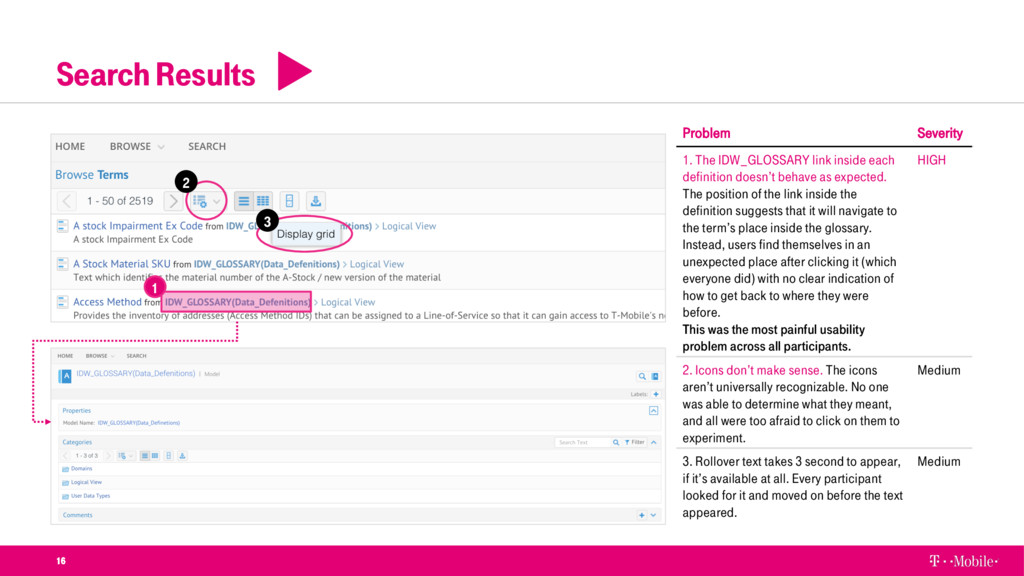
each definition doesn’t behave as expected. The position of the link inside the definition suggests that it will navigate to the term’s place inside the glossary. Instead, users find themselves in an unexpected place after clicking it (which everyone did) with no clear indication of how to get back to where they were before. This was the most painful usability problem across all participants. HIGH 2. Icons don’t make sense. The icons aren’t universally recognizable. No one was able to determine what they meant, and all were too afraid to click on them to experiment. Medium 3. Rollover text takes 3 second to appear, if it’s available at all. Every participant looked for it and moved on before the text appeared. Medium 1 2 3
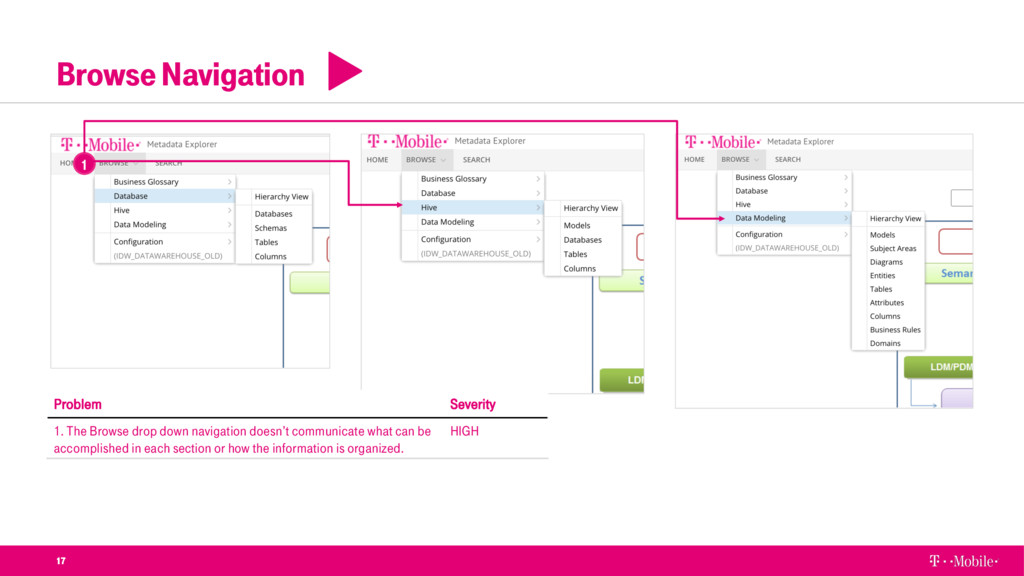
a metadata tool. They found some of the underlying information useful– especially the diagram of table relationships–but MIMM fails to make this information easy to discover. No participant was confident in the widespread adoption of MIMM, even if additional training were offered.
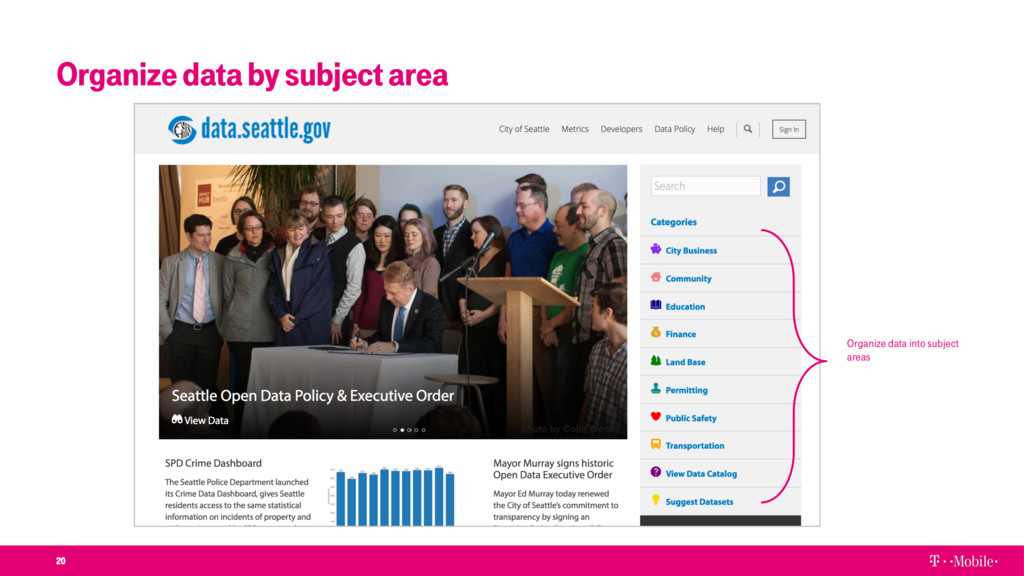
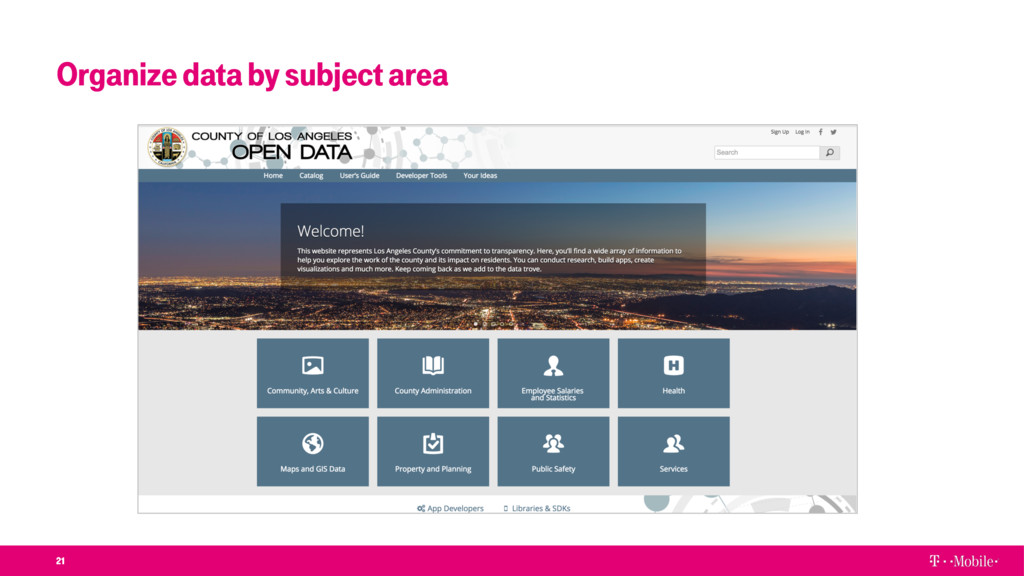
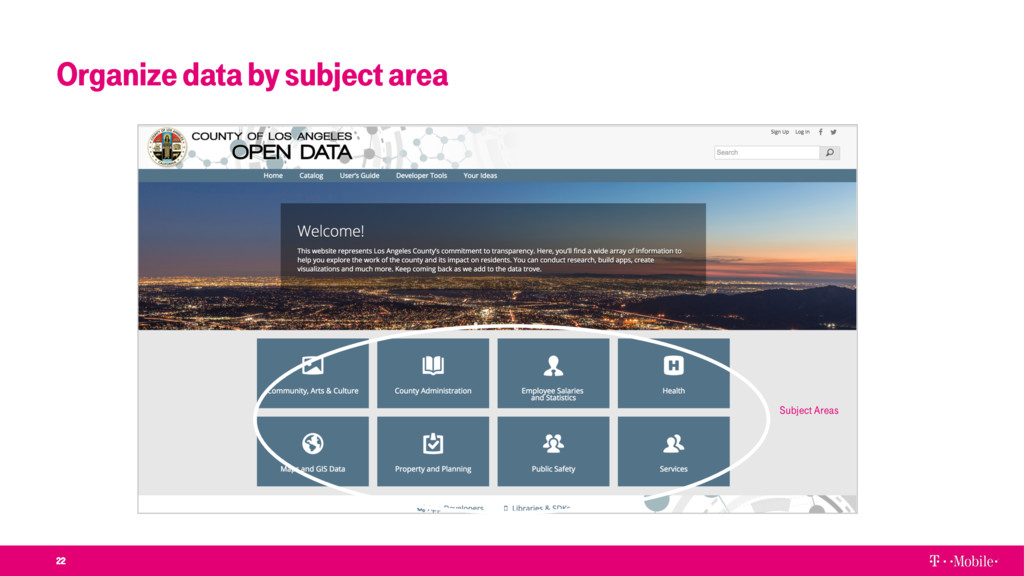
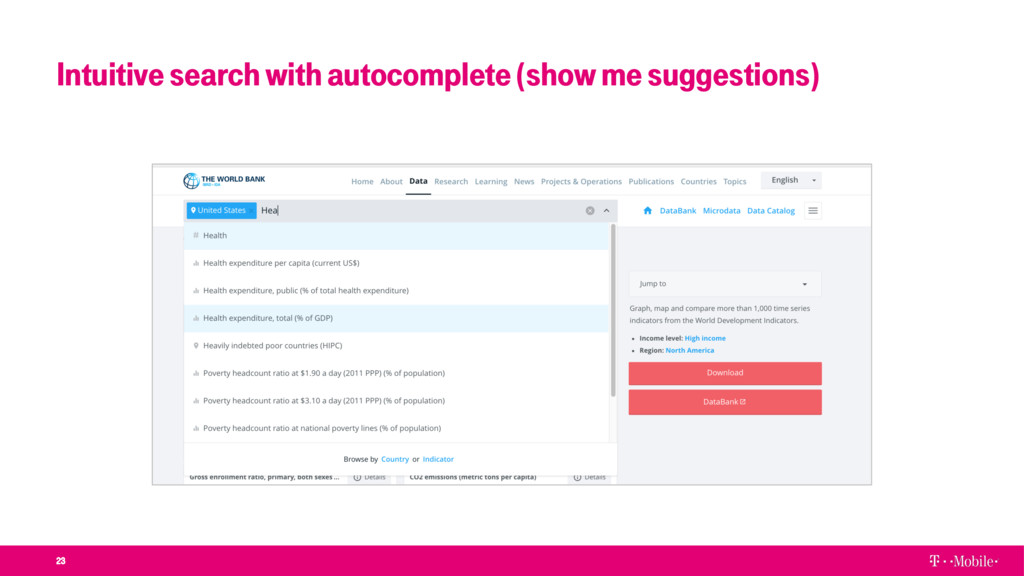
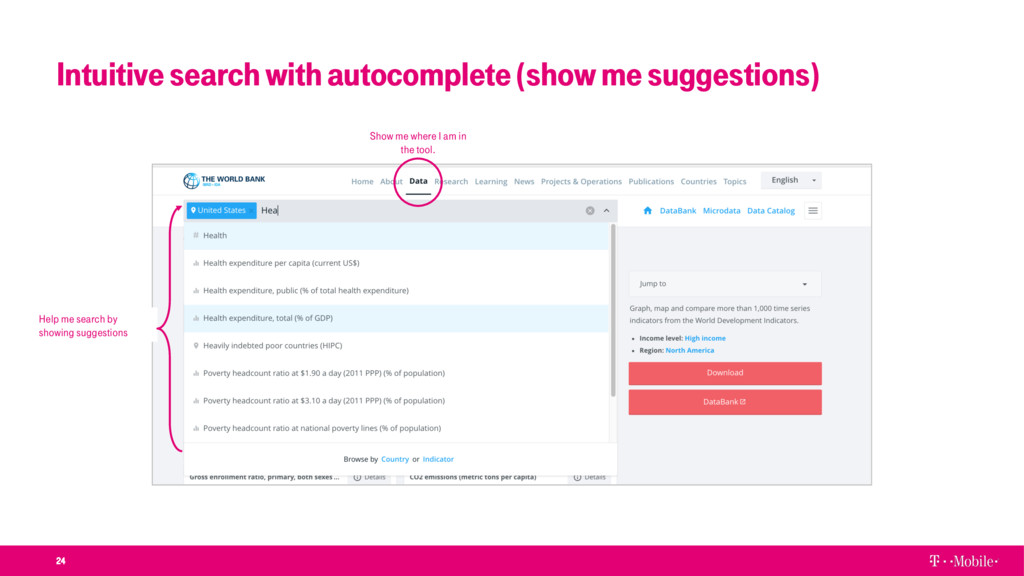
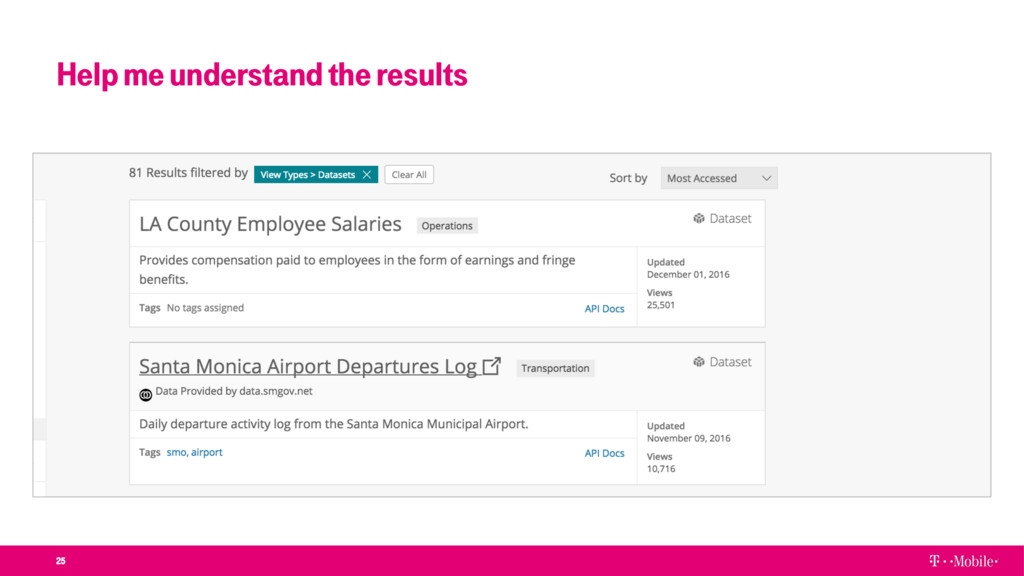
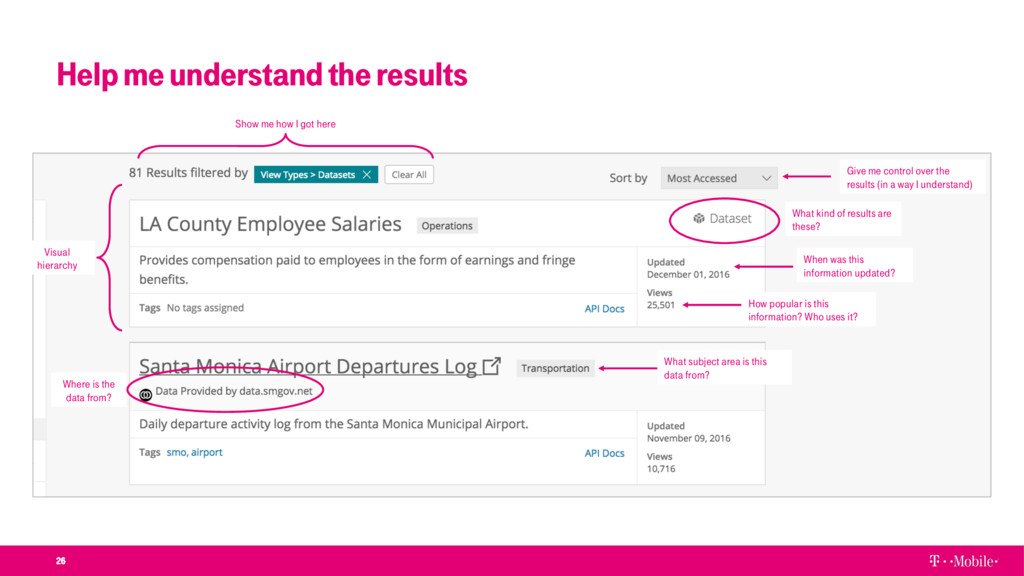
the data from? When was this information updated? How popular is this information? Who uses it? Show me how I got here What subject area is this data from? Give me control over the results (in a way I understand) What kind of results are these?