Ever wondered how much blogs earn? in this report I look at blog income this is the 2nd year I've completed the report so it's interesting to see the changes.
Report 2018 Edit thelifestylemarketer.co/how-much-blogs-earn/ Last year I spent several weeks analysing various sources of data to work out How Much Blog Earn. This year I repeated the exercise with some interesting results. Rather than do a new How much blogs earn post I’ve updated last years report with the new data. This will allow you to quickly compare the changes. Ever wondered what niche you should go into or how much blogs earn in that niche? Or how much you could spend on traffic to your blog and still break even? Read on, I have the answers. All this interest in how much blogs earn was started by a post I created several years ago. In that article, I gave some average figures based on a little bit of research. After hitting publish I decided to do some further research. I went deep and analysed over 100 blogs that had recently sold on Empire Flippers. 1/15
the true value of blogs and also thoroughly research the income and traffic claims made by vendors. I was also intending to use Flippa but after 10 minutes of research, I realised that the income and traffic figures couldn’t be relied on. They were basically created in fantasy land! One metric not included is email marketing as I had no way of tracking the email lists the sites had and if they were used properly. I would highly recommend adding an email list to every site you have , used correctly it can quickly become a key income generator. I hope that this post will allow you to come up with a good monetization strategy for you blog. It’s certainly opened my eyes and has lead to a couple of new sites being planned and a full review of all our blog content. Before You Go On: Would you like to see the system that most online marketers use to build their businesses (even if they tell you otherwise)? No Complicate Funnels, No Confusing Tech.. Just a simple easily replicable system. Automated Sales Machines – Click the link below to get the 100% free training Contents [hide] 1 2018 How Much Blogs Earn Report 1.0.1 A Standardised Metric 1.1 2017 vs 2018 RPM Figures 1.1.1 A More Representative Metric 2/15
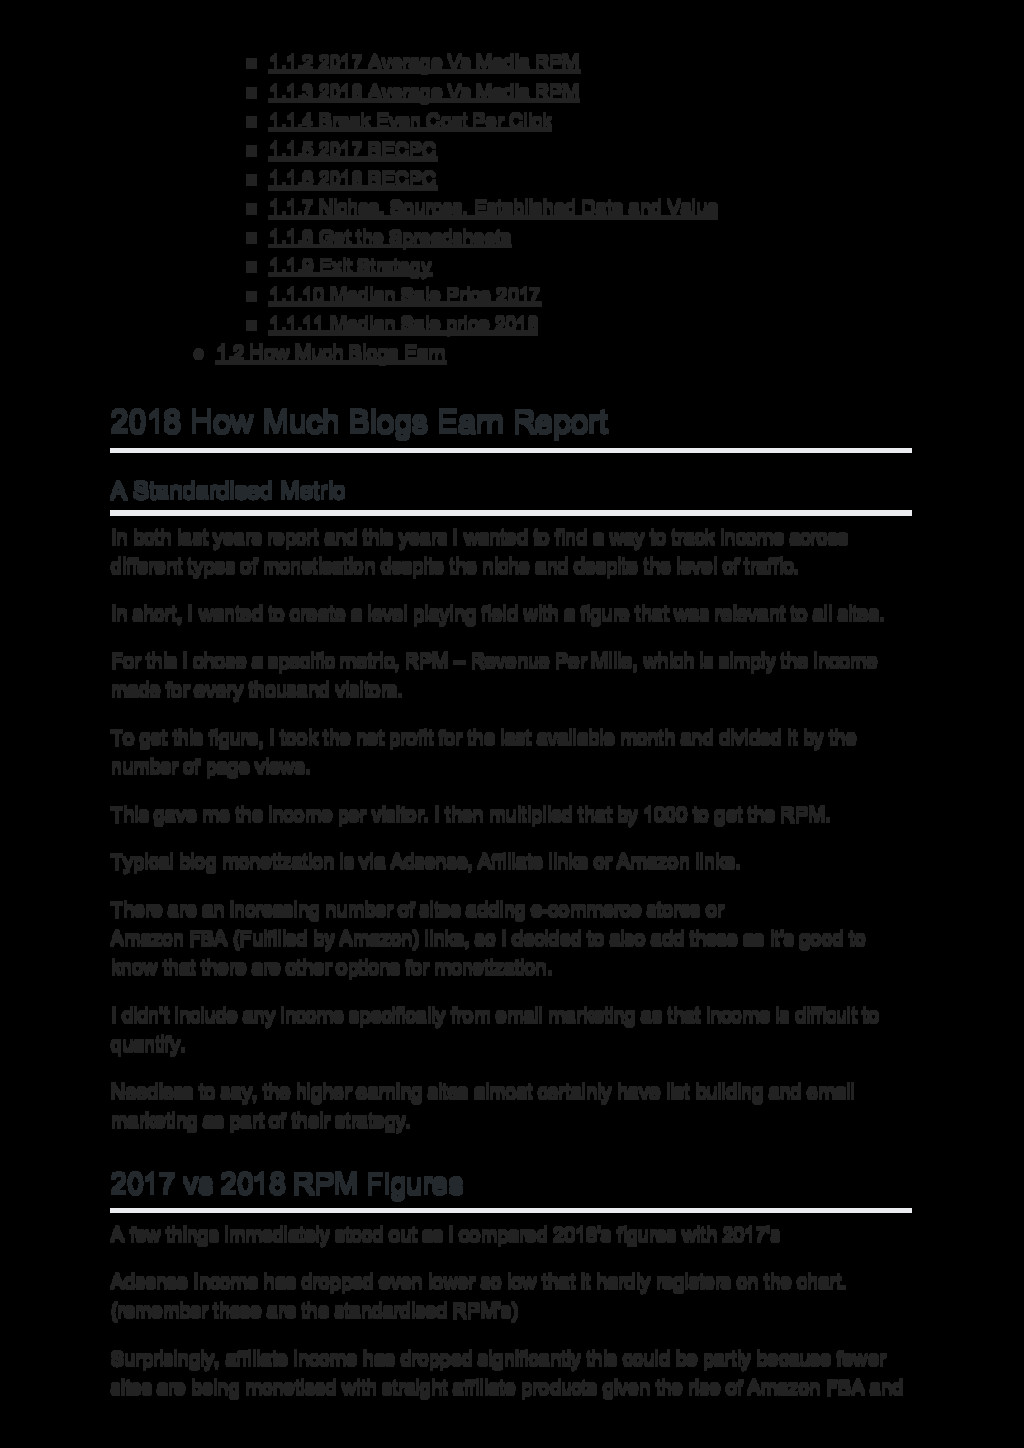
Media RPM 1.1.4 Break Even Cost Per Click 1.1.5 2017 BECPC 1.1.6 2018 BECPC 1.1.7 Niches, Sources, Established Date and Value 1.1.8 Get the Spreadsheets 1.1.9 Exit Strategy 1.1.10 Median Sale Price 2017 1.1.11 Median Sale price 2018 1.2 How Much Blogs Earn 2018 How Much Blogs Earn Report A Standardised Metric In both last years report and this years I wanted to find a way to track income across different types of monetisation despite the niche and despite the level of traffic. In short, I wanted to create a level playing field with a figure that was relevant to all sites. For this I chose a specific metric, RPM – Revenue Per Mille, which is simply the income made for every thousand visitors. To get this figure, I took the net profit for the last available month and divided it by the number of page views. This gave me the income per visitor. I then multiplied that by 1000 to get the RPM. Typical blog monetization is via Adsense, Affiliate links or Amazon links. There are an increasing number of sites adding e-commerce stores or Amazon FBA (Fulfilled by Amazon) links, so I decided to also add these as it’s good to know that there are other options for monetization. I didn’t include any income specifically from email marketing as that income is difficult to quantify. Needless to say, the higher earning sites almost certainly have list building and email marketing as part of their strategy. 2017 vs 2018 RPM Figures A few things immediately stood out as I compared 2018’s figures with 2017’s Adsense Income has dropped even lower so low that it hardly registers on the chart. (remember these are the standardised RPM’s) Surprisingly, affiliate income has dropped significantly this could be partly because fewer sites are being monetised with straight affiliate products given the rise of Amazon FBA and 3/15
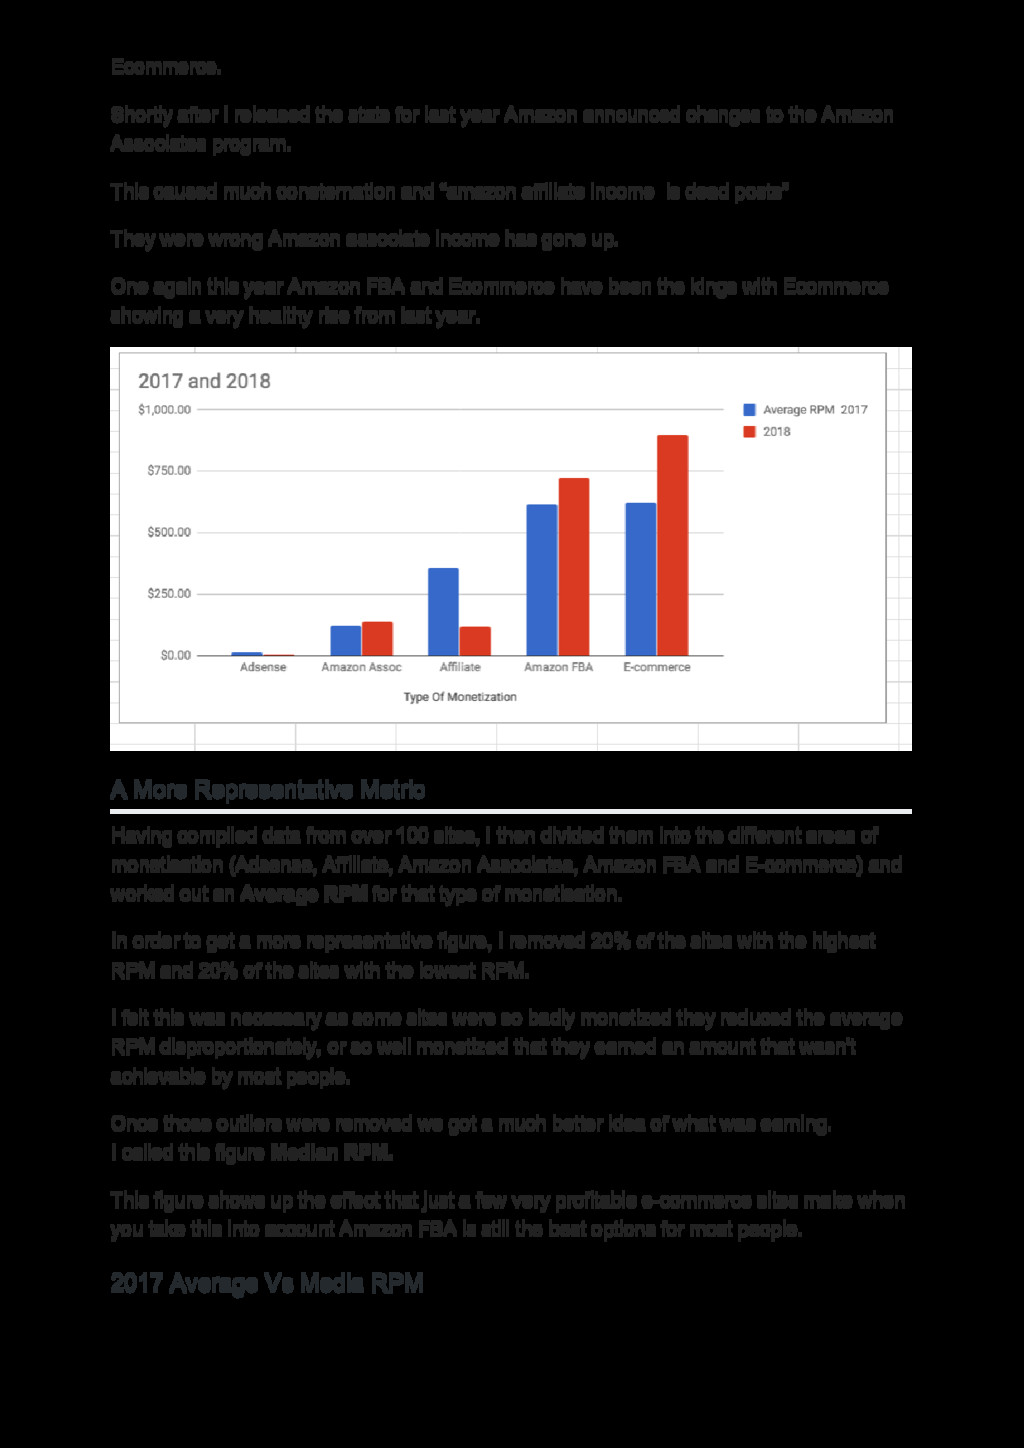
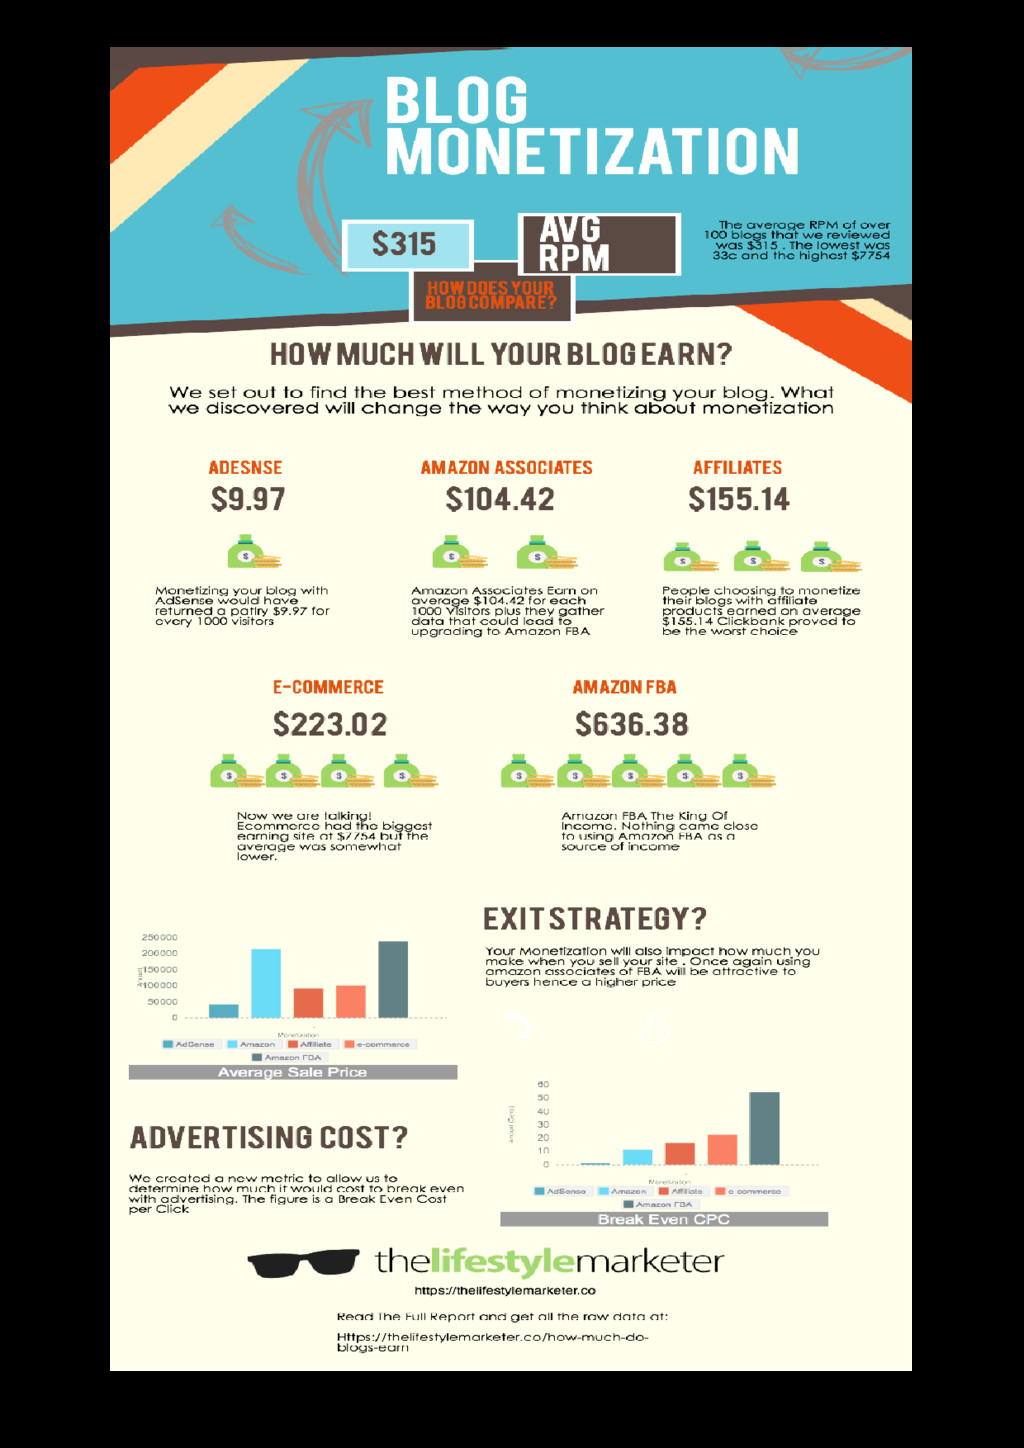
Amazon announced changes to the Amazon Associates program. This caused much consternation and “amazon affiliate income is dead posts” They were wrong Amazon associate income has gone up. One again this year Amazon FBA and Ecommerce have been the kings with Ecommerce showing a very healthy rise from last year. A More Representative Metric Having compiled data from over 100 sites, I then divided them into the different areas of monetisation (Adsense, Affiliate, Amazon Associates, Amazon FBA and E-commerce) and worked out an Average RPM for that type of monetisation. In order to get a more representative figure, I removed 20% of the sites with the highest RPM and 20% of the sites with the lowest RPM. I felt this was necessary as some sites were so badly monetized they reduced the average RPM disproportionately, or so well monetized that they earned an amount that wasn’t achievable by most people. Once those outliers were removed we got a much better idea of what was earning. I called this figure Median RPM. This figure shows up the effect that just a few very profitable e-commerce sites make when you take this into account Amazon FBA is still the best options for most people. 2017 Average Vs Media RPM 4/15
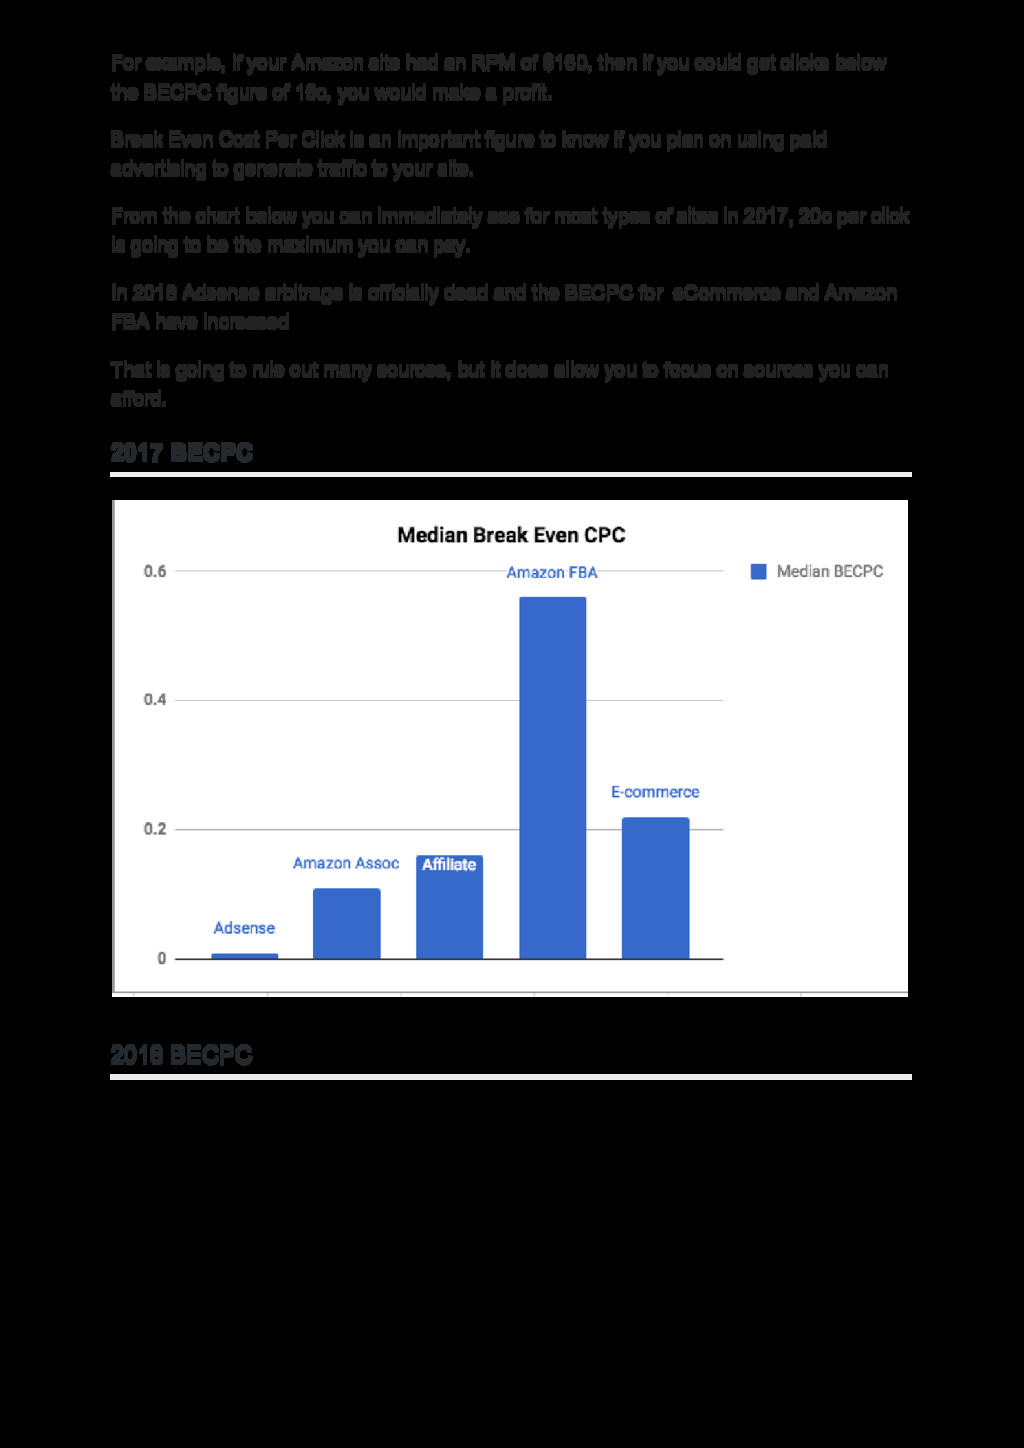
One final figure I added is a metric that I invented just for this report: BECPC – Break Even Cost Per Click. This is the cost per click you would need to pay to break even on advertising costs for an average or median RPM. 5/15
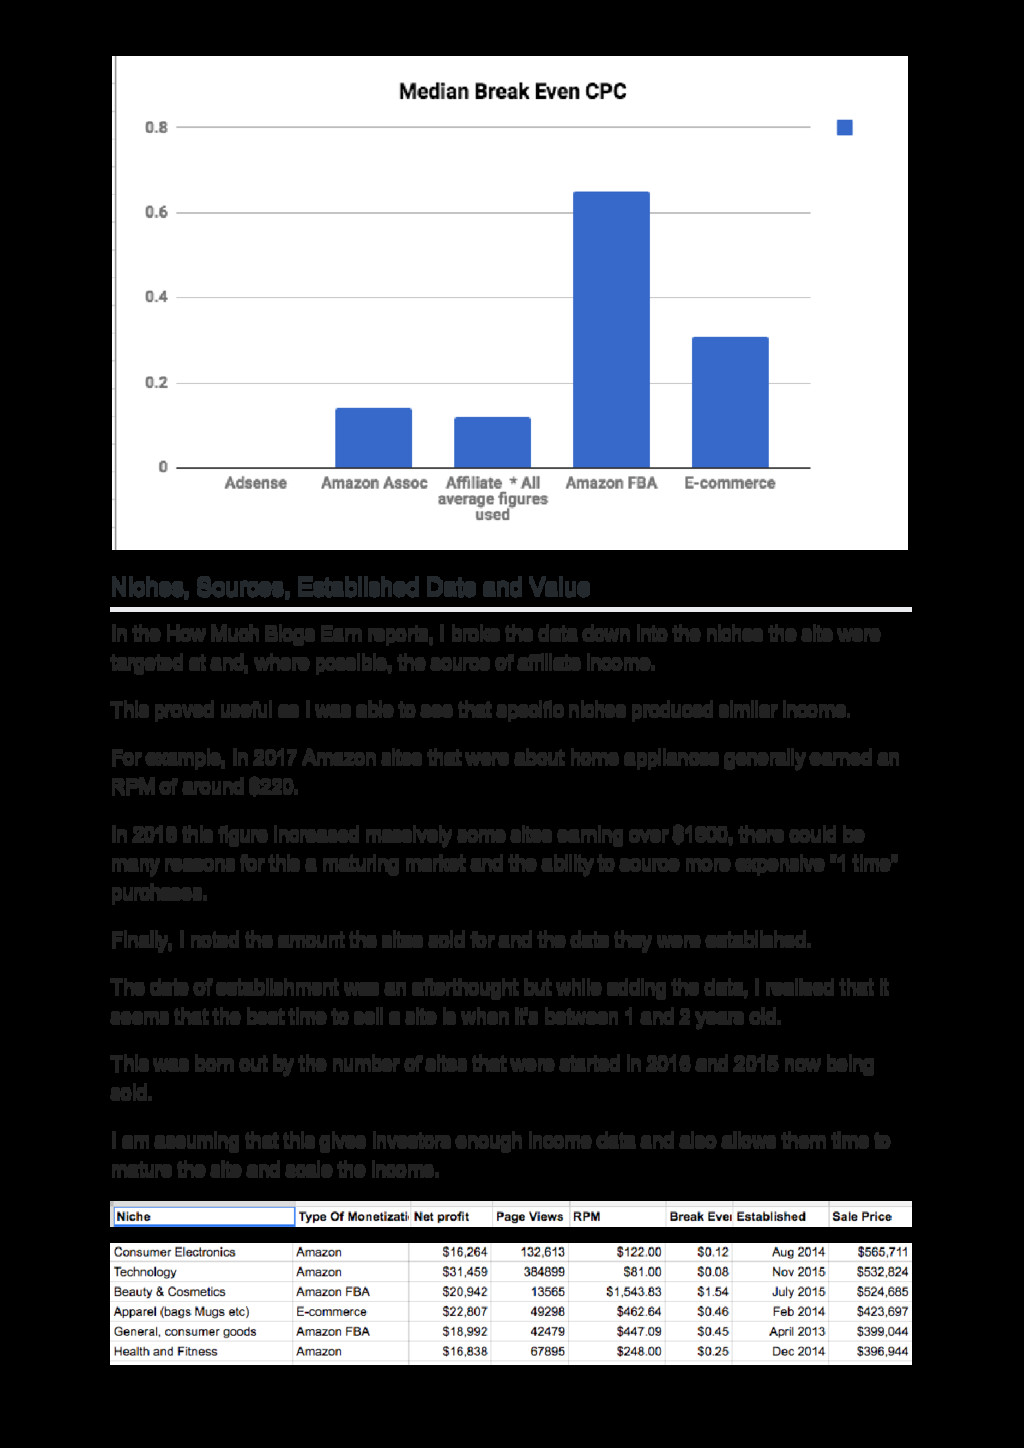
$160, then if you could get clicks below the BECPC figure of 16c, you would make a profit. Break Even Cost Per Click is an important figure to know if you plan on using paid advertising to generate traffic to your site. From the chart below you can immediately see for most types of sites in 2017, 20c per click is going to be the maximum you can pay. In 2018 Adsense arbitrage is officially dead and the BECPC for eCommerce and Amazon FBA have increased That is going to rule out many sources, but it does allow you to focus on sources you can afford. 2017 BECPC 2018 BECPC 6/15
Blogs Earn reports, I broke the data down into the niches the site were targeted at and, where possible, the source of affiliate income. This proved useful as I was able to see that specific niches produced similar income. For example, In 2017 Amazon sites that were about home appliances generally earned an RPM of around $220. In 2018 this figure increased massively some sites earning over $1600, there could be many reasons for this a maturing market and the ability to source more expensive “1 time” purchases. Finally, I noted the amount the sites sold for and the date they were established. The date of establishment was an afterthought but while adding the data, I realised that it seems that the best time to sell a site is when it’s between 1 and 2 years old. This was born out by the number of sites that were started in 2016 and 2015 now being sold. I am assuming that this gives investors enough income data and also allows them time to mature the site and scale the income. 7/15
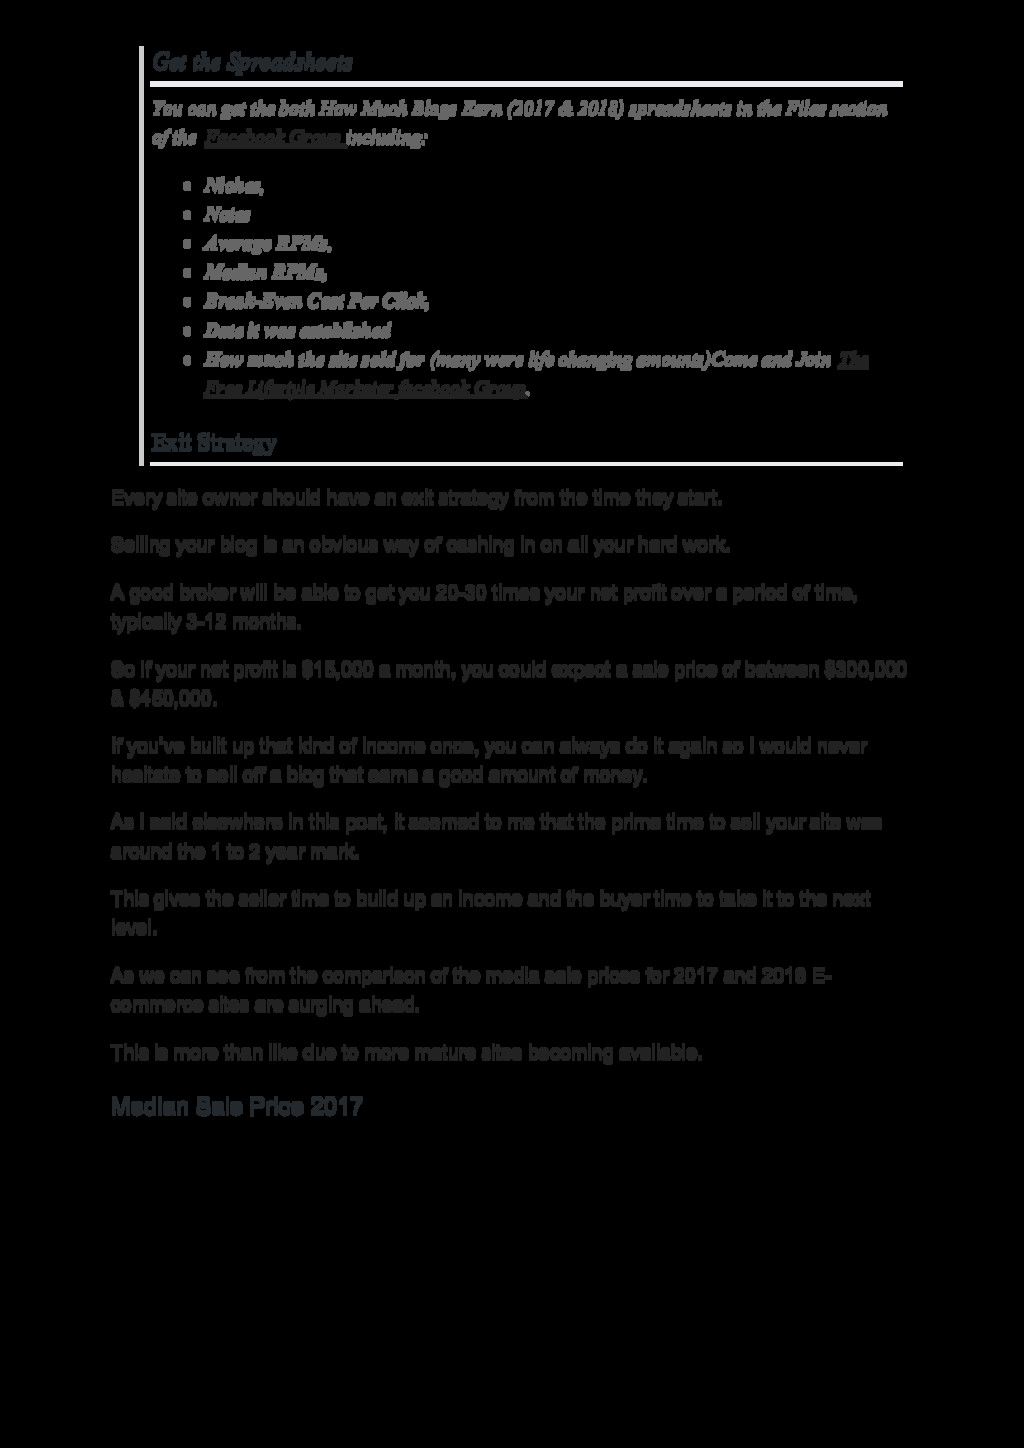
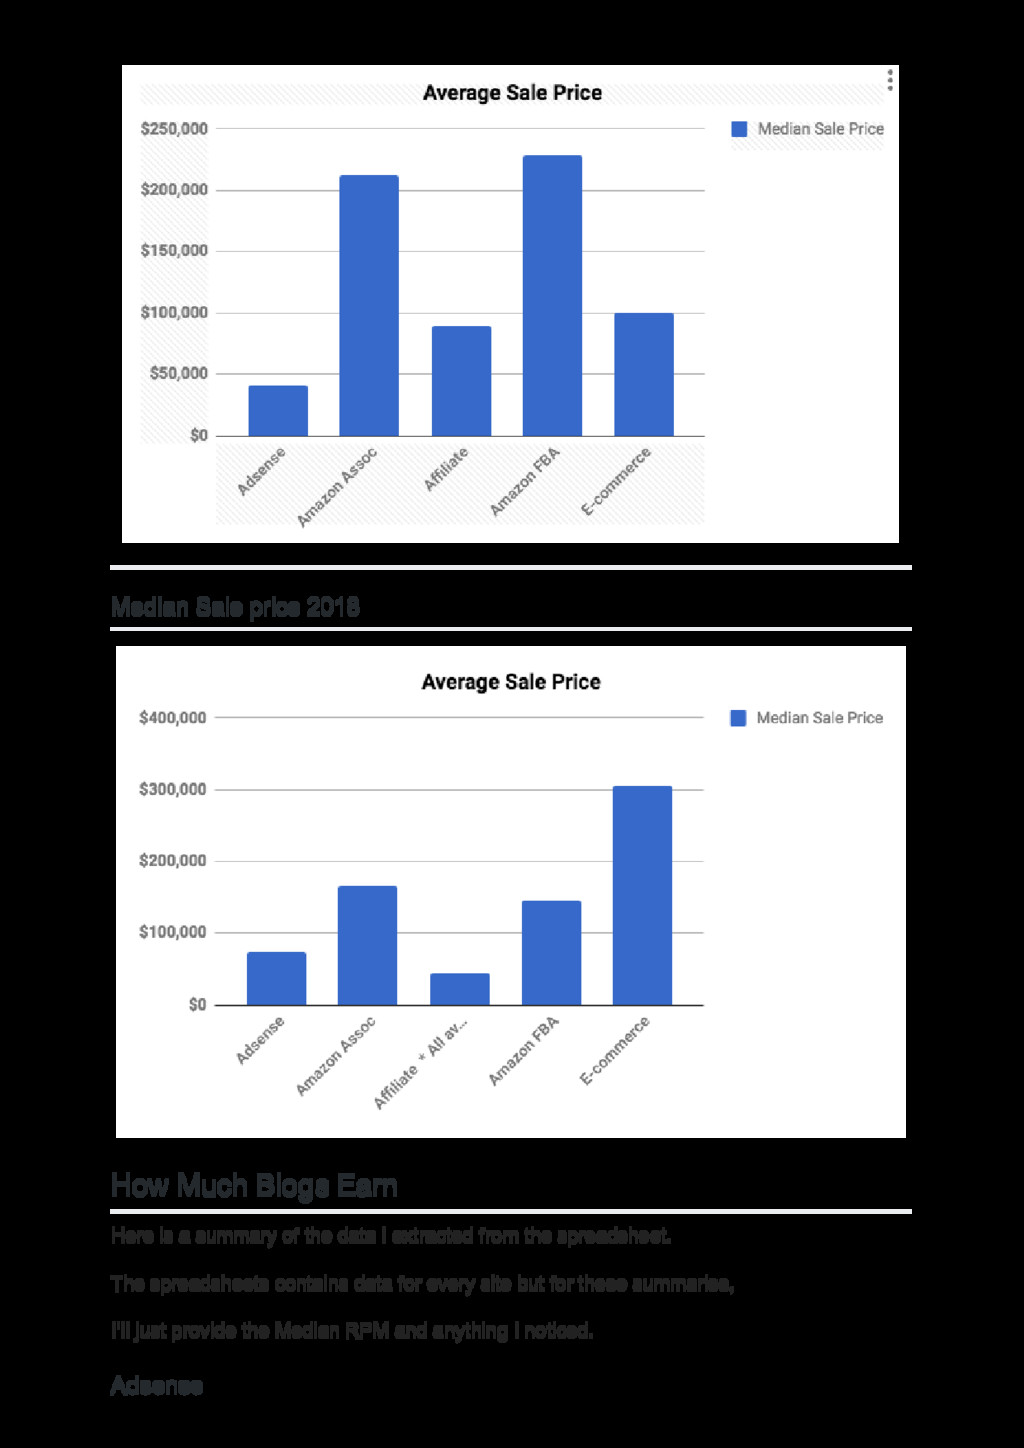
Blogs Earn (2017 & 2018) spreadsheets in the Files section of the Facebook Group including: Niches, Notes Average RPMs, Median RPMs, Break-Even Cost Per Click, Date it was established How much the site sold for (many were life changing amounts)Come and Join The Free Lifestyle Marketer facebook Group. Exit Strategy Every site owner should have an exit strategy from the time they start. Selling your blog is an obvious way of cashing in on all your hard work. A good broker will be able to get you 20-30 times your net profit over a period of time, typically 3-12 months. So if your net profit is $15,000 a month, you could expect a sale price of between $300,000 & $450,000. If you’ve built up that kind of income once, you can always do it again so I would never hesitate to sell off a blog that earns a good amount of money. As I said elsewhere in this post, it seemed to me that the prime time to sell your site was around the 1 to 2 year mark. This gives the seller time to build up an income and the buyer time to take it to the next level. As we can see from the comparison of the media sale prices for 2017 and 2018 E- commerce sites are surging ahead. This is more than like due to more mature sites becoming available. Median Sale Price 2017 8/15
a summary of the data I extracted from the spreadsheet. The spreadsheets contains data for every site but for these summaries, I’ll just provide the Median RPM and anything I noticed. Adsense 9/15
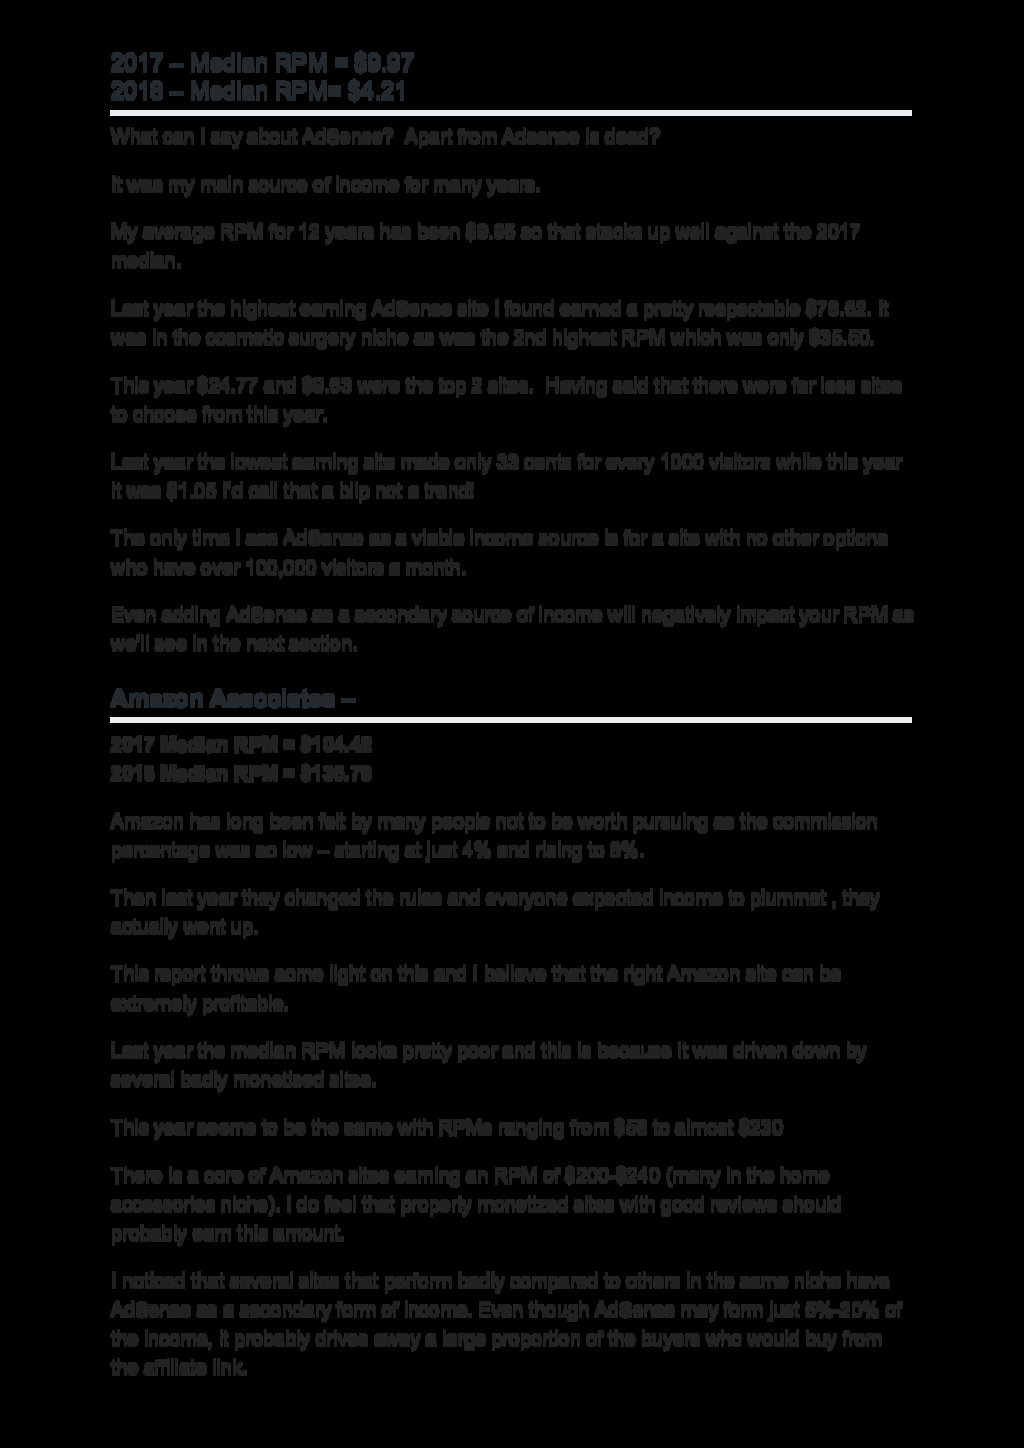
$4.21 What can I say about AdSense? Apart from Adsense is dead? It was my main source of income for many years. My average RPM for 12 years has been $9.95 so that stacks up well against the 2017 median. Last year the highest earning AdSense site I found earned a pretty respectable $78.62. It was in the cosmetic surgery niche as was the 2nd highest RPM which was only $35.50. This year $24.77 and $9.63 were the top 2 sites. Having said that there were far less sites to choose from this year. Last year the lowest earning site made only 33 cents for every 1000 visitors while this year it was $1.05 I’d call that a blip not a trend! The only time I see AdSense as a viable income source is for a site with no other options who have over 100,000 visitors a month. Even adding AdSense as a secondary source of income will negatively impact your RPM as we’ll see in the next section. Amazon Associates – 2017 Median RPM = $104.42 2018 Median RPM = $135.79 Amazon has long been felt by many people not to be worth pursuing as the commission percentage was so low – starting at just 4% and rising to 8%. Then last year they changed the rules and everyone expected income to plummet , they actually went up. This report throws some light on this and I believe that the right Amazon site can be extremely profitable. Last year the median RPM looks pretty poor and this is because it was driven down by several badly monetised sites. This year seems to be the same with RPMs ranging from $58 to almost $230 There is a core of Amazon sites earning an RPM of $200-$240 (many in the home accessories niche). I do feel that properly monetized sites with good reviews should probably earn this amount. I noticed that several sites that perform badly compared to others in the same niche have AdSense as a secondary form of income. Even though AdSense may form just 5%-20% of the income, it probably drives away a large proportion of the buyers who would buy from the affiliate link. 10/15
for a 9c click. Not good business. One stat that may persuade any doubters about the value of the Amazon Associates program is that last year the average sale price for an Amazon site was over $212,000 compared to $41,000 for an AdSense site This year the average figure dropped to $165,000but the top price was now over $300K In fact, last year Amazon sites averaged more than any other apart from Amazon FBA and that had a $1.9m sale included. Last year the top site monetised by the Amazon Associate program had an RPM of $406.70 and the lowest, $18.10 this year the figure has a much smaller range $58 to $227 Affiliate Marketing 2017 Median RPM = $155.14 2018 Average* RPM = $120.63 I was tempted to drop this figure as there were very few Affiliate sites this year. In fact you’ll see that I used the average figure and not the median figure because there were so few. However i still feel the following comments from last year are valid In the 2017 report sites monetized with affiliate links had one of the widest spreads of RPM, from 99c to $3,715. While most people relate affiliate income to selling ClickBank products, that was far from being the case. In fact, the only ClickBank based site I identified had one of the lowest RPMs. CPA sites (Cost Per Aquisition) were far more prevalent and top of the pile was ShareASale, one of the longest established sites. Interestingly, while many of the RPMs were good, the incomes weren’t particularly high. This was because lower traffic levels also resulted in lower sale prices. Affiliate marketing is still popular but it seems from the sites I analyzed Clickbank isn’t as popular as it once was and sites monetized with offers from what are traditionally known as CPA Networks seem to be on the rise. E-commerce 2017 Median RPM = $223.02 2018 Median RPM = $312.38 E-commerce had by far the highest average RPM in 2017 at $625, This year it surpassed that with a figure of $899 11/15
sites doing extremely well. Hold onto your hats!.. Last year the top 3 sites have RPMs of over $1,000, so were earning more than $1 per visitor. The best was earning over $7 per visitor. This year the same thing 2 sites earning over $5 per visitor and the third earning nearly $3 per visitor There is no doubt that with a Shopify store and the right products, the world is your oyster. The problem for many sites seemed to be scaling up the traffic. I suspect this is because there is a lot of competition in several niches and only so many Facebook customers to target. Once again many of the sites of the sites were in the apparel niche. The median break even Cost per Click figure was 31c compared to 22c last year To generate the profit needed, you would have to be getting traffic at less than 16c, not easy on Facebook if there is a lot of competition. If you can find a unique product and identify the right target, then e-commerce could be the perfect add on for your blog. Amazon FBA 2017 Median RPM = $587.43 2018 median RPM = $653.38 All hail the king of online incomes. Amazon FBA (Fulfilled by Amazon, which means you send your products to Amazon and they sell and deliver them for you). It’s no surprise really as anyone who is on the Amazon store is in buying mode. Now before you all shout, “but this doesn’t have to do with blogging,” there is nothing stopping you from replacing your best selling Amazon Associates products with your own FBA products. So for example, if you had an Amazon Associates site reviewing cat beds and you are selling a few a day, it’s very possible to replace the top selling one with your own version. You can source the same products on Alibaba for $4 that are selling on Amazon for $30. Don’t think it would work? Compare the Amazon Associates RPM of $135 with the Amazon FBA of $653. How Much Blogs Earn – Conclusion The conclusion to this report is simple: choose your monetisation wisely. 12/15
also how much you can sell your site for in the end. I’ve included all the How Much blogs Earn raw data in the Facebook group, why not come and join us and discuss the report? Come and Join The Free Minimalist Marketer facebook Group. 13/15