Upgrade to Pro — share decks privately, control downloads, hide ads and more …

Operational visibility in distributed systems through instrumentation

Operational visibility in distributed systems through instrumentation

Given at WTFIsSRE 2022

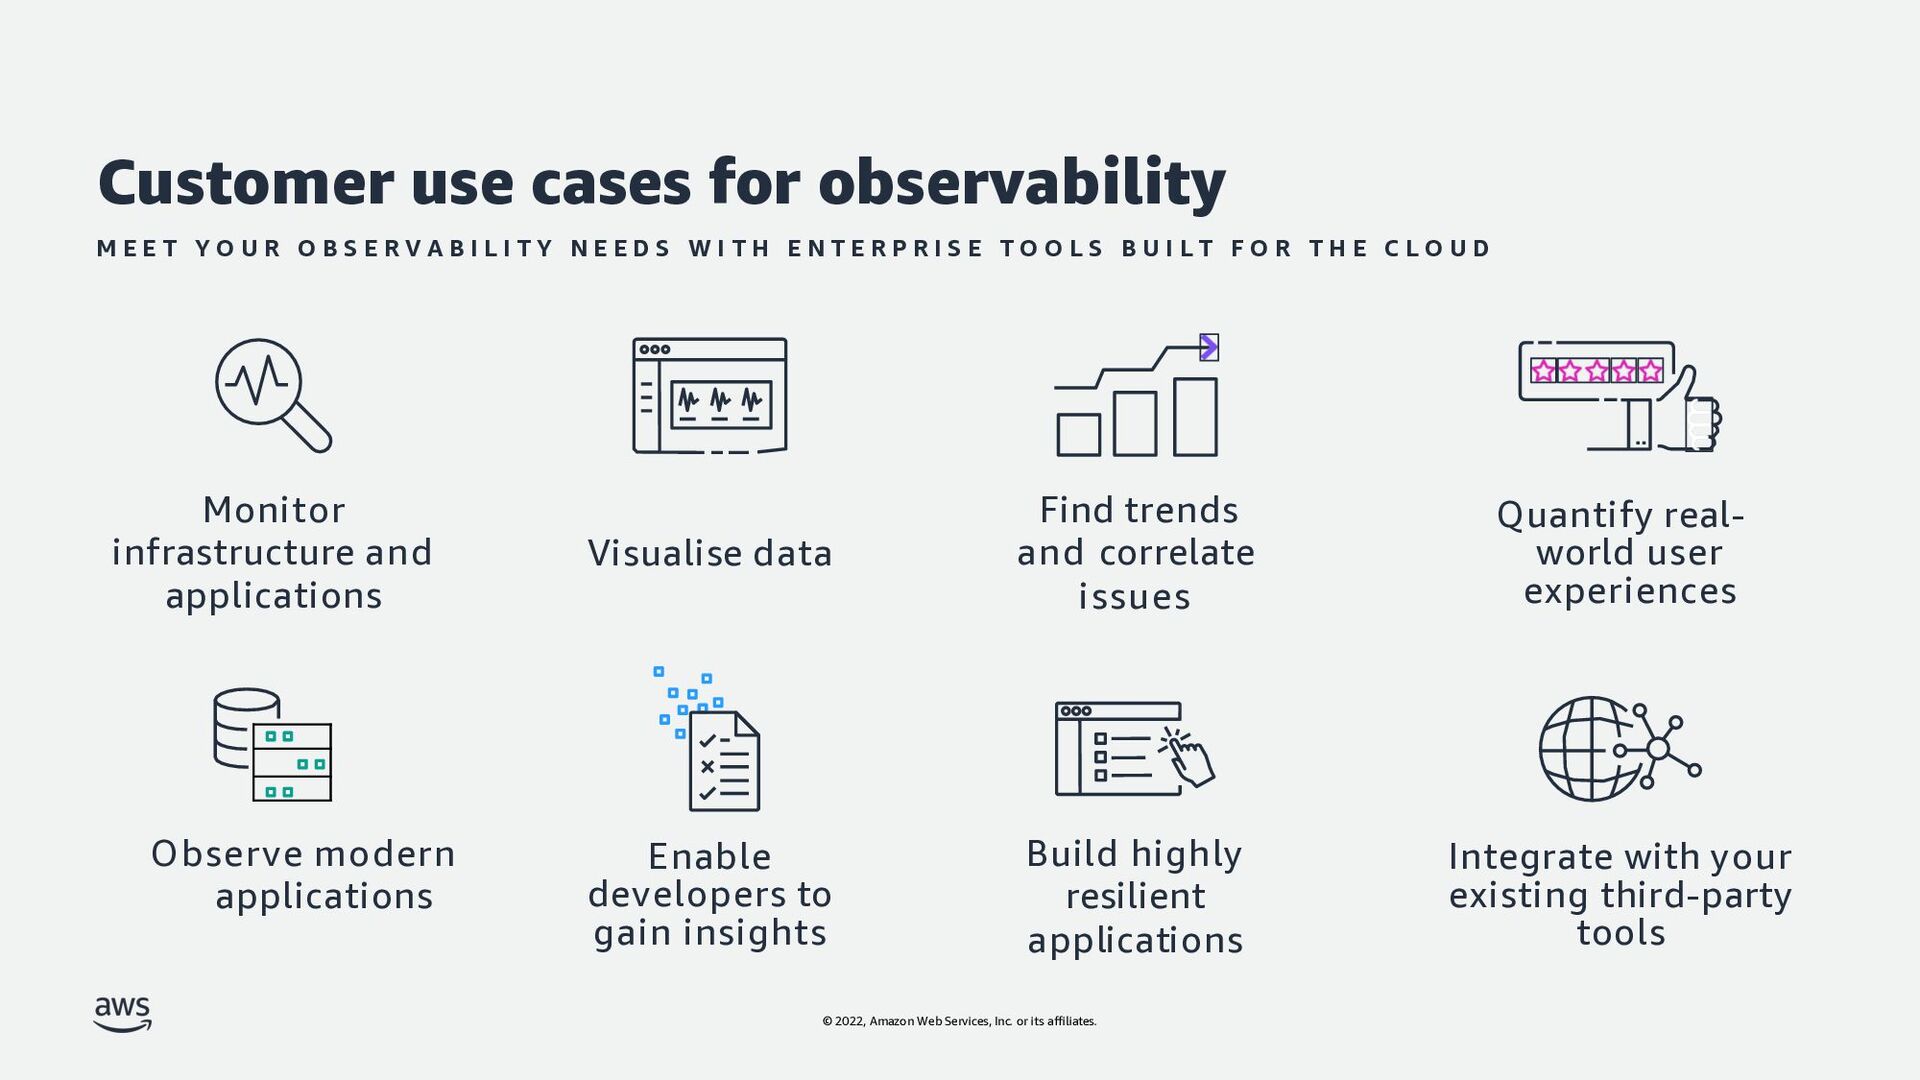
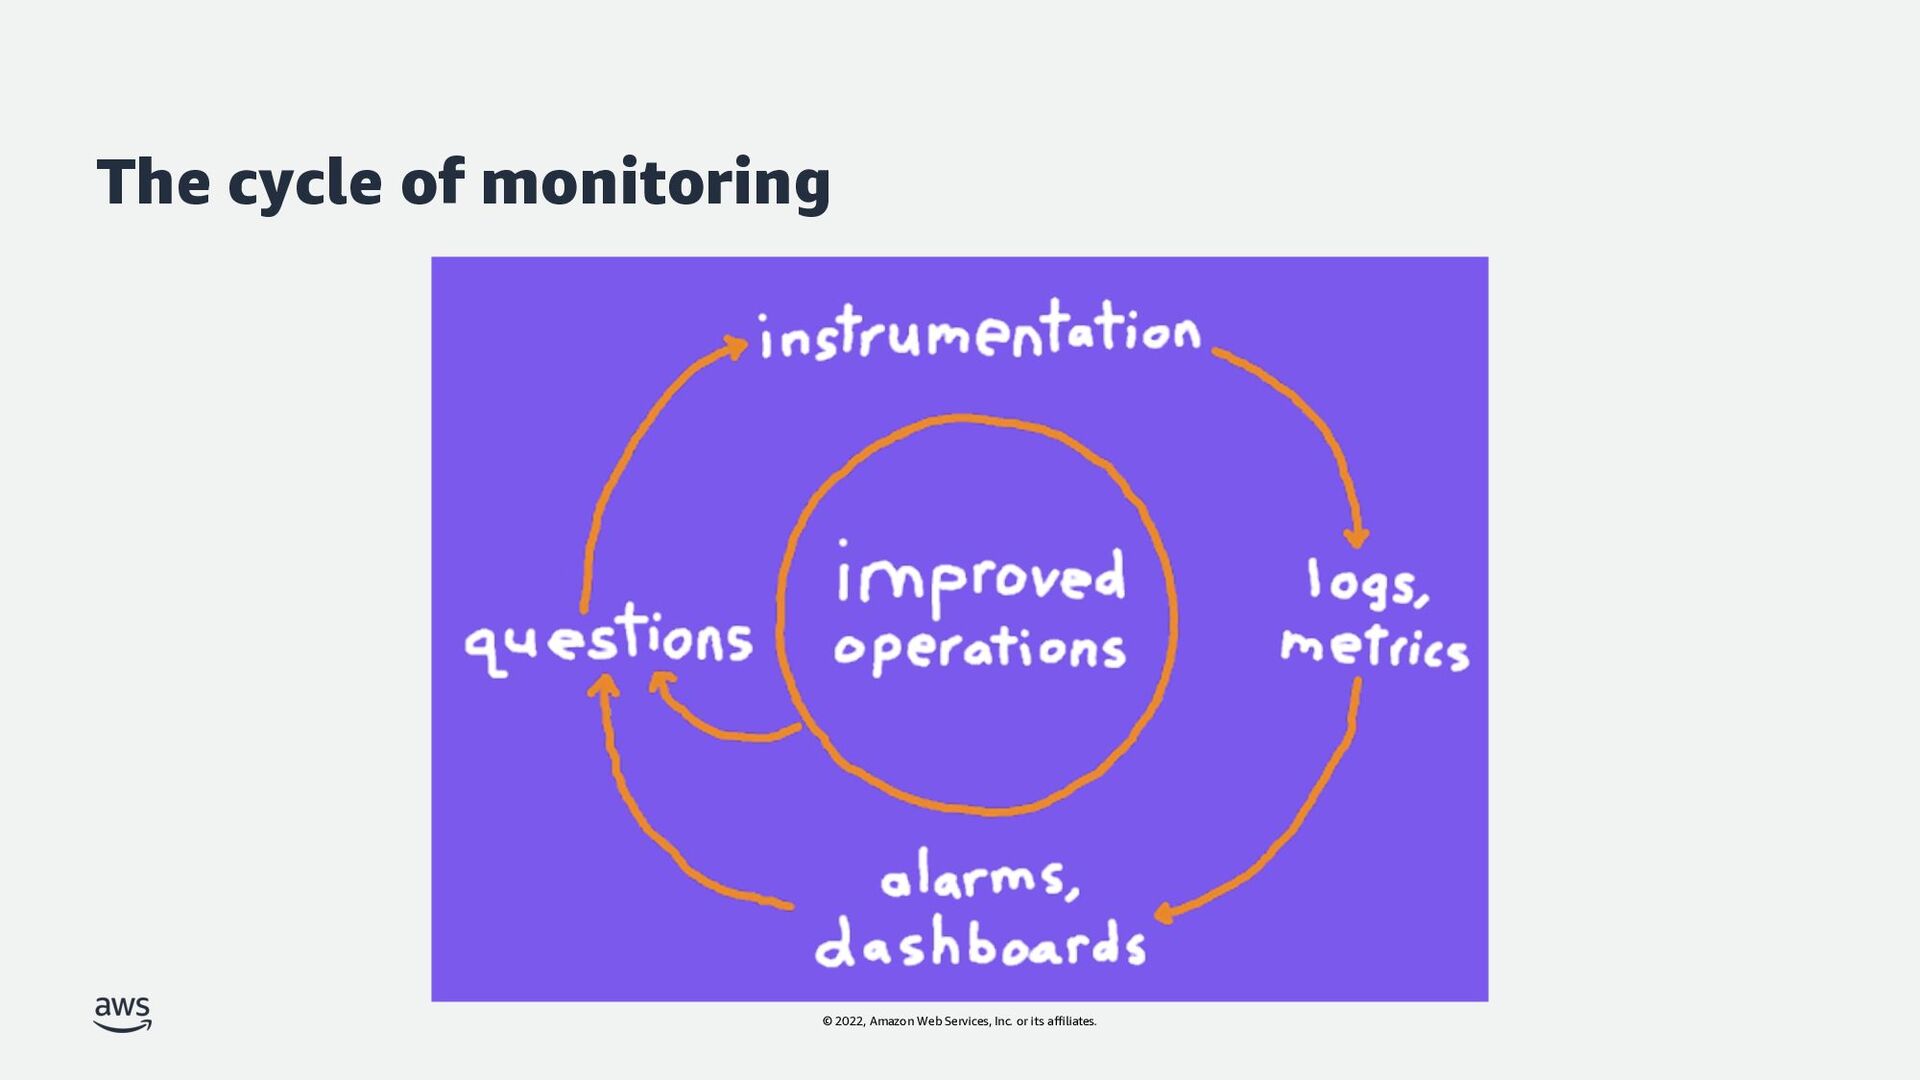
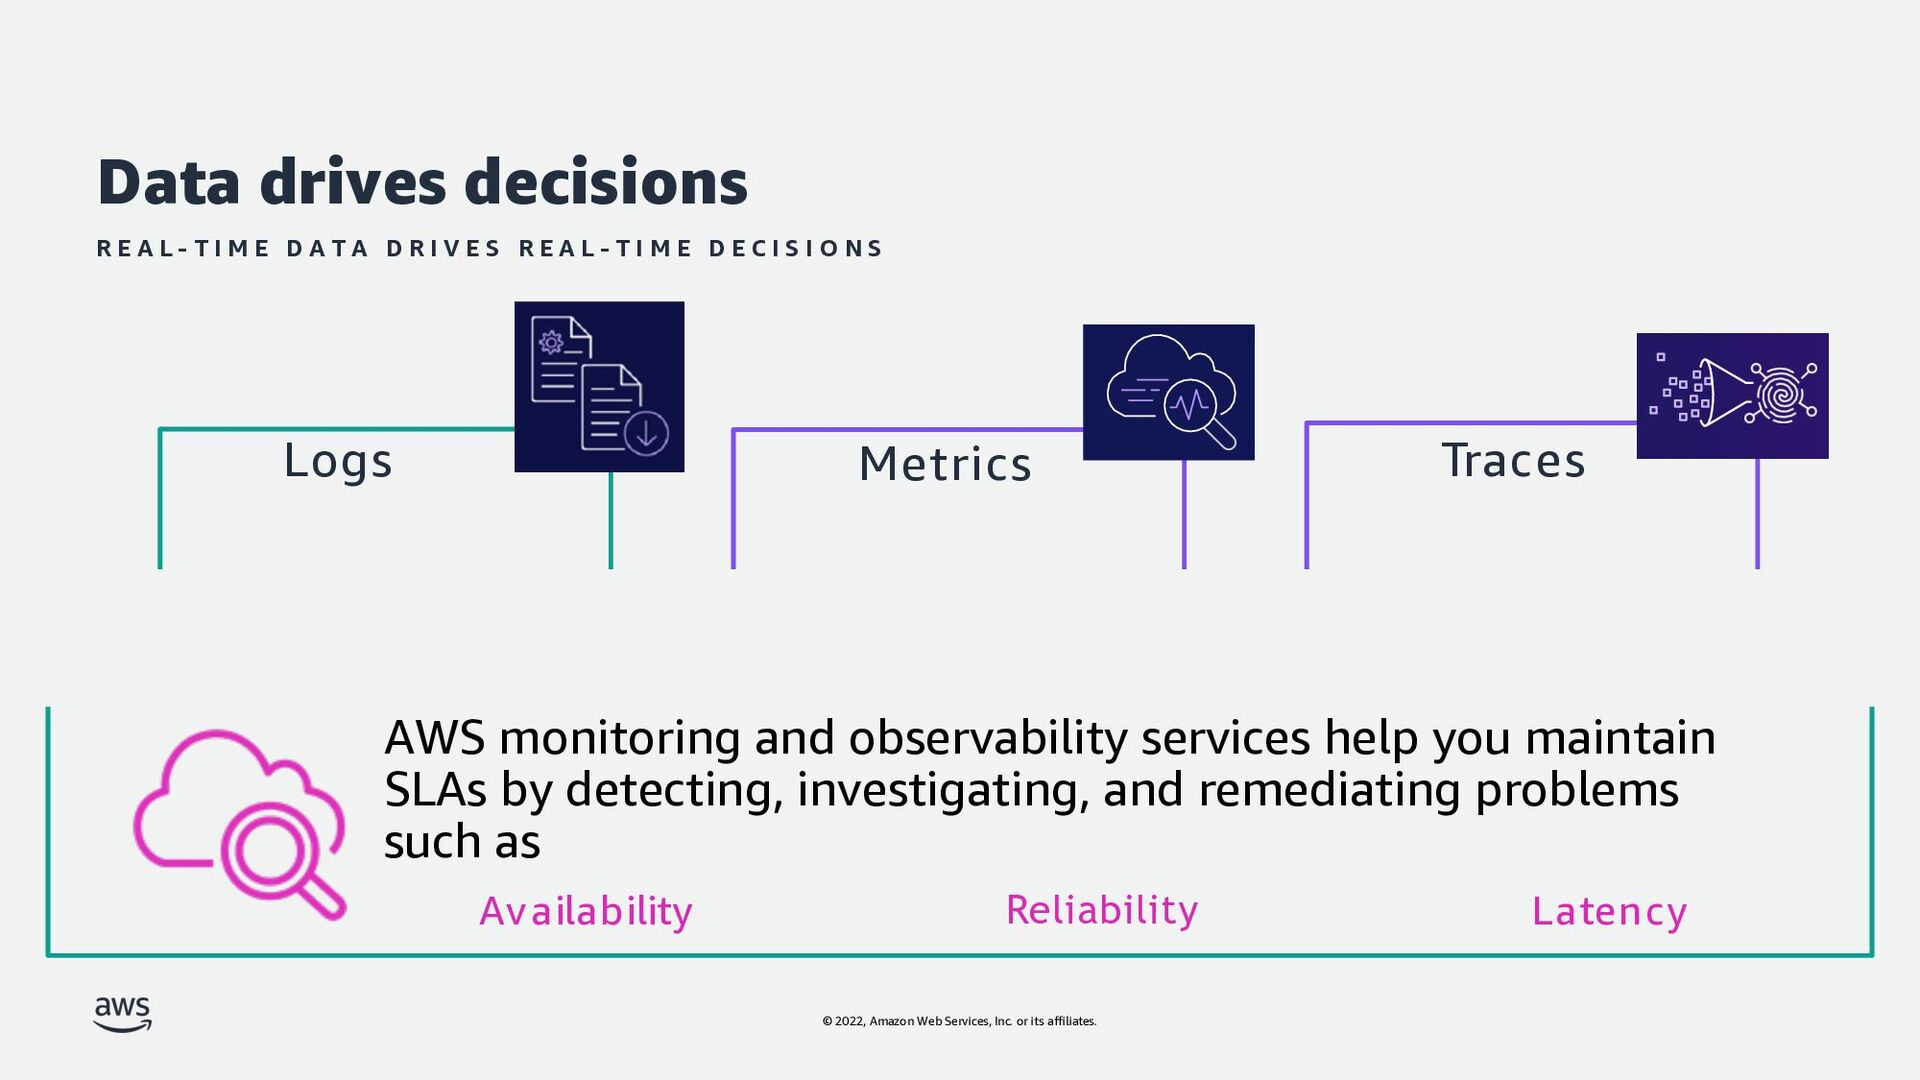
In this session, we will cover approaches on how to gain operational visibility into production systems, and troubleshoot failures with software instrumentation. We will cover the approaches to instrumentation, some best practices, and some services you can use in AWS to achieve operational visibility in your systems.

Attendees understand how to wade through the complexity of having operational visibility in distributed systems with best practices on how to achieve this.

Mohammed Fazalullah

April 28, 2022
Tweet

More Decks by Mohammed Fazalullah

Other Decks in Technology

Transcript

  1. © 2022, Amazon Web Services, Inc. or its affiliates. ©

    2022, Amazon Web Services, Inc. or its affiliates. Operational visibility in distributed systems Mohammed Fazalullah Qudrath Senior Developer Advocate, MENA Amazon Web Services
  2. © 2022, Amazon Web Services, Inc. or its affiliates. What

    we will cover today Why instrumentation is important What to measure Log best practices High throughput services logging Resources to learn more from
  3. © 2022, Amazon Web Services, Inc. or its affiliates. Werner

    Vogels VP & CTO Amazon.com “ ” © 2022, Amazon Web Services, Inc. or its affiliates. All rights reserved.
  4. © 2022, Amazon Web Services, Inc. or its affiliates. What

    is observability Observability is a measure of how well internal states of a system can be inferred from knowledge of its external outputs Monitoring tells you whether a system is working; observability lets you understand why it isn't working Good observability allows you to answer the questions you didn’t know that you needed to ask
  5. © 2022, Amazon Web Services, Inc. or its affiliates. Observability

    is monitoring more than failures What is the business impact? What is the usage? Is it behaving as expected?
  6. © 2022, Amazon Web Services, Inc. or its affiliates. User

    saw 503 error Monitoring Observability Metrics – What browser agents connected to my page? Which saw 503 errors? Logs – /purchase/dogtoy gailed to connect with credit card company Traces – How long did I spend trying to connect with the credit card company? Who else did I try sending traffic to? compared to
  7. © 2022, Amazon Web Services, Inc. or its affiliates. Monitoring

    layers – Traditional deployment Server Hardware Network/Storage (Virtualized) Hardware Operating System Runtime / Middleware Application + Data
  8. © 2022, Amazon Web Services, Inc. or its affiliates. Monitoring

    layers – Container deployment Server Hardware Network/Storage (Virtualized) Hardware Operating System Container Runtime Application Container Kubernetes
  9. © 2022, Amazon Web Services, Inc. or its affiliates. A

    system is observable if the behavior of the entire system can be determined by only looking at it’s inputs and outputs Rudolf E. Kalman In 1960 paper on general theory of control systems
  10. © 2022, Amazon Web Services, Inc. or its affiliates. Signal

    lifecycle Instrument Capture Transport Analyze Act Language-specific SDK OR Runtime-specific agent Collection agent to transport data Dashboarding tool to monitor signals Alerting mechanism to send notifications
  11. © 2022, Amazon Web Services, Inc. or its affiliates. ©

    2022, Amazon Web Services, Inc. or its affiliates. Instrument
  12. © 2022, Amazon Web Services, Inc. or its affiliates. Why

    instrumentation is important – Amazon.com • Instrumentation is a lens to learn how a system works • Amazon.com is built on a service-oriented architecture, many services collobrate with each other to get something done • Increase in latency deep in the call chain has a ripple effect on latency • Instrumentation enables us to detect and respond to operational events tactically • Feed data into operational dashboard through instrumentation
  13. © 2022, Amazon Web Services, Inc. or its affiliates. What

    to measure • As a Service owner, I need to: § Measure system behavior § Make sense of a request flow through a distributed system § Have one place to pull together all measurements • Instrument each service with a trace ID § Propogate the trace ID to every other service collaborating on the task § Collect instrumentation across systems for a given trace ID
  14. © 2022, Amazon Web Services, Inc. or its affiliates. Drill

    down • Instrumentation is aggregated into metrics that can trigger alarms and display on dashboards • Why is an anomaly happening? Reliance on metrics with more instrumentation • If metrics arent enough then look at the raw, detailed log data
  15. © 2022, Amazon Web Services, Inc. or its affiliates. How

    to instrument • Instrumentation requires coding • Look at adopting common patterns: § Standardization for common instrumentation libraries § Standardization for structured log-based metric reporting • Instrumented application’s resulting telemetry data written to a structured log file – Emitted as one log entry per “unit of work” • At Amazon we log first, and produce aggreate metrics later
  16. © 2022, Amazon Web Services, Inc. or its affiliates. Different

    types of logging Unstructured [INFO] 2021-04-21T12:34:56Z Order 'fdbf7245' created with 5 products Semi-structured [INFO] 2021-04-21T12:34:56Z {"message": " Order 'fdbf7245' created with 5 products"} Structured { "loglevel": "INFO", "timestamp": "2021-04-21T12:34:56Z", "message": " Order 'fdbf7245' created with 5 products", "orderId": "fdbf7245", "productCount": 5 }
  17. © 2022, Amazon Web Services, Inc. or its affiliates. Instrumentation

    through logging • Instrument services to emit two types of log data: § Request data § Debugging data • Request log data represented as a single structured log entry for each “unit of work” • Debugging data includes unstructured debugging lines emitted • Consider detailed logs especially when you have to investigate avaailability blips, latency spikes and customer-related problems • Detailed logs allow you to provide customers with answers and improve services
  18. © 2022, Amazon Web Services, Inc. or its affiliates. ©

    2022, Amazon Web Services, Inc. or its affiliates. Log best practices
  19. © 2022, Amazon Web Services, Inc. or its affiliates. Request

    log best practices – How we log at Amazon • Emit one request log entry for every unit of work. • Emit no more than one request log entry for a given request. • Break long-running tasks into multiple log entries. • Record details about the request before doing stuff like validation. • Plan for a way to log at increased verbosity. • Ensure log volumes are big enough to handle logging at max throughput. • Consider the behavior of the system when disks fill up
  20. © 2022, Amazon Web Services, Inc. or its affiliates. Request

    log best practices – What we log at Amazon • Log a trace ID and propagate it in backend calls • Log the availability and latency of all of dependencies. • Add an additional counter for every error reason • Organize errors by category of cause. • Log important metadata about the unit of work. • Protect logs with access control and encryption.
  21. © 2022, Amazon Web Services, Inc. or its affiliates. Application

    log best practices • Include the corresponding request ID • Rate-limit an application log’s error spam • Log request IDs from failed service calls
  22. © 2022, Amazon Web Services, Inc. or its affiliates. AWS

    observability tools Container Insights Metrics Explorer Synthetics ServiceLens X-Ray Insights Lambda Insights Contributor Insights Automatically identifies issues using Anomaly Detection and notifies you Deeper insights into lambda performance and health metric data Create time-series data from CloudWatch logs on top contributors Fully managed container monitoring platform Perform real-user monitoring on websites and end-points Easily correlate logs, metrics and traces to quickly identify service bottle-necks Dynamic dashboards based on resource tags
  23. © 2022, Amazon Web Services, Inc. or its affiliates. AWS

    Services for observability INFRASTRUCTURE VMs, Containers, OS AWS SERVICES Vended Monitoring APPLICATION PERFORMANCE Tracing and Profiling END-USER Synthetic Monitoring Amazon CloudWatch Amazon Managed Service for Prometheus Amazon Managed Service for Grafana Amazon CloudWatch AWS X-Ray Amazon CodeGuru Amazon Distro for Open Telemetry Amazon CloudWatch Amazon CloudWatch AWS X-Ray AWS NATIVE OPEN SOURCE PARTNER APN APN APN Amazon Distro for Open Telemetry
  24. © 2022, Amazon Web Services, Inc. or its affiliates. AWS

    services for observability AWS X-Ray Amazon CloudWatch Dashboards Logs Metrics Alarms Events Traces Analytics Service map
  25. © 2022, Amazon Web Services, Inc. or its affiliates. Build

    highly resilient applications Find trends and correlate issues Monitor infrastructure and applications Observe modern applications Enable developers to gain insights Visualise data Quantify real- world user experiences Integrate with your existing third-party tools Customer use cases for observability M E E T Y O U R O B S E R V A B I L I T Y N E E D S W I T H E N T E R P R I S E T O O L S B U I L T F O R T H E C L O U D
  26. © 2022, Amazon Web Services, Inc. or its affiliates. Querying

    logs Amazon CloudWatch Logs Insights • Interactively search and analyze your log data in CloudWatch Logs • Processes structured log data • Flexible purpose-built query language • Query up to 20 log groups • Save queries fields Timestamp, LogLevel, Message | filter LogLevel == "ERR" | sort @timestamp desc | limit 10 https://s12d.com/loginsights-examples
  27. © 2022, Amazon Web Services, Inc. or its affiliates. •

    Scales for microservice and serverless architectures • Identify the root cause of performance issues and errors • X-Ray provides a cross-service view of requests made to application • Aggregates data across services into a trace (via a passed trace identifier) • Support for Lambda, API Gateway, SNS, Step Functions, DynamoDB, S3, etc. Enable tracing in distributed applications AWS X-Ray
  28. © 2022, Amazon Web Services, Inc. or its affiliates. Metrics

    Traces AWS monitoring and observability services help you maintain SLAs by detecting, investigating, and remediating problems such as Reliability Availability Latency Data drives decisions R E A L - T I M E D A T A D R I V E S R E A L - T I M E D E C I S I O N S Logs
  29. © 2022, Amazon Web Services, Inc. or its affiliates. Additional

    resources Amazon Builders’ Library Instrumenting distributed systems for operational visibility Look at your data by former Amazonian John Rauser Investigating anomalies by former Amazonian John Rauser One Observability Workshop Workshop on monitoring and observability using AWS Monitoring production services at Amazon by David Yanacek, Senior Principal Engineer, AWS
  30. © 2022, Amazon Web Services, Inc. or its affiliates. Serverless

    observability learning path s12d.com/mastering-observability
  31. © 2022, Amazon Web Services, Inc. or its affiliates. Thank

    you! © 2022, Amazon Web Services, Inc. or its affiliates.