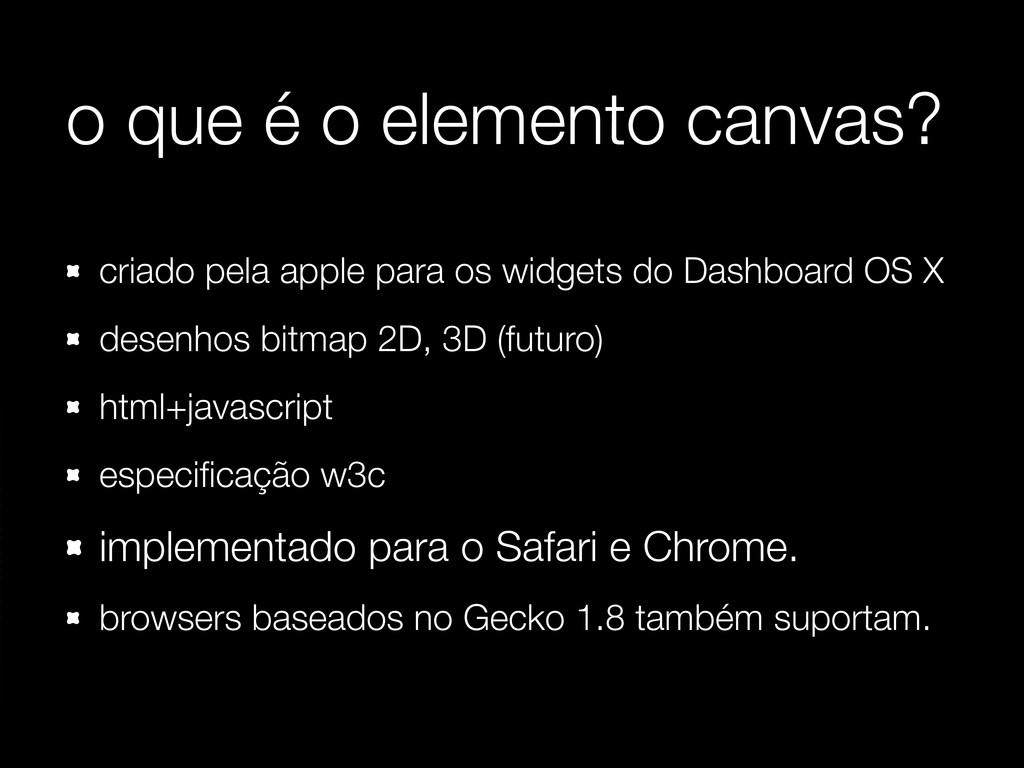
os widgets do Dashboard OS X desenhos bitmap 2D, 3D (futuro) html+javascript especificação w3c implementado para o Safari e Chrome. browsers baseados no Gecko 1.8 também suportam.
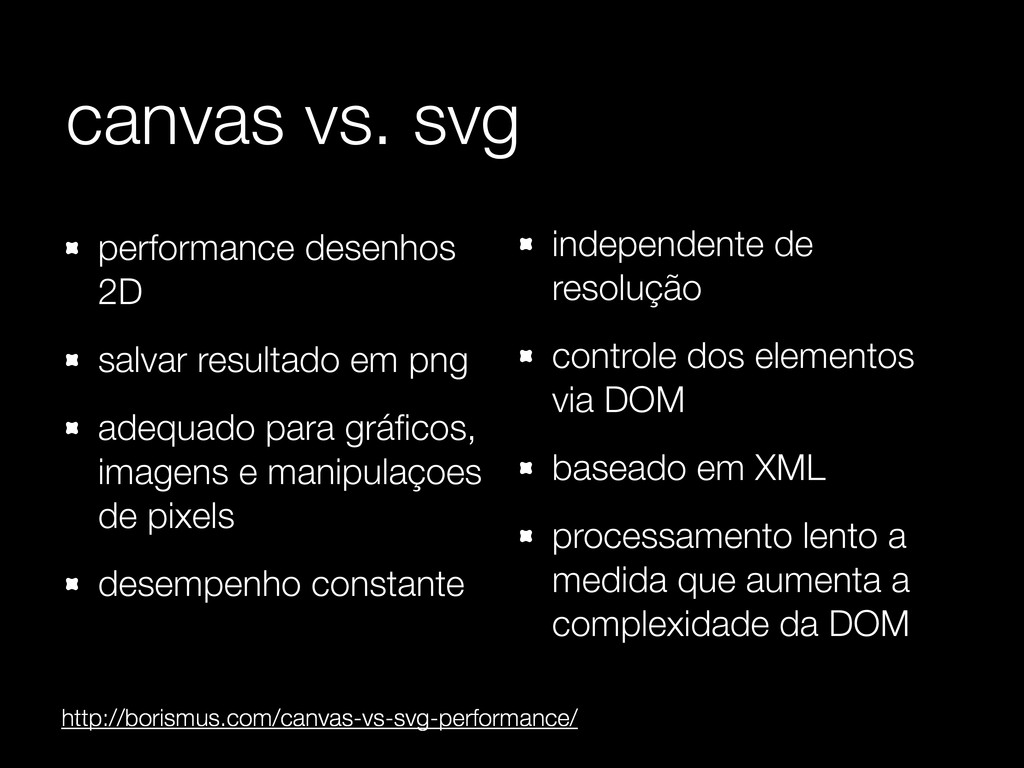
adequado para gráficos, imagens e manipulaçoes de pixels desempenho constante independente de resolução controle dos elementos via DOM baseado em XML processamento lento a medida que aumenta a complexidade da DOM http://borismus.com/canvas-vs-svg-performance/
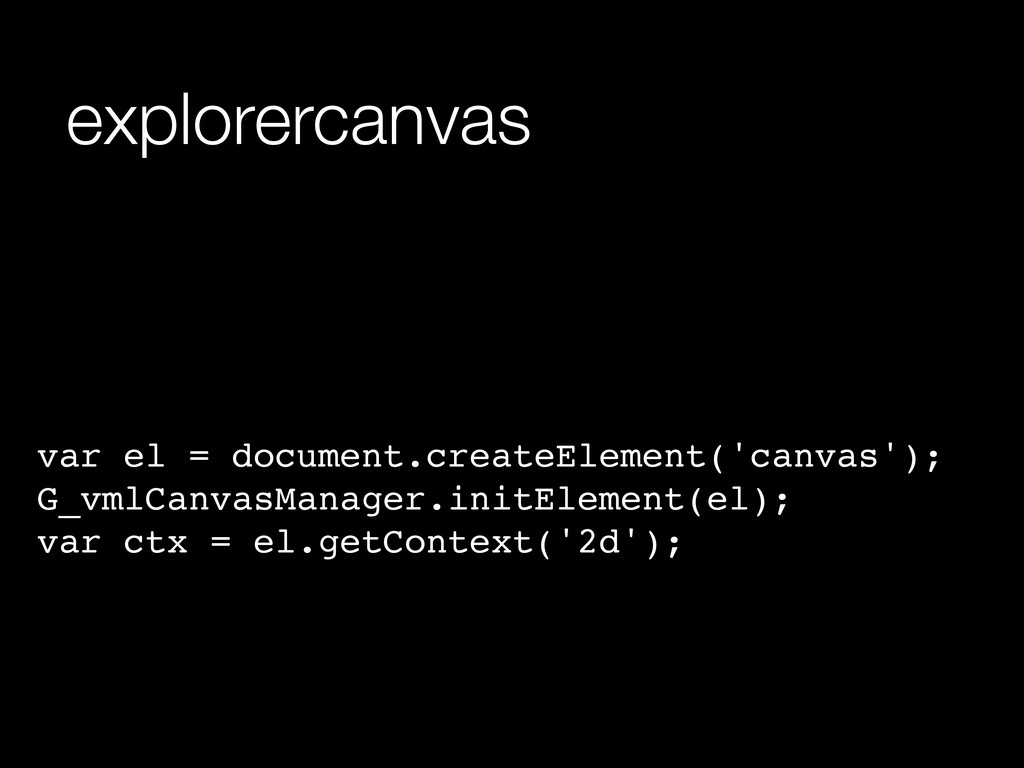
![<!--[if lt IE9]> <script src="excanvas.js"></script> <![endif]--> explorercanvas](https://files.speakerdeck.com/presentations/4f9768b5a8accb001f000915/slide_7.jpg)
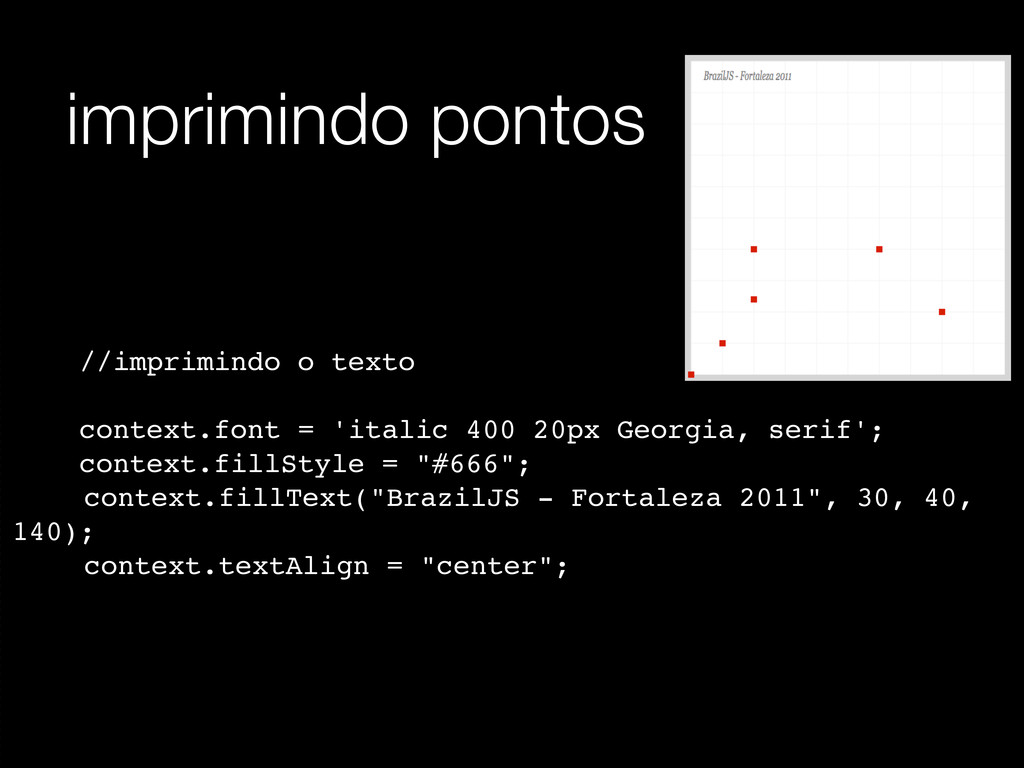
![//imprimindo os pontos for(a in data){ axis_x = data[a].x +](https://files.speakerdeck.com/presentations/4f9768b5a8accb001f000915/slide_24.jpg)
![obrigado ! [email protected] www.fellipe.com @davidsonfellipe github.com/davidsonfellipe](https://files.speakerdeck.com/presentations/4f9768b5a8accb001f000915/slide_27.jpg)