$30 off During Our Annual Pro Sale. View Details »

Data Analysis in Software Development with Software Analytics (KeepCurrentMeetup Vienna)

Data Analysis in Software Development with Software Analytics (KeepCurrentMeetup Vienna)

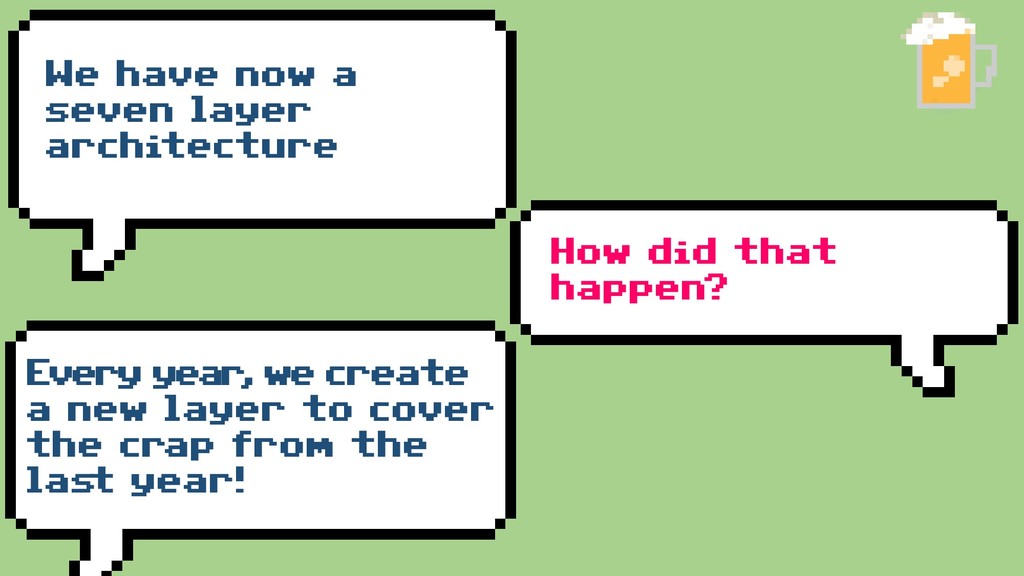
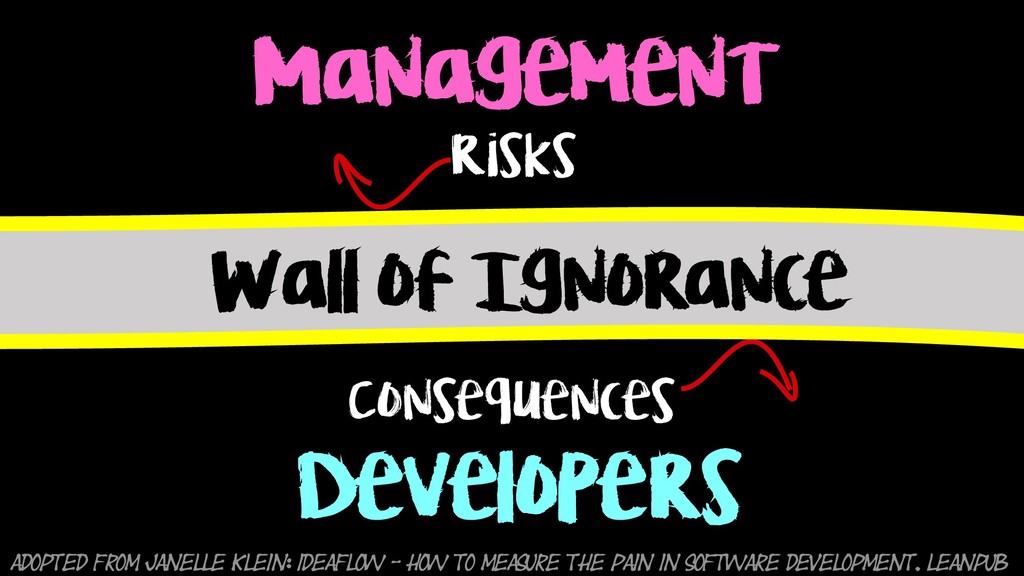
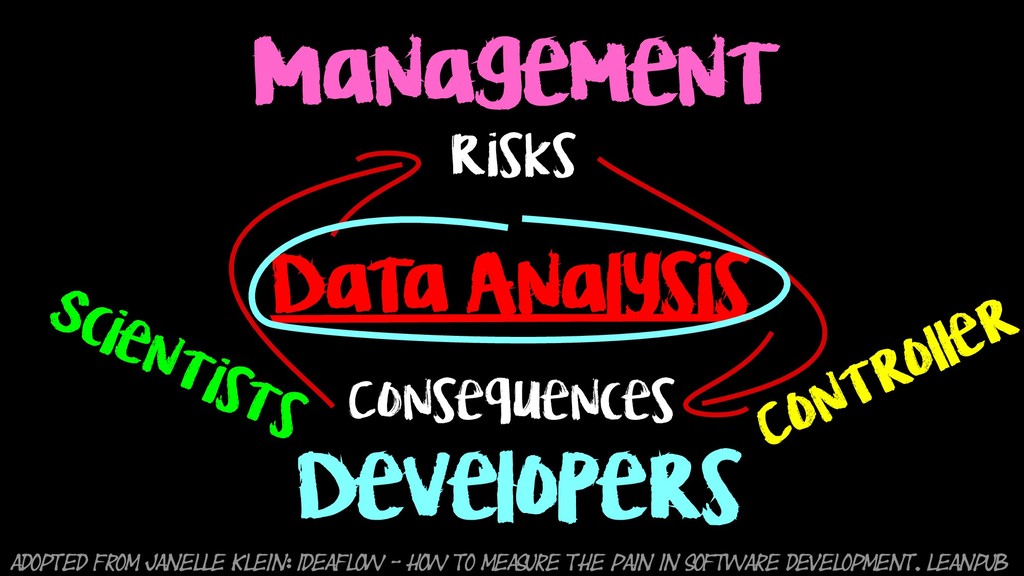
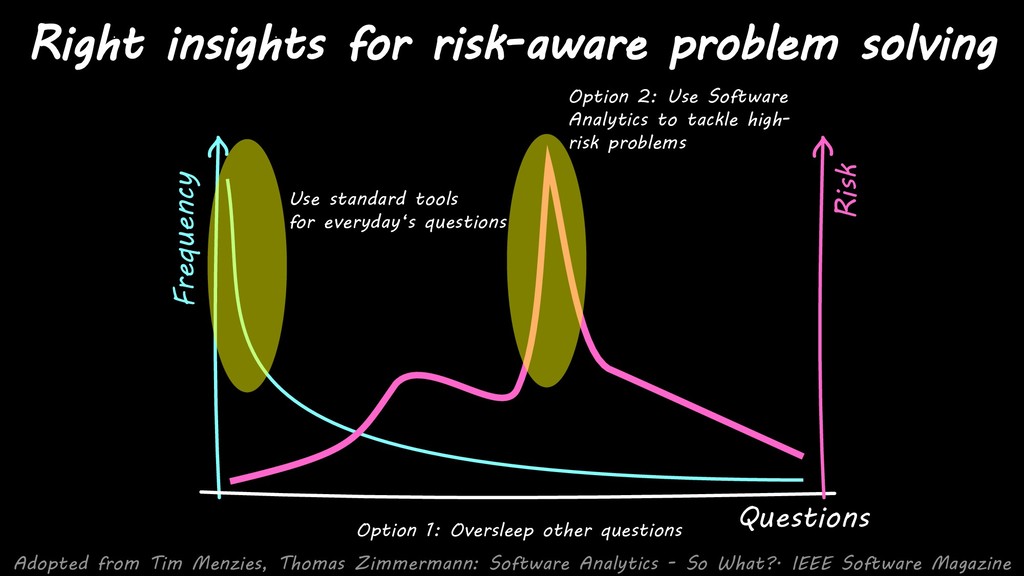
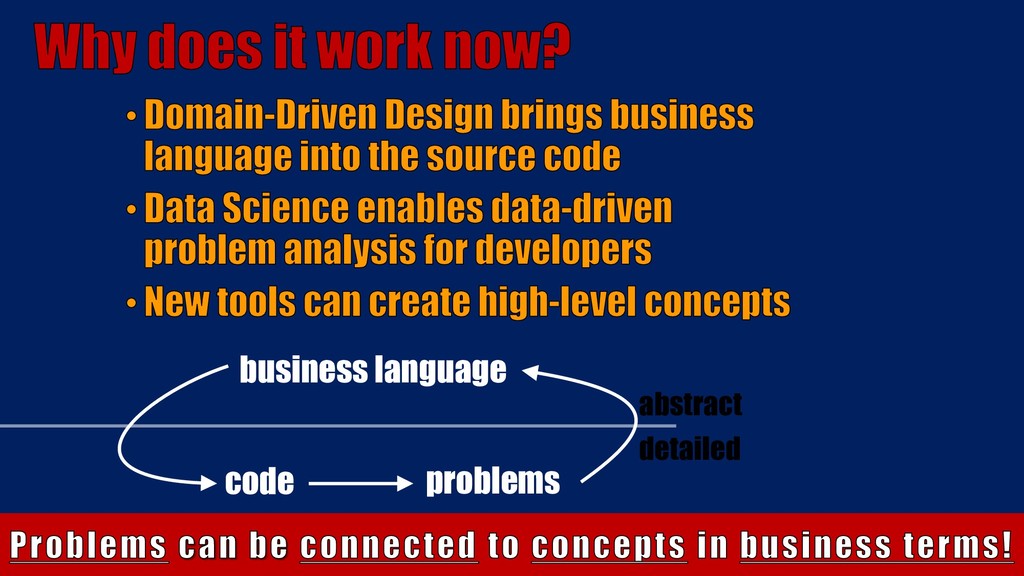
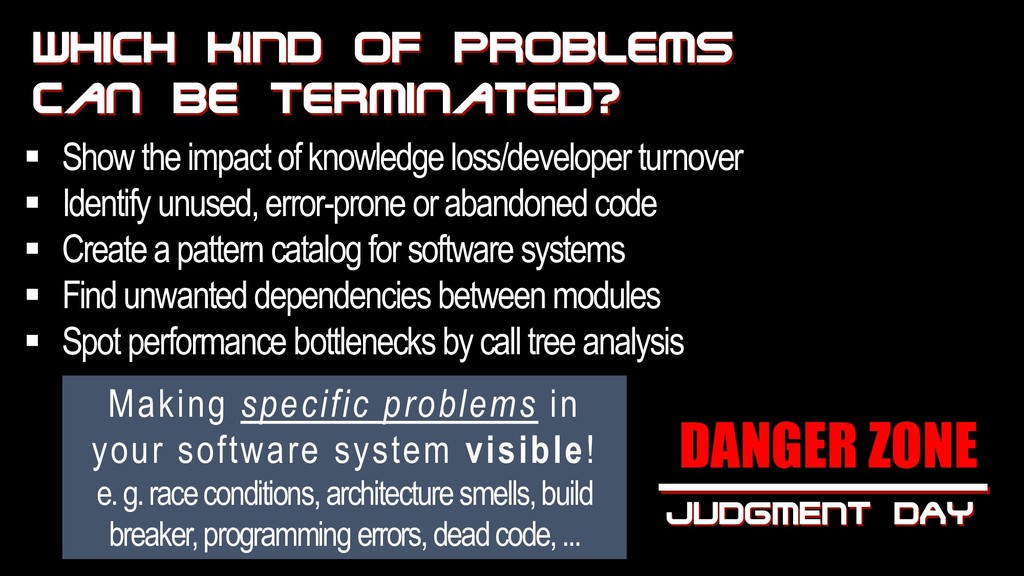
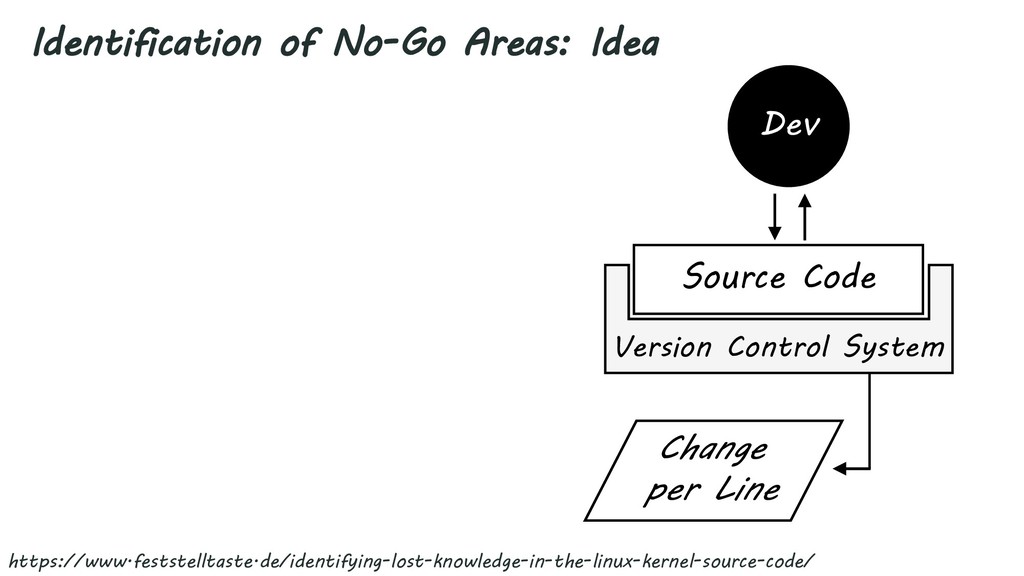
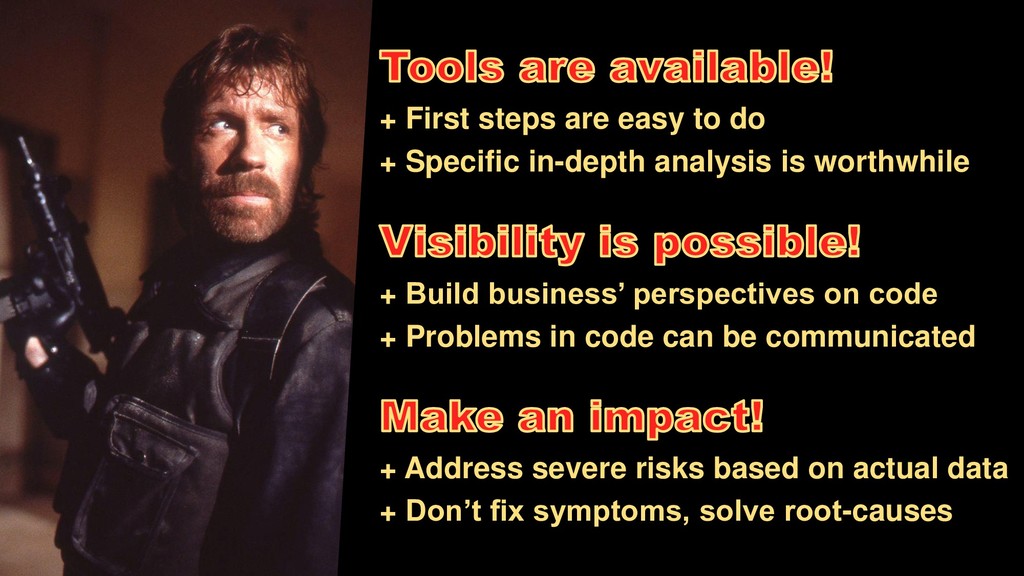
As developers, we often feel that there might be something wrong with the way we develop software. Unfortunately, a gut feeling alone isn’t enough for the complex, interconnected problems in software systems. We need solid, understandable arguments to gain budgets for improvement projects. And we can help ourselves! Every step in the development or use of software leaves valuable, digital traces. With clever analysis, these data can show us root causes of problems in our software and deliver new insights – understandable and actionable for everybody.

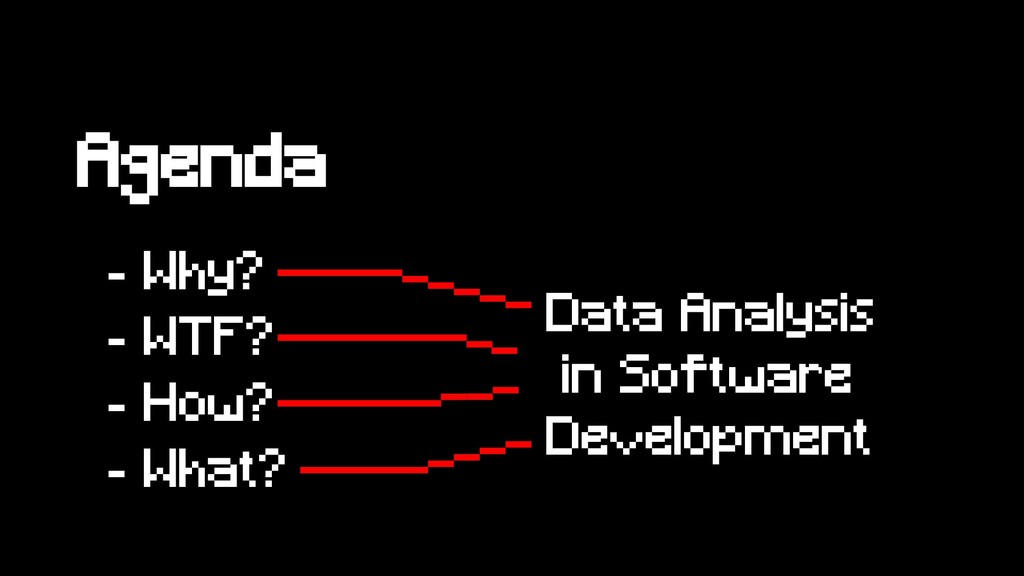
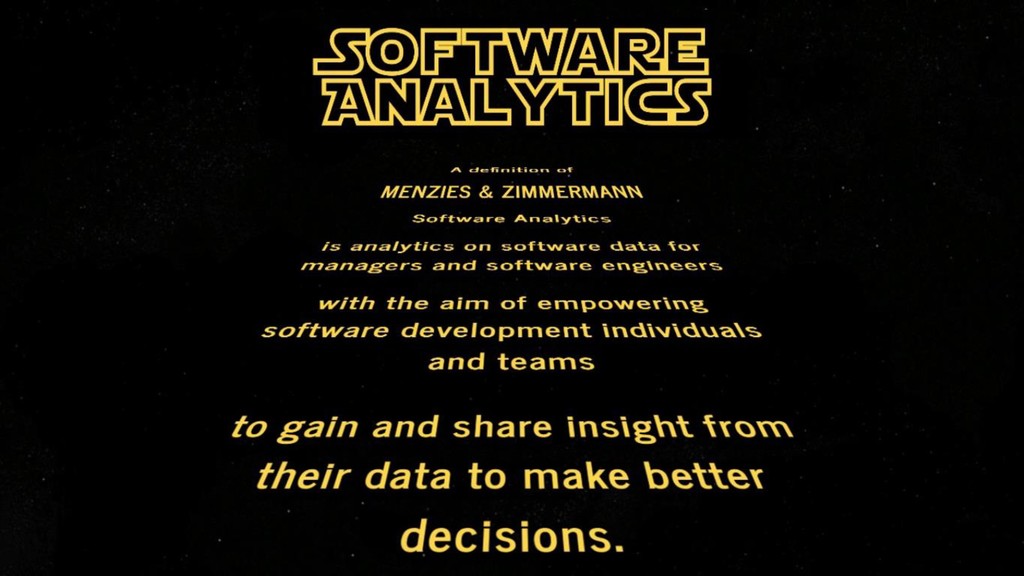
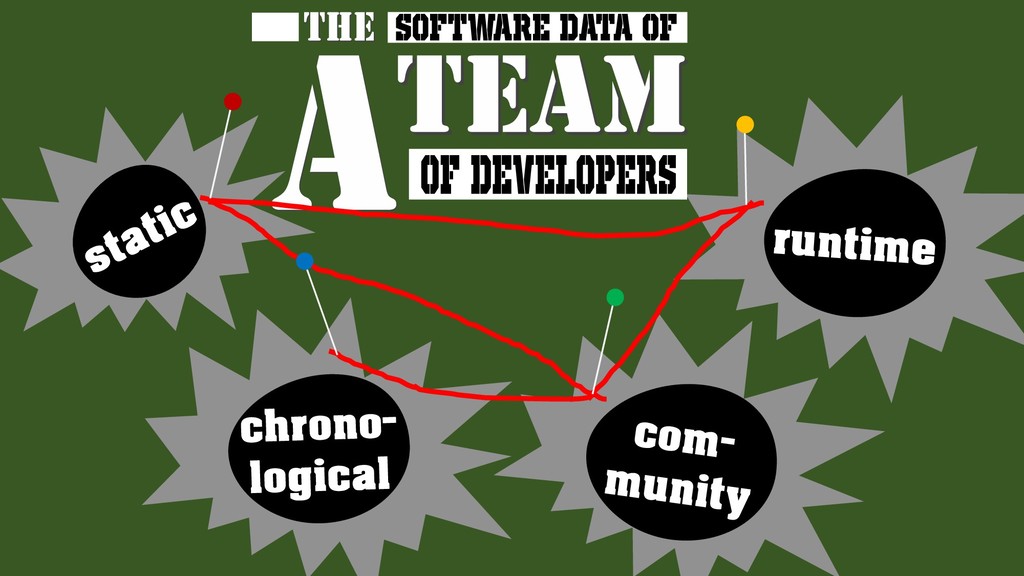
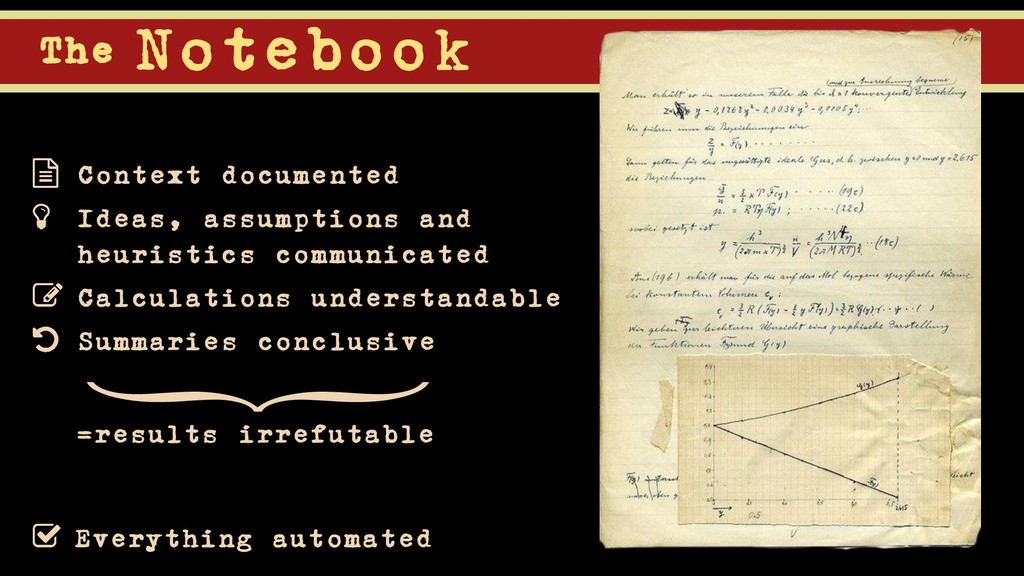
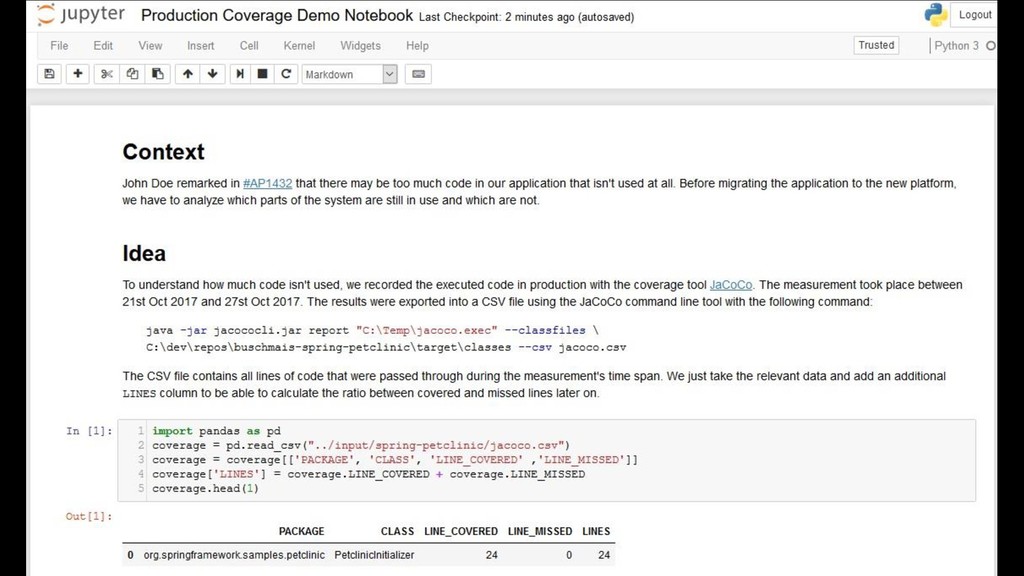
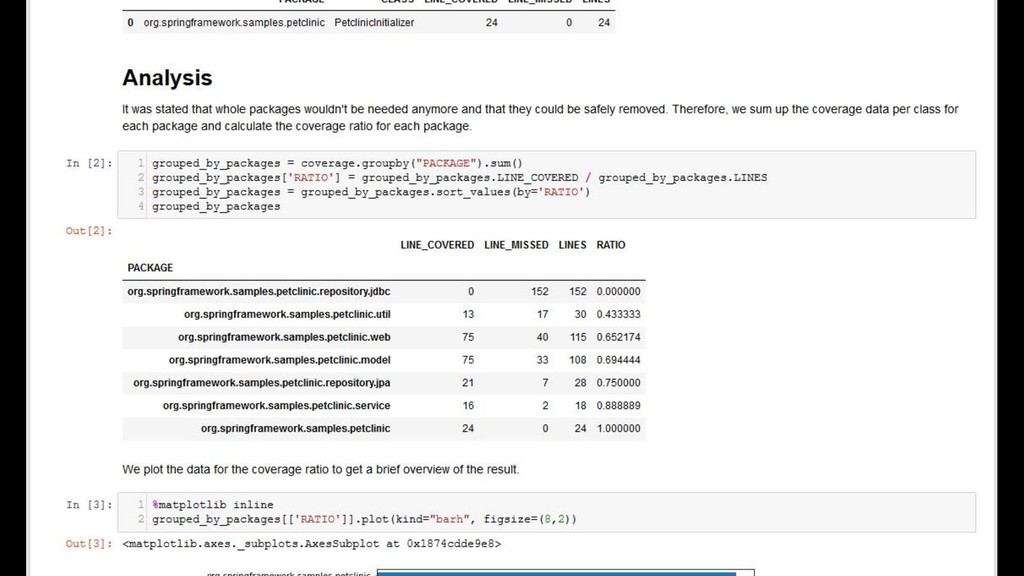
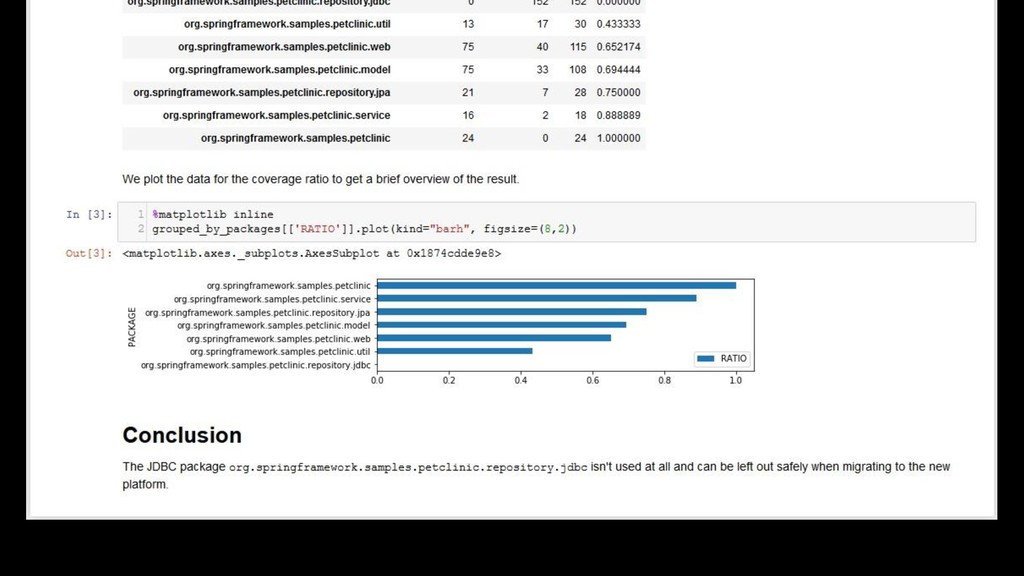
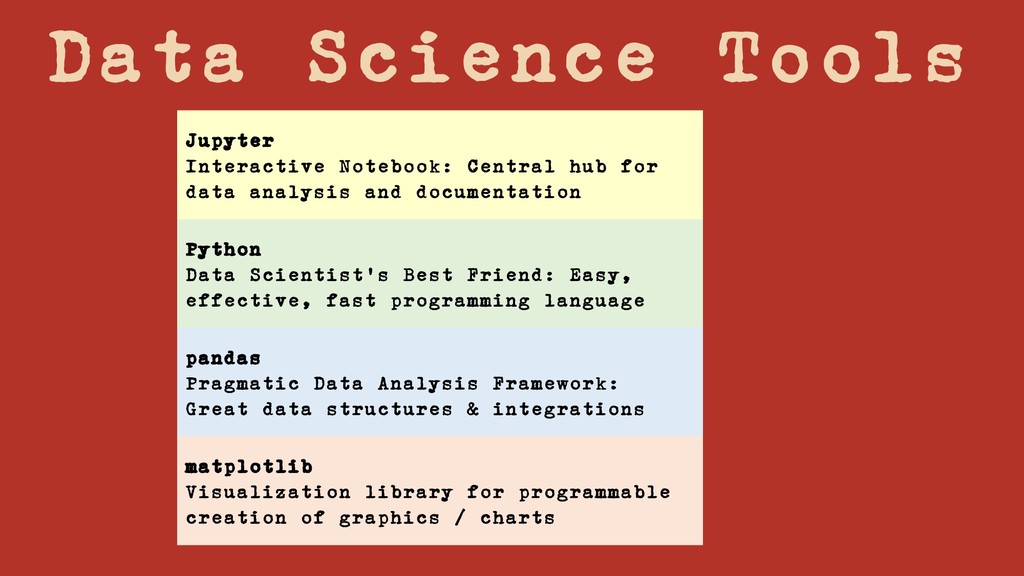
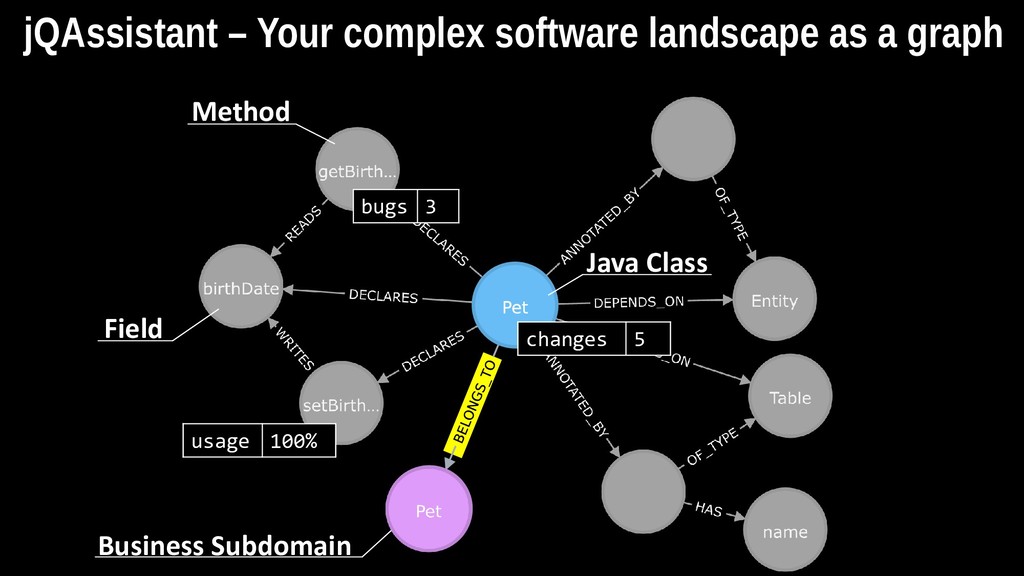
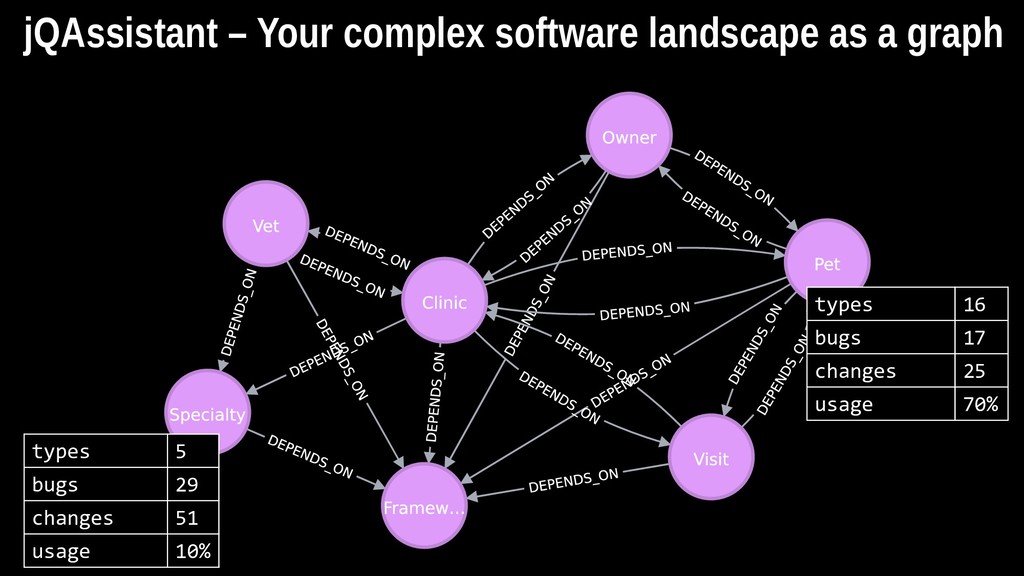
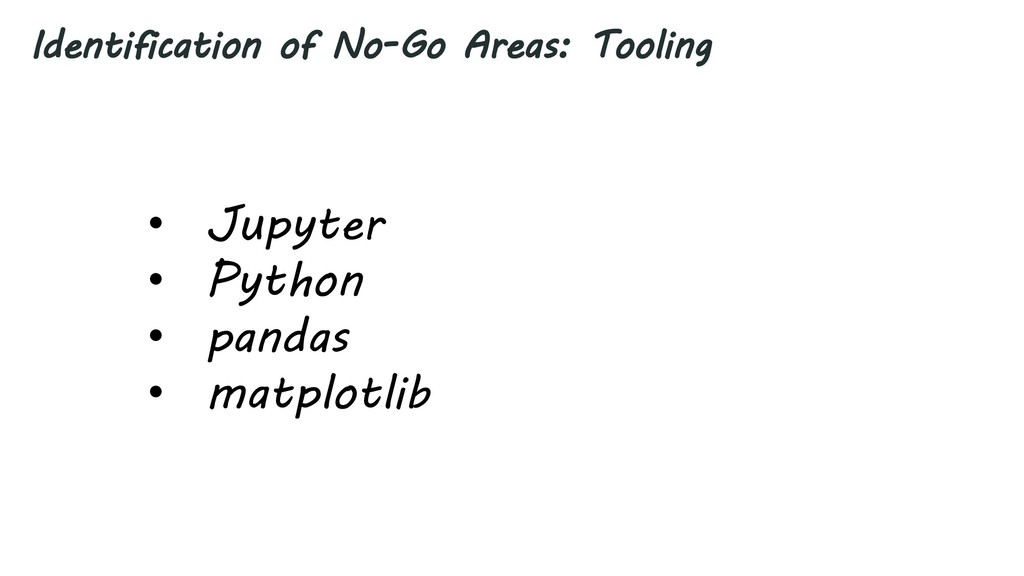
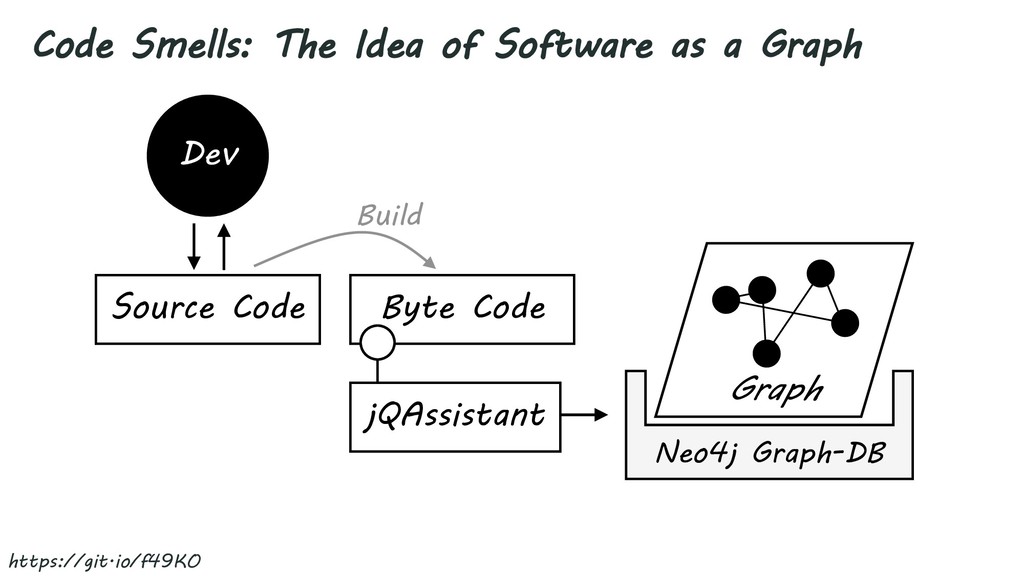
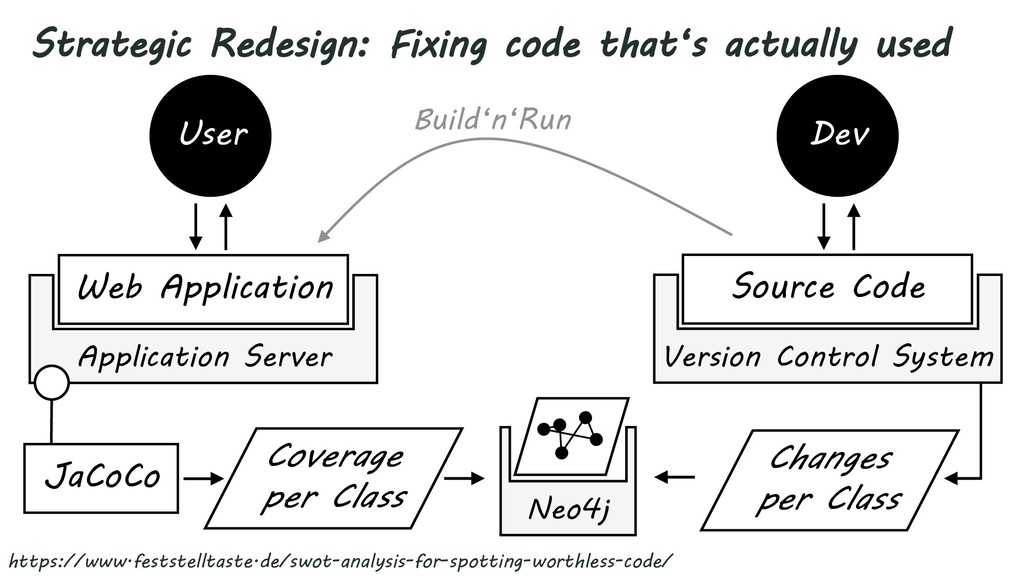
In this meetup, I talk about the analysis of software data using a digital notebook approach. This allows you to express your gut feelings explicitly with the help of hypotheses, explorations and visualizations step by step. I also show the collaboration of open source data analysis tools (Jupyter, Pandas, jQAssistant and Neo4j) to spot problems in Java applications and their environment. We have a look at knowledge loss, worthless code parts any many more real-life analysis – completely automated from raw data up to visualizations for management. Come over and learn how you can do your first data analysis in software development!

Markus Harrer

July 09, 2018
Tweet

More Decks by Markus Harrer

Other Decks in Technology

Transcript

  1. Data Analysis in
    Software Development
    with Software Analytics
    WeAreDevelopers :: Keep-Current Meetup
    9 July 2018, Vienna, Austria
    Markus Harrer
    @feststelltaste feststelltaste.de [email protected]

    View Slide

  2. Markus Harrer
    Software Development Analyst
    @feststelltaste
    Blog: feststelltaste.de
    Web: markusharrer.de
    I ♥ legacy code!

    View Slide

  3. Agenda
    - Why?
    - WTF?
    - How?
    - What?
    Data Analysis
    in Software
    Development

    View Slide

  4. WHY?

    View Slide

  5. Management

    View Slide

  6. View Slide

  7. But at the pub...

    View Slide

  8. How did that
    happen?
    We have now a
    seven layer
    architecture
    Every year
    , we create
    a new layer to cover
    the crap from the
    las
    t year!

    View Slide

  9. Symptom Fixing

    View Slide

  10. What did happend?
    Our flagship
    sof
    tware sys
    tem
    crashed yes
    terday
    in production!
    Nothing! Nobody
    uses it!

    View Slide

  11. Perceptual Discrepancy

    View Slide

  12. Management
    Developers

    View Slide

  13. 10 REWRITE
    20 SLEEP 3
    30 GOTO 10
    Software History repeating

    View Slide

  14. View Slide

  15. Management
    Developers
    Wall of Ignorance
    Risks
    Consequences
    Adopted FROM Janelle Klein: IDEAFLOW - How to Measure the PAIN in Software Development. Leanpub

    View Slide

  16. Management
    Developers
    Risks
    Consequences
    Adopted FROM Janelle Klein: IDEAFLOW - How to Measure the PAIN in Software Development. Leanpub
    Data Analysis

    View Slide

  17. How?

    View Slide

  18. EMPIRIC
    THE
    STRIKES BACK

    View Slide

  19. View Slide

  20. View Slide

  21. View Slide

  22. Frequency
    Questions
    Use standard tools
    for everyday‘s questions
    Option 2: Use Software
    Analytics to tackle high-
    risk problems
    Risk
    Right insights for risk-aware problem solving
    Option 1: Oversleep other questions
    Adopted from Tim Menzies, Thomas Zimmermann: Software Analytics - So What?. IEEE Software Magazine

    View Slide

  23. code problems
    business language
    abstract
    detailed

    View Slide

  24. View Slide

  25. The Notebook
    Everything automated
    }
    =results irrefutable
    Context documented
    Ideas, assumptions and
    heuristics communicated
    Calculations understandable
    Summaries conclusive

    View Slide

  26. View Slide

  27. View Slide

  28. View Slide

  29. Python
    Data Scientist's Best Friend: Easy,
    effective, fast programming language
    pandas
    Pragmatic Data Analysis Framework:
    Great data structures & integrations
    matplotlib
    Visualization library for programmable
    creation of graphics / charts
    Jupyter
    Interactive Notebook: Central hub for
    data analysis and documentation
    Data Science Tools

    View Slide

  30. TOOLSadvanced level
    Structural Code Analysis Framework
    1. Scan software structures
    2. Store data into graph database
    3. Create and analyze relationships
    4. Add your own concepts
    5. Find answers

    View Slide

  31. jQAssistant – Your complex software landscape as a graph
    Java Class
    Business Subdomain
    Method
    Field
    bugs 3
    changes 5
    usage 100%

    View Slide

  32. jQAssistant – Your complex software landscape as a graph
    types 16
    bugs 17
    changes 25
    usage 70%
    types 5
    bugs 29
    changes 51
    usage 10%

    View Slide

  33. WhICH KIND OF problems
    can be terminated?
    Making specific problems in
    your software system visible!
    e. g. race conditions, architecture smells, build
    breaker, programming errors, dead code, ...
    DANGER ZONE
     Show the impact of knowledge loss/developer turnover
     Identify unused, error-prone or abandoned code
     Create a pattern catalog for software systems
     Find unwanted dependencies between modules
     Spot performance bottlenecks by call tree analysis
    JUDGMENT DAY

    View Slide

  34. What?

    View Slide

  35. No-Go Areas
    Code Smells
    Strategic Redesign

    View Slide

  36. Identification of No-Go Areas: Idea
    Change per Line
    Dev
    Source Code
    Version Control System
    Change
    per Line
    https://www.feststelltaste.de/identifying-lost-knowledge-in-the-linux-kernel-source-code/

    View Slide

  37. 164) static void rb532_mask_and_ack_irq(struct irq_data *d)
    165) {
    166) rb532_disable_irq(d);
    167) ack_local_irq(group_to_ip(irq_to_group(d->irq)));
    168) }
    169)
    170) static int rb532_set_type(struct irq_data *d, unsigned type)
    171) {
    172) int gpio = d->irq - GPIO_MAPPED_IRQ_BASE;
    173) int group = irq_to_group(d->irq);
    174)
    175) if (group != GPIO_MAPPED_IRQ_GROUP)
    Identification of No-Go Areas: Starting Point
    Source Code

    View Slide

  38. Identification of No-Go Areas: Idea
    Change per Line
    164) static void rb532_mask_and_ack_irq(struct irq_data *d)
    165) {
    166) rb532_disable_irq(d);
    167) ack_local_irq(group_to_ip(irq_to_group(d->irq)));
    168) }
    169)
    170) static int rb532_set_type(struct irq_data *d, unsigned type)
    171) {
    172) int gpio = d->irq - GPIO_MAPPED_IRQ_BASE;
    173) int group = irq_to_group(d->irq);
    174)
    175) if (group != GPIO_MAPPED_IRQ_GROUP)

    View Slide

  39. Identification of No-Go Areas: Tooling
    • Jupyter
    • Python
    • pandas
    • matplotlib

    View Slide

  40. No-Go Areas
    Code Smells
    Strategic Redesign

    View Slide

  41. Code Smells: The Idea of Software as a Graph
    Dev
    Build
    Source Code
    Graph
    Byte Code
    jQAssistant
    Neo4j Graph-DB
    https://git.io/f49KO

    View Slide

  42. Code Smells: Tooling
    • jQAssistant
    • Neo4j
    • Neo4j Browser Frontend

    View Slide

  43. No-Go Areas
    Code Smells
    Strategic Redesign

    View Slide

  44. Strategic Redesign: Fixing code that‘s actually used
    Web Application
    Application Server
    User
    Coverage
    per Class
    JaCoCo
    Dev
    Build‘n‘Run&
    Source Code
    Version Control System
    Changes
    per Class
    https://www.feststelltaste.de/swot-analysis-for-spotting-worthless-code/
    Neo4j

    View Slide

  45. Strategic Redesign: Tooling
    • Jupyter
    • Python
    • pandas
    • matplotlib
    • jQAssistant
    • Neo4j

    View Slide

  46. Summary

    View Slide

  47. + First steps are easy to do
    + Specific in-depth analysis is worthwhile
    + Build business’ perspectives on code
    + Problems in code can be communicated
    + Address severe risks based on actual data
    + Don’t fix symptoms, solve root-causes

    View Slide

  48. More information
    Literature
    Christian Bird, Tim Menzies, Thomas Zimmermann:
    The Art and Science of Analyzing Software Data
    Tim Menzies, Laurie Williams, Thomas Zimmermann:
    Perspectives on Data Science for Software Engineering
    Wes McKinney: Python For Data Analysis
    Adam Tornhill: Software Design X-Ray
    Software
    Python Data Science Distribution: anaconda.com
    DataCamp: https://projects.datacamp.com/projects/111
    jQAssistant: github.com/JavaOnAutobahn/spring-petclinic
    My Repo: github.com/feststelltaste/software-analytics

    View Slide

  49. View Slide

  50. ASK ´ EM ALL

    View Slide

  51. Emoji One
    License: CC BY-SA 4.0
    Source: Wikimedia Commons (https://commons.wikimedia.org/wiki/File:Emojione_1F37A.svg)
    Edvard Munch: The Screams
    License: Public Domain
    Source: Wiki Commons (https://commons.wikimedia.org/wiki/File:The_Scream.jpg)
    Albert Einstein: Abhandlung
    Citation: Einstein, Albert: Quantentheorie des einatomigen idealen Gases – Zweite Abhandlung. In: Sitzungsberichte der preussischen Akademie
    der Wissenschaften, page 14, Reichsdruckerei
    Source: Lorentz Archive (https://www.lorentz.leidenuniv.nl/history/Einstein_archive/Einstein_1925_publication/Pages/paper_1925_12.html)
    Python Logo
    Adopted based on work by www.python.org (www.python.org)
    License: GPL (http://www.gnu.org/licenses/gpl.html)
    Source: Wikimedia Commons (https://commons.wikimedia.org/wiki/File:Python-logo-notext.svg)
    Yoni S. Hamenahem: Chuck Norris - The Delta Force 1986
    License: CC BY-SA 3.0 (https://creativecommons.org/licenses/by-sa/3.0/deed.en)
    Source: Wikimedia Common (https://commons.wikimedia.org/wiki/File:Chuck_Norris,_The_Delta_Force_1986.jpg)
    Licenses

    View Slide