$30 off During Our Annual Pro Sale. View Details »

Hi-C Data Visualization with HiPiler

Hi-C Data Visualization with HiPiler

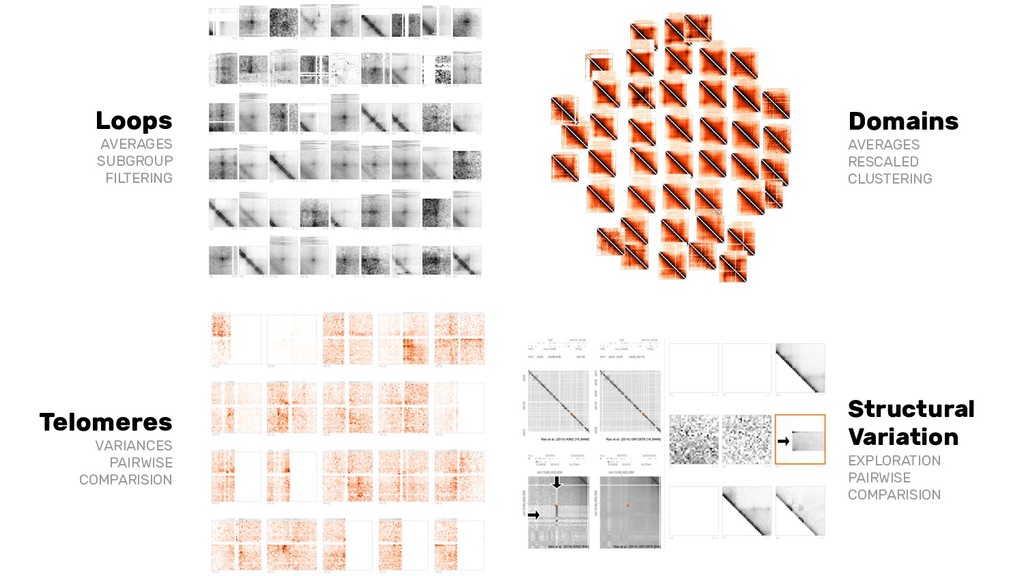
Visually Exploring Many Hi-C Features Through Visual Decomposition with HiPiler. This presentation was part of the Hi-C Data Analysis Bootcamp (https://github.com/hms-dbmi/hic-data-analysis-bootcamp) from Harvard, MIT, and UMassMed.

More at http://hipiler.lekschas.de
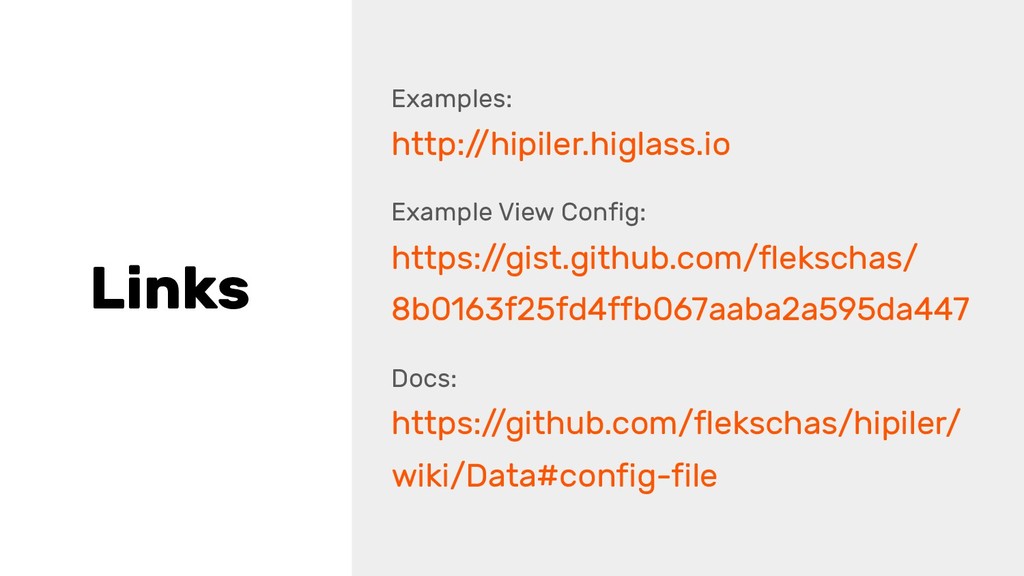
Live demo at http://hipiler.higlass.io

Fritz Lekschas

May 08, 2018
Tweet

More Decks by Fritz Lekschas

Other Decks in Science

Transcript

  1. HiPiler
    Exploring Many Hi-C Features
    Through Visual Decomposition
    Fritz Lekschas, Benjamin Bach, Peter Kerpedjiev,

    Nils Gehlenborg, and Hanspeter Pfister
    ... and special thanks to N. Abdennur, B. Alver, H. Belaghzal, A. van den
    Berg, J. Dekker, G. Fudenberg, J. Gibcus, A. Goloborodko, D. Gorkin, M.
    Imakaev, Y. Liu, L. Mirny, J. Nübler, P. Park, H. Strobelt, and S. Wang for
    their invaluable feedback during the development of HiPiler.

    View Slide

  2. View Slide

  3. Rao et al. “A 3D map of the human
    genome at kilobase resolution reveals
    principles of chromatin looping.” Cell,
    159(7):1665–1680, 2014.

    View Slide

  4. How does a specific or average Hi-C feature look?
    Are there subgroups among the extracted
    Hi-C features?
    How do Hi-C features relate to other
    derived attributes?
    How variant and noisy are Hi-C features calls?
    How do Hi-C features relate to
    each other?

    View Slide

  5. How to visually explore many local features?

    View Slide

  6. Single View Multi View Custom View
    Rao et al. “A 3D map of the human genome at
    kilobase resolution reveals principles of chromatin
    looping.” Cell, 159(7):1665–1680, 2014.

    View Slide

  7. Single View
    Simple to use
    No comparisons
    Multi View
    Comparison*
    No aggregation
    *) Of up to handful of features
    Custom View
    Highly flexible
    No interactions
    Rao et al. “A 3D map of the human genome at
    kilobase resolution reveals principles of chromatin
    looping.” Cell, 159(7):1665–1680, 2014.

    View Slide

  8. Single View
    Simple to use
    No comparisons
    ??? Custom View
    Highly flexible
    No interactions
    Time consuming
    Rao et al. “A 3D map of the human genome at
    kilobase resolution reveals principles of chromatin
    looping.” Cell, 159(7):1665–1680, 2014.
    Compare thousands
    of features
    Use metadata
    Find subgroups
    Inspect aggregates
    Interactive

    View Slide

  9. View Slide

  10. The Snippets Approach

    View Slide

  11. The Snippets Approach

    View Slide

  12. The Snippets Approach

    View Slide

  13. The Snippets Approach

    View Slide

  14. The Snippets Approach

    View Slide

  15. The Snippets Approach

    View Slide

  16. but...
    Okay

    View Slide

  17. but...
    Okay

    View Slide

  18. hipiler.higlass.io

    View Slide

  19. HiPiler
    Interactive Exploration of Many Hi-C Features

    View Slide

  20. View Slide

  21. HiGlass

    View Slide

  22. OVERVIEW, FILTERING, GROUPING
    Understand and filter results based on derived metrics

    View Slide

  23. View Slide

  24. View Slide

  25. View Slide

  26. View Slide

  27. AGGREGATION
    Assessing individual, average, and variance patterns

    View Slide

  28. View Slide

  29. View Slide

  30. SNIPPET MATRIX LINKING
    Correlation of features in their context

    View Slide

  31. View Slide

  32. SNIPPET CLUSTERING
    Interactive Subgroup Exploration

    View Slide

  33. View Slide

  34. View Slide

  35. Loops
    AVERAGES
    SUBGROUP
    FILTERING
    Telomeres
    VARIANCES
    PAIRWISE
    COMPARISION
    Domains
    AVERAGES
    RESCALED
    CLUSTERING
    Structural
    Variation
    EXPLORATION
    PAIRWISE
    COMPARISION

    View Slide

  36. Use Cases
    ● Studying Hi-C features (one pattern type)

    E.g.: Loops, TADs, compartments, ...
    ● Studying other genomic features (many pattern types)

    E.g.: Genes, motifs, protein-binding sites, ...
    ● Compare locations

    E.g.: Treatments, samples, time

    View Slide

  37. How do I get my BEDPE
    files in
    there...

    View Slide

  38. How do I get my BEDPE
    files in
    there...

    View Slide

  39. Requirements
    1. Multi-resolution cooler file
    2. BED(PE)-like set of 2D regions (incl. derived metrics)
    3. HiGlass server
    4. A modern web browser (Chrome or Firefox)

    View Slide

  40. Installation
    1. Open hipiler.higlass.io. Done

    View Slide

  41. Load loci into HiPiler
    1. Create or convert BEDPE* to CSV

    > Fast but predefined HiGlass view
    2. Create a view config

    > Slow but fully customizable HiGlass view

    View Slide

  42. chrom1 start1 end1 strand1 chrom2 start2 end2 strand2 dataset
    zoomOut
    Level
    server coords pVal _group
    22 25000 45000 + 22 25000 45000 +
    rao-
    gm12878
    -14
    2 higlass.io hg19 0.897 WT
    22 25000 45000 + 22 25000 45000 +
    rao-
    k562-14
    2 higlass.io hg19 0.833 T1
    17 25000 45000 + 21 125000 145000 +
    rao-
    gm12878
    -14
    1 higlass.io hg19 0.971 L1
    BEDPE TO CSV
    REQUIRED
    USEFUL
    NUMERICAL
    _CATEGORICAL

    View Slide

  43. chrom1 start1 end1 strand1 chrom2 start2 end2 strand2 dataset
    zoomOut
    Level
    server coords pVal _group
    22 25000 45000 + 22 25000 45000 +
    rao-
    gm12878
    -14
    2 higlass.io hg19 0.897 WT
    22 25000 45000 + 22 25000 45000 +
    rao-
    k562-14
    2 higlass.io hg19 0.833 T1
    17 25000 45000 + 21 125000 145000 +
    rao-
    gm12878
    -14
    1 higlass.io hg19 0.971 L1
    BEDPE TO CSV
    REQUIRED
    USEFUL
    NUMERICAL
    _CATEGORICAL
    Defined by you
    From higlass.io

    (or your own instance)

    View Slide

  44. A Peak Into the Future
    (in about one week...)

    View Slide

  45. Create View Config for HiPiler
    1. Create or convert BEDPE* to JSON
    2. Define how features should be cut out
    3. Create HiGlass view for the matrix

    View Slide

  46. HiPiler

    View Config
    {
    "fgm": {
    "fragmentsServer": "http:/
    /higlass.io/",
    "fragments": [ ... ],
    "fragmentsDims": 20,
    "fragmentsPercentile": 100,
    "fragmentsPadding": 0,
    "fragmentsIgnoreDiags": 0,
    "fragmentsNoBalance": false,
    "fragmentsPrecision": 2,
    "fragmentsNoCache": false,
    },
    "hgl": { ... }
    }

    View Slide

  47. HiPiler

    View Config
    {
    "fgm": { /
    / Defines snippets view
    "fragmentsServer": "http:/
    /higlass.io/",
    "fragments": [ ... ],
    "fragmentsDims": 20,
    "fragmentsPercentile": 100,
    "fragmentsPadding": 0,
    "fragmentsIgnoreDiags": 0,
    "fragmentsNoBalance": false,
    },
    "hgl": { ... } /
    / Defines HiGlass view
    }

    View Slide

  48. HiPiler

    View Config
    {
    "fgm": {
    "fragmentsServer": "http:/
    /higlass.io/", /
    / HiGlass
    server
    "fragments": [ ... ] /
    / BEDPE-like loci
    "fragmentsDims": 20, /
    / Number of bins
    "fragmentsPercentile": 100, /
    / Upper percentile capping
    "fragmentsPadding": 0, /
    / Padding relative to loci
    "fragmentsIgnoreDiags": 0, /
    / Num. of ignored diagonals
    "fragmentsNoBalance": false, /
    / Cooler balancing
    },
    "hgl": { ... }
    }

    View Slide

  49. BEDPE
    JSON
    ARRAY
    REQUIRED
    NUMERICAL
    _CATEGORICAL
    [
    ["chrom1", "start1", "end1", "strand1", "chrom2", "start2",
    "end2", "strand2", "dataset", "zoomOutLevel", "corner-score",
    "U-var", "L-var", "U-sign", "L-sign", "_group"],
    ["22", 17425000, 17545000, "+", "22", 17425000, 17545000,
    "+", "rao-gm12878-1kbmr", 1, 0.91491, 0.061801, 0.033795,
    0.60558, 0.6278, 1],
    ["22", 17555000, 17645000, "+", "22", 17555000, 17645000,
    "+", "rao-k563-1kbmr", 1, 0.89306, 0.035257, 0.020245,
    0.54321, 0.69136, 1],
    ...
    ]
    HEADER
    LOCI

    View Slide

  50. BEDPE
    JSON
    ARRAY
    REQUIRED
    NUMERICAL
    _CATEGORICAL
    Pandas DataFrame:

    json.dumps(
    [list(df.columns)] + df.values.tolist()
    )
    R Data Frame:
    library(jsonlite)
    noquote(paste(
    "[", toJSON(c(colnames(df), "name")), ",",
    substring(toJSON(df, dataframe='values'), 2),
    sep=""
    ))

    View Slide

  51. HiGlass
    View
    Config
    1 Row Only
    Disable editing
    (recommended)

    View Slide

  52. Links
    Examples:
    http:/
    /hipiler.higlass.io
    Example View Config:
    https:/
    /gist.github.com/flekschas/
    8b0163f25fd4ffb067aaba2a595da447
    Docs:
    https:/
    /github.com/flekschas/hipiler/
    wiki/Data#config-file

    View Slide

  53. HiPiler
    SLIDES:

    DEMO:
    PROJECT:
    DOCS:
    CODE:

    github.com/hms-dbmi/hic-data-analysis-
    bootcamp
    hipiler.higlass.io
    hipiler.lekschas.de
    hipiler.higlass.io/docs
    github.com/flekschas/hipiler

    View Slide